


Although Bitcoin (BTC) is still struggling to regain the $20,000 level, bullish signals are emerging on the long-term chart.
The largest cryptocurrency has broken out above the descending resistance line, which has been in place for 331 days since last year’s all-time high (ATH).
In addition, Bitcoin is about to break out of a short-term ascending triangle pattern, which often signals a trend reversal. Moreover, the daily RSI has generated two drives of bullish divergence.
Breakout from long-term resistance line
BTC reached an ATH of $69,000 on Nov. 10. Since then, it has been dropping and reached a low of $17,567 on June 18. This represents a 74% decline against the ATH so far.
The bear market on the BTC chart has been going on for 331 days. During this time, the price of BTC has had no significant bounces, giving long-term investors few opportunities to exit long positions.
Bitcoin has followed a descending resistance line over this period, which it has only tested twice (blue arrows).
The first time was in late March at a local peak at $48,240, and the second in mid-Sept. in the $22,800 area. On both occasions, the price was rejected.
This week, however, BTC finally managed to break above this descending line of resistance, while regaining the $20,000 level (blue circle).
However, the initial surge did not find a continuation, and at publication time Bitcoin has once again lost this psychological area.
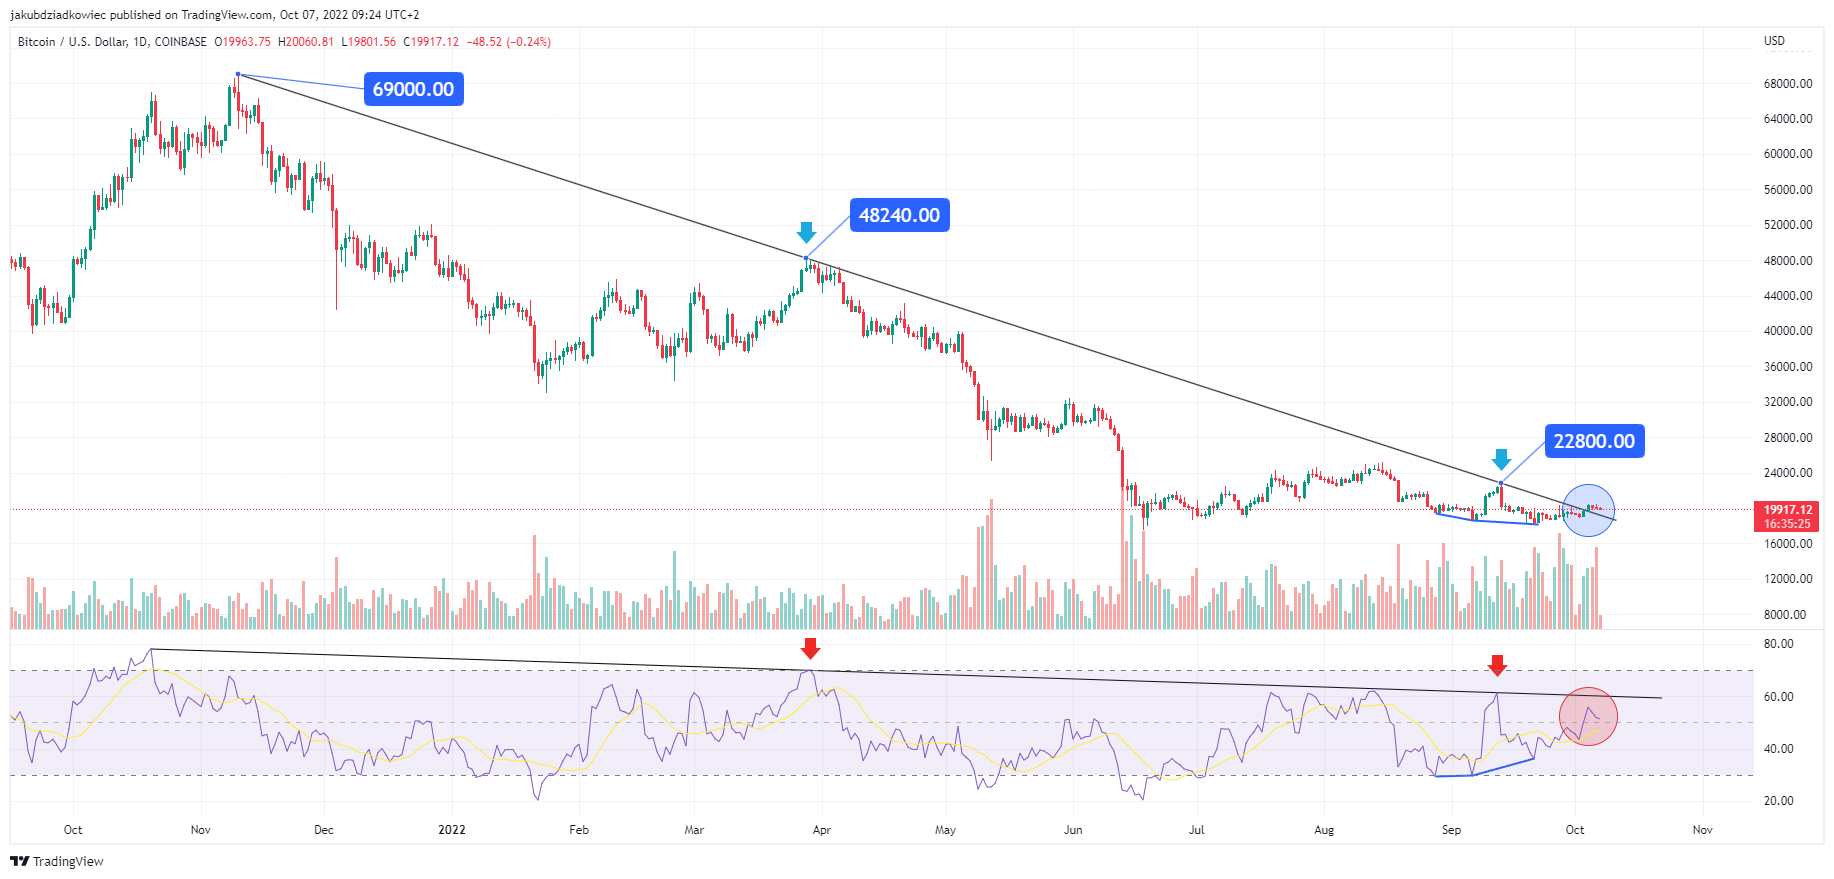
Unfortunately, the breakout from the 331-day resistance line is not confirmed on the daily RSI. Here we also see two rejections from the falling resistance line (red arrows).
However, the indicator has currently failed to break out or even reach its own descending resistance line (red circle), suggesting weakness in the overall movement.
On the other hand, the RSI has regained the 50 area, the maintenance of which is crucial for initiating a bullish bounce. Moreover, a double bullish divergence (blue line) has appeared on the chart.
However, if this divergence is to play out, the RSI must reach and break through its own descending resistance line, which is currently near 60.
Bitcoin forms an ascending triangle
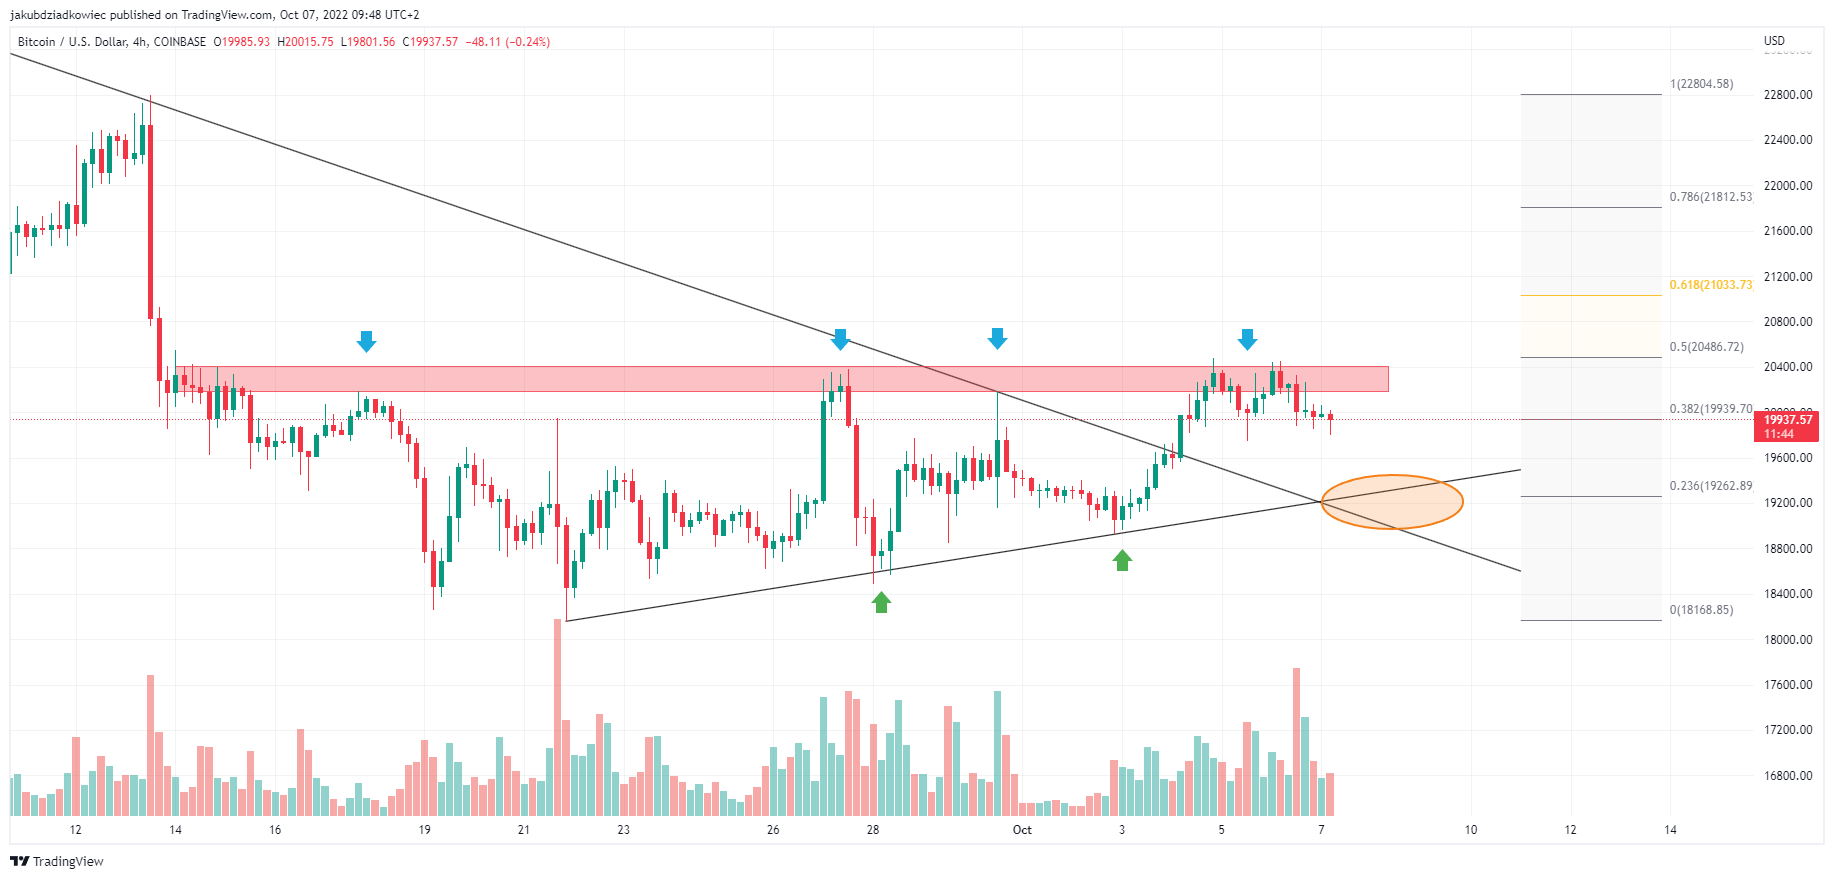
A closer look at the four-hour chart shows that the breakout from the long-term descending resistance line coincided with reaching the short-term resistance area in the range of $20,200 to $20,400 (red rectangle).
This area has been in place since mid-Sept. and has been tested four times so far (blue arrows). It is located near the 0.5 Fib retracement level, measuring for the last decline.
At the same time, a rising support line has formed at the bottom of the chart, which the price has already validated twice (green arrows). Therefore, it is possible to speak of the emergence of an ascending triangle pattern on the four-hour time frame.
An ascending triangle is a bullish pattern that often appears in the continuation of an uptrend. It can also occur as a reversal pattern at the end of downtrends.
If the rising support line were to be validated once again, a short-term BTC decline to the $19,200 area (orange ellipse) is not out of the question.
Moreover, this drop could also serve to validate the long-term resistance line as support. In turn, this could become the catalyst for a significant bounce, breaking out of the ascending triangle and starting a new uptrend.
For Be[In]Crypto’s previous Bitcoin (BTC) analysis, click here.
Disclaimer: Be[in]Crypto strives to provide accurate and up-to-date information, but it will not be responsible for any missing facts or inaccurate information. You comply and understand that you should use any of this information at your own risk. Cryptocurrencies are highly volatile financial assets, so research and make your own financial decisions.


