


A look at on-chain indicators, more specifically the ratio between the realized and market capitalization levels, in order to draw parallels to previous bull runs.
The current ratio between the realized and market capitalization levels has historically been marked with bottoms.
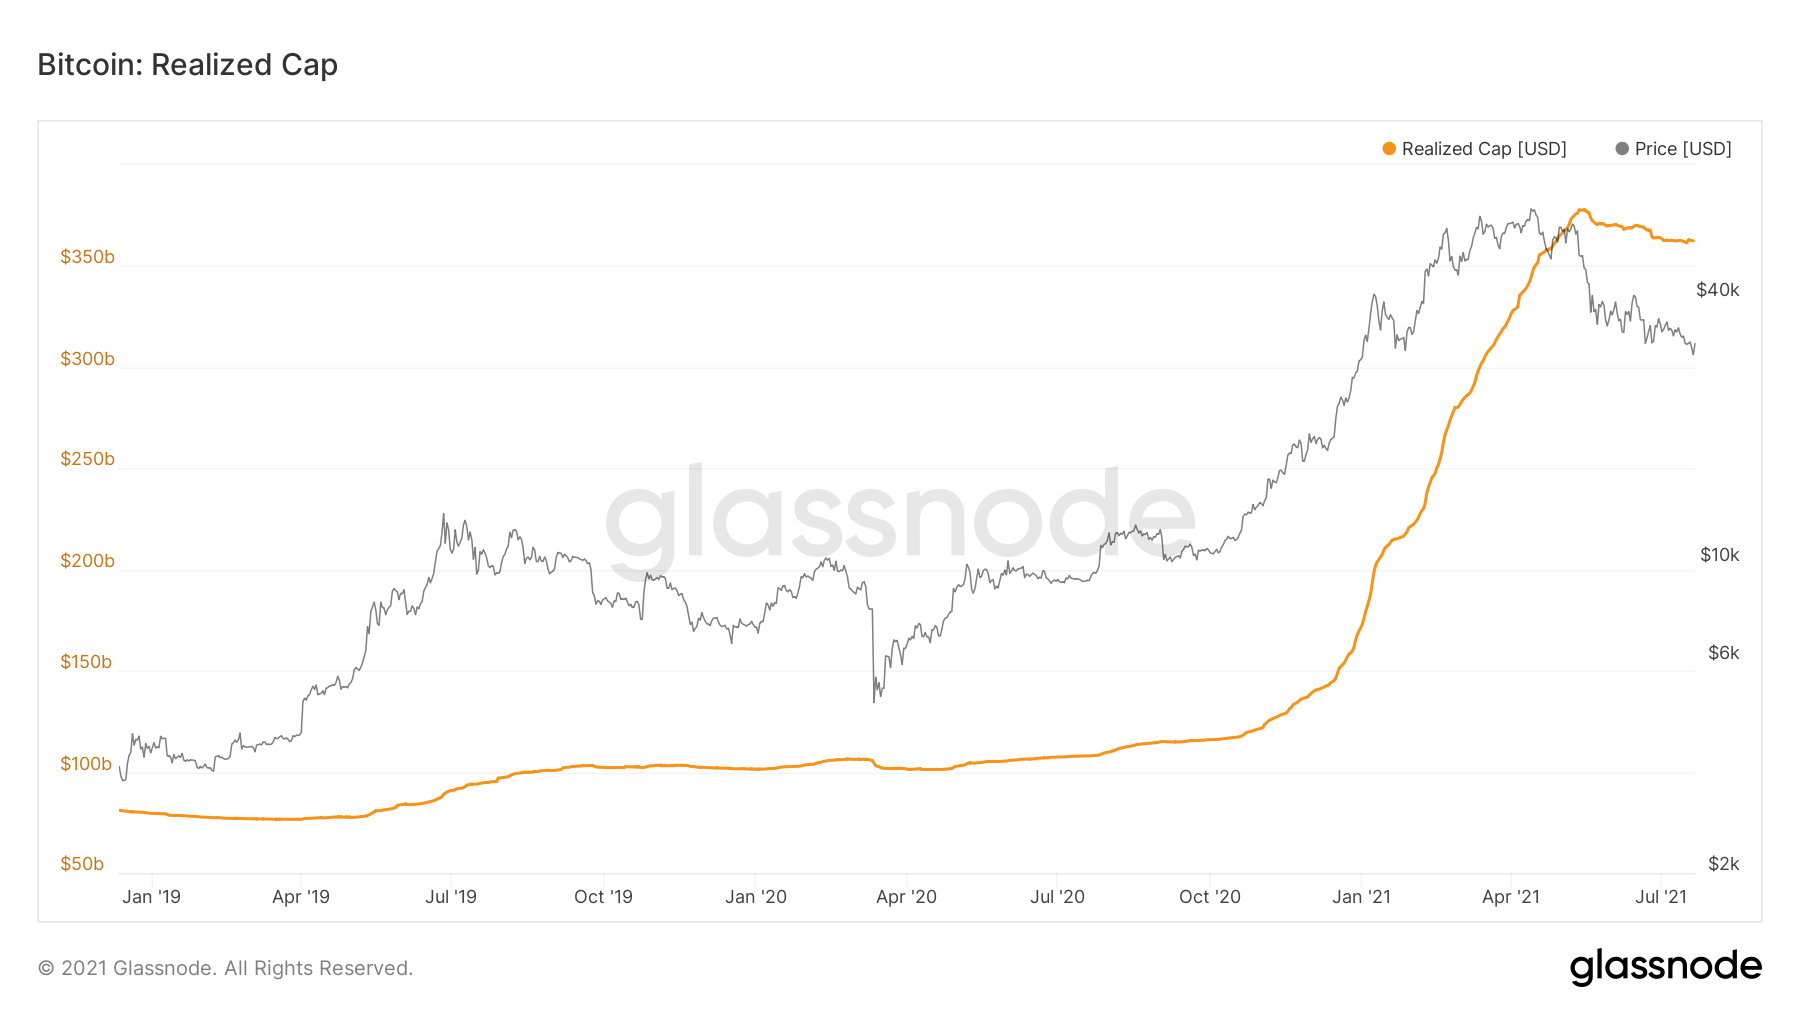
BTC realized cap
The BTC market cap (MC) is generated by multiplying the market price of BTC with total number of mined coins. The realized cap (RC) also uses a similar multiplication. However, instead of taking the market price, it uses the price at the time of the most recent Unspent Transaction Output (UTXO).
This is done in order to devalue coins that are lost of that haven’t moved in a considerable period of time.
The realized cap has been moving upwards at an accelerated rate since April 2019.
It reached an all-time high of $377,795 Billion on May 15. This occurred roughly one month after the market cap reached its all-time high.
RC has been moving downwards since, and is currently at $362 Billion. This means that participants are selling coins at a loss, therefore causing the drop in RC. Since the all-time high, there has been roughly $15 billion in losses in the market.
MC approaches RC
A closer look at the historical movement of this on-chain indicator shows that MC has fallen below RC in December 2018 and March 2020. These two periods of time also marked cyclical bottoms.
On Dec. 2018, MC stayed below RC for five months, while in March 2020 for it did so for less than one month.
As for the ratio between the two, RC is currently 64% of MC. This is a relatively high value, since the former is usually less than 50% of the latter.
At the time of the market cap all-time high in April 2021, RC was 25% of MC.
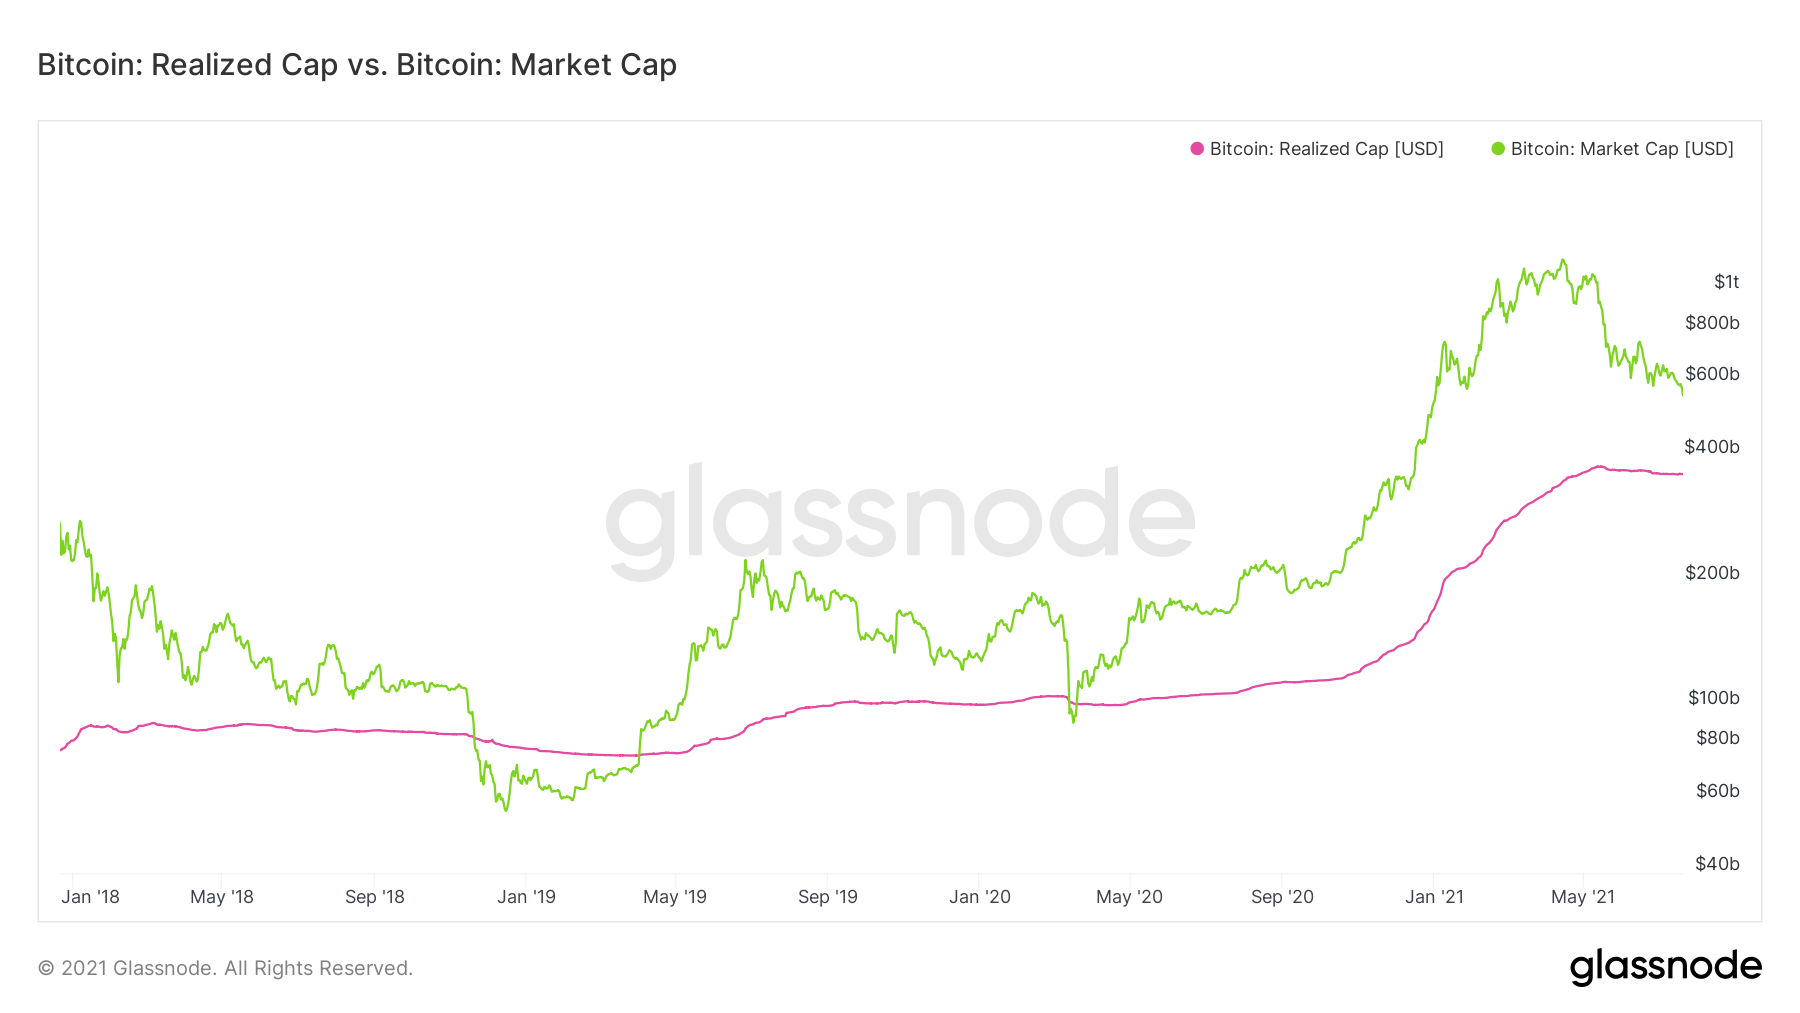
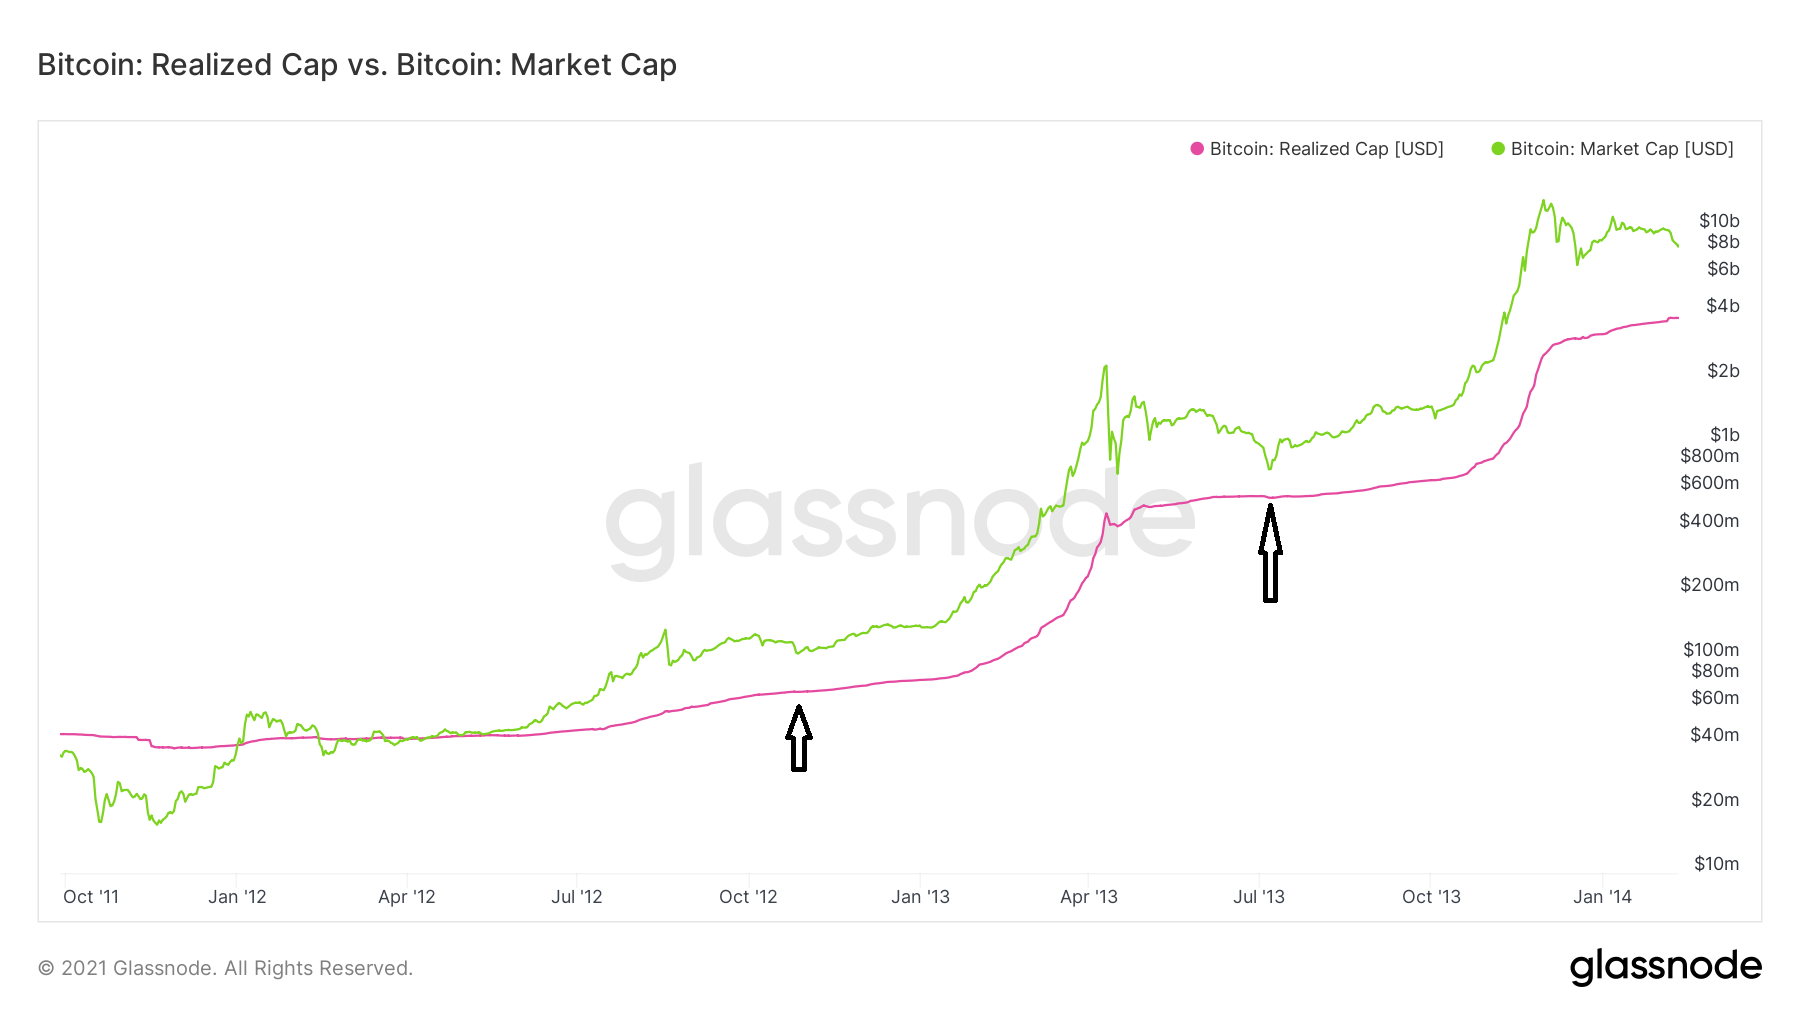
In the 2017 run, similarly high ratios were reached on Jan. 17, (78%) & Aug. 21, (66%) 2016. In addition, ratios above 50% were reached on Jan. 13, (55%) and March 25,(52%) 2017. These four periods are denoted by the black arrows in the chart below. All four marked local bottoms.
Throughout the rest of 2015-2018, realized cap was less than 50% of the market cap.

2012-2015 bull run
Going back to the previous bull run, we can see that MC fell below RC on Feb. 2012. This also marked an absolute bottom prior to the beginning of the bull run.
RC was at 64% of MC on Oct. 2012 and was 73% on July 2013. It was below 50% for the rest of the bull run.
To conclude, this data shows that the current bull run has been marked with much more selling at a loss than previous upward movements, therefore has caused a significant drop in RC. In addition to this, the current ratio between RC/MC has historically marked local bottoms.
For BeInCrypto’s latest bitcoin (BTC) analysis, click here.


