


In today’s on-chain analysis, BeInCrypto looks at several indicators for long- and short-term Bitcoin holders to determine the health of the current cryptocurrency market. The capitulation of two types of BTC holders means that the market is severely cooled, and the bottom may have already been reached.
BTC holders are divided into two groups, separated by a somewhat arbitrary 155-day threshold. Users who hold their coins for more than 155 days are referred to as long-term holders (LTH). In contrast, users who hold their coins for less than 155 days are short-term holders (STH).
The cryptocurrency market tends to reward those participants who are able to hold their assets for the long term. The history of the BTC price shows that an effective method of avoiding high local volatility is the HODL strategy. It involves buying and holding your cryptocurrencies for the long term, regardless of their current price.
Therefore, coins in the hands of LTHs tend to be profitable, depending less on local fluctuations in the BTC price. The situation is different for STHs, whose portfolios depend heavily on short-term trends in the cryptocurrency market.
LTH profits are declining
Although long-term holders tend to be in better shape than short-term holders, there are market conditions in which their coins are also in little profit or experiencing a loss. This is well illustrated by a chart published in a recent report from Glassnode, which juxtaposes the monthly and annual SOPR for LTH.
Spent Output Profit Ratio (SOPR) is calculated by dividing the realized value (in USD) by the value at creation (USD) of the spent output. In other words, it is a simple ratio between the selling price and the purchase price of coins.
By taking into account the two moving averages for the monthly and annual periods, the market can be divided into two periods. When the monthly profitability exceeds the annual profitability (orange), the market enters an overheated state. That’s when LTHs spend more and get higher and higher returns. Conversely, when the monthly profitability is less than the annual profitability (red), this suggests that an extended bear market is underway, and LTHs’ profits are falling or they are experiencing losses.
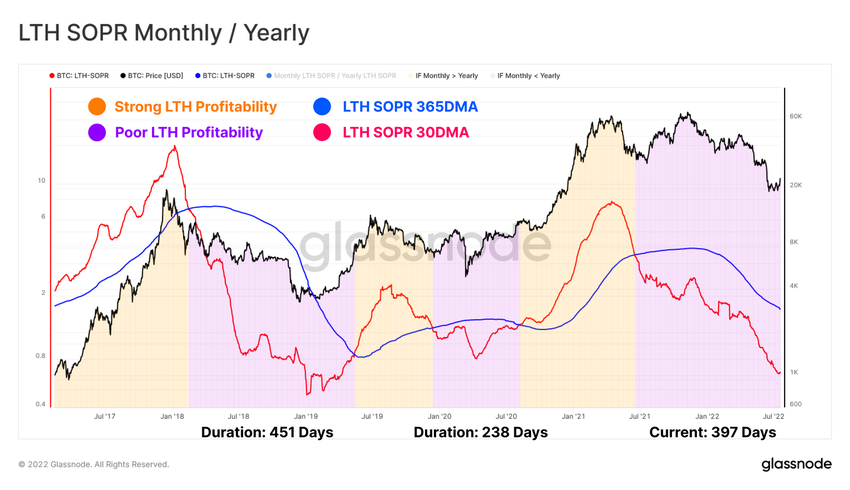
It is worth noting that the current bear market has been going on – according to the chart above – since June 2021. So, the all-time high of $69,000 in November 2021 was reached during the bear market – taking into account the relationship of the LTH SOPR indicators.
Moreover, the red period has already lasted for almost 400 days, which is close to the 2018-2019 bear market. In addition, the depth of the decline in the LTH SOPR 30-day moving average (red) is getting closer and closer to the January 2019 lows. The chart has also already fallen well below the March-April 2020 lows.
Long-term holders – capitulation continues
Another indicator of the condition of long-term holders seems to confirm the above data. With Bitcoin falling below $20,000 in mid-June 2022, the so-called LTH capitulation has been reached. It means that the price of BTC has fallen below the long-term holders’ costs (green area).
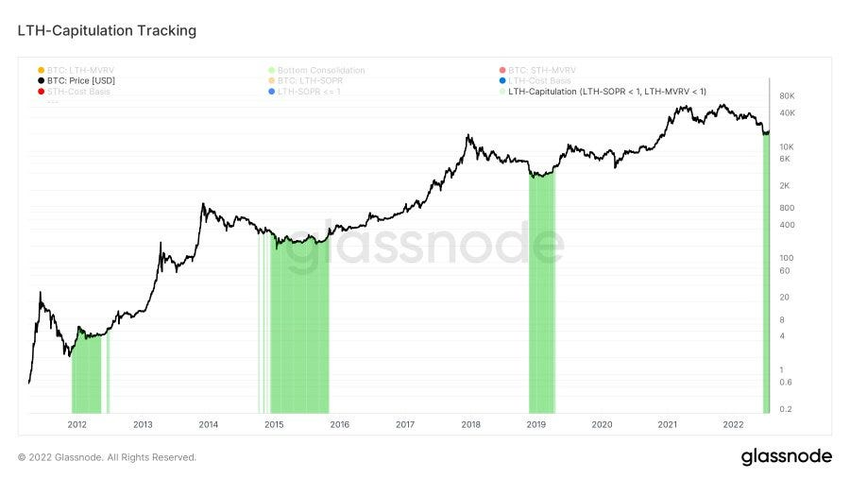
Earlier in its history, Bitcoin experienced 3 periods when LTHs decided to sell their coins below the cost of purchase. This took place during the lows of all three historical bear markets: 2012, 2015 and 2018-2019. If history is any indication here, chances are that the $20,000 area will serve as the bottom of the current bear market.
STH cost basis
It’s still worth taking a look at one of the indicators for short-term Bitcoin holders. Their losses, as they entered the market several months ago, are far greater than LTH’s losses.
The cost basis chart for STH shows their realized price, or the level at which they bought BTC on average (pink). It is currently trading at around $28,000. The lower the STH cost basis, the less selling pressure for the market.
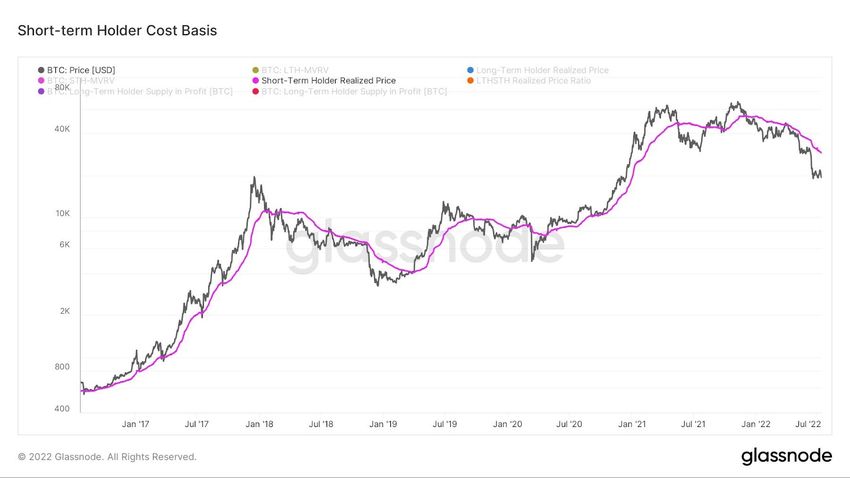
The $28,000 area, on the other hand, could be an area of strong resistance, as many STHs will decide to sell their coins to break even. Moreover, this level remains in confluence with technical resistance areas in this range. In addition, the CME gap triggered by the mid-June declines remains in the $27,600-$28,600 area.
For Be[in]Crypto’s latest Bitcoin (BTC) analysis, click here.


