


Bitcoin (BTC) has been increasing at an accelerated rate over the past three days and managed to reach a local high of $24,442 on July 29.
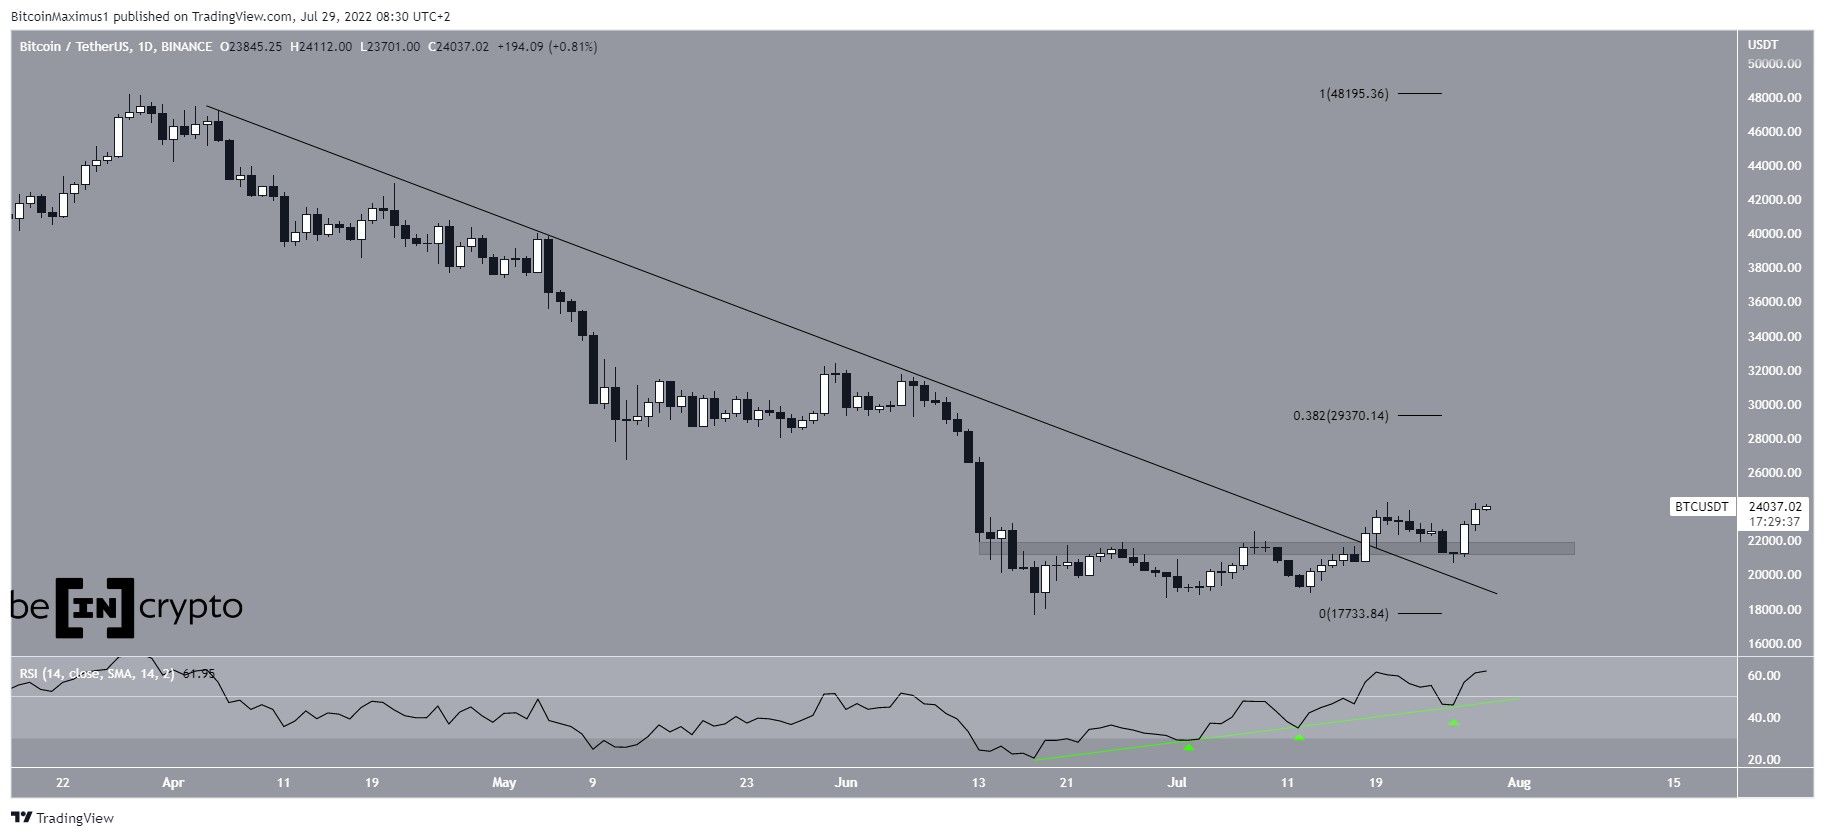
Bitcoin had been trading beneath a descending resistance line since the beginning of April. This downward movement led to a long-term low of $17,622 on June 18.
Bitcoin has been increasing gradually since then and broke out above the line on July 18. Initially, the price decreased, but it validated the $21,600 horizontal support area on July 26 and accelerated after. So far, it has reached a local high of $24,442.
The daily RSI is extremely bullish. At the time when Bitcoin bounced at the $21,600 support area, the RSI rebounded from its ascending support trendline (green line) for the third time. Now, it has moved above 50 in what is often considered a sign of a bullish trend.
If the upward move continues, the closest resistance area would likely be found at $29,370. This target is the 0.382 Fib retracement resistance level.
Short-term breakout
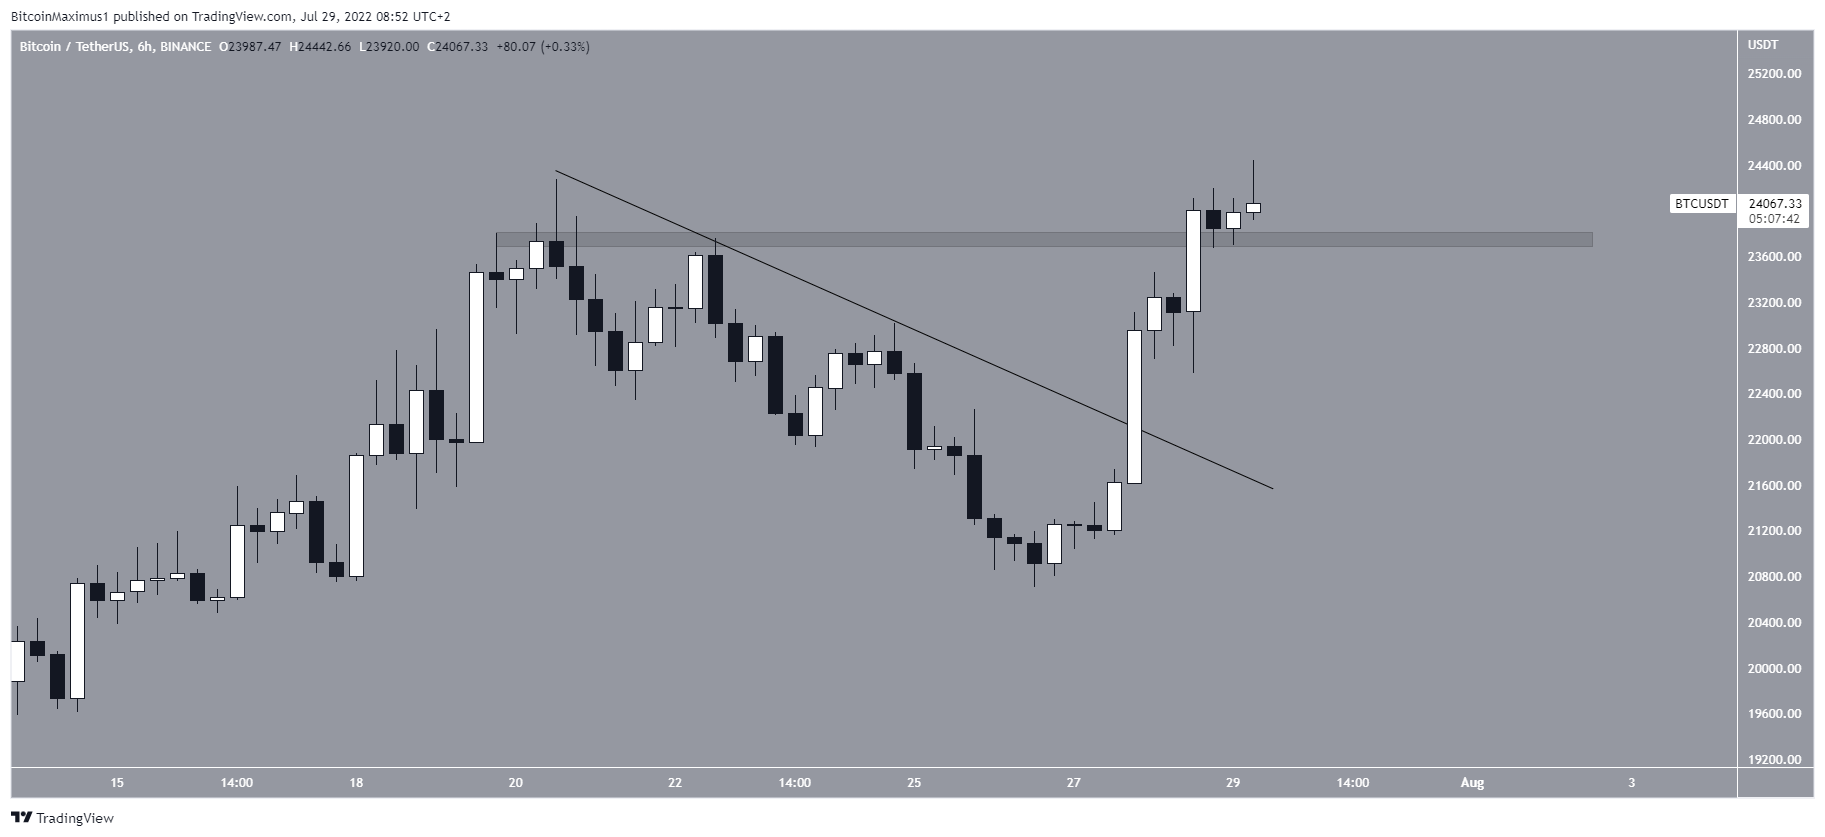
The six-hour chart supports the outlook from the daily time frame, showing that BTC has broken out from a short-term descending resistance line.
Furthermore, it has broken out from the $23,750 area, which previously acted as resistance during the July highs. If it manages to hold on above this level, an increase towards $29,380 would be expected.
BTC wave count analysis
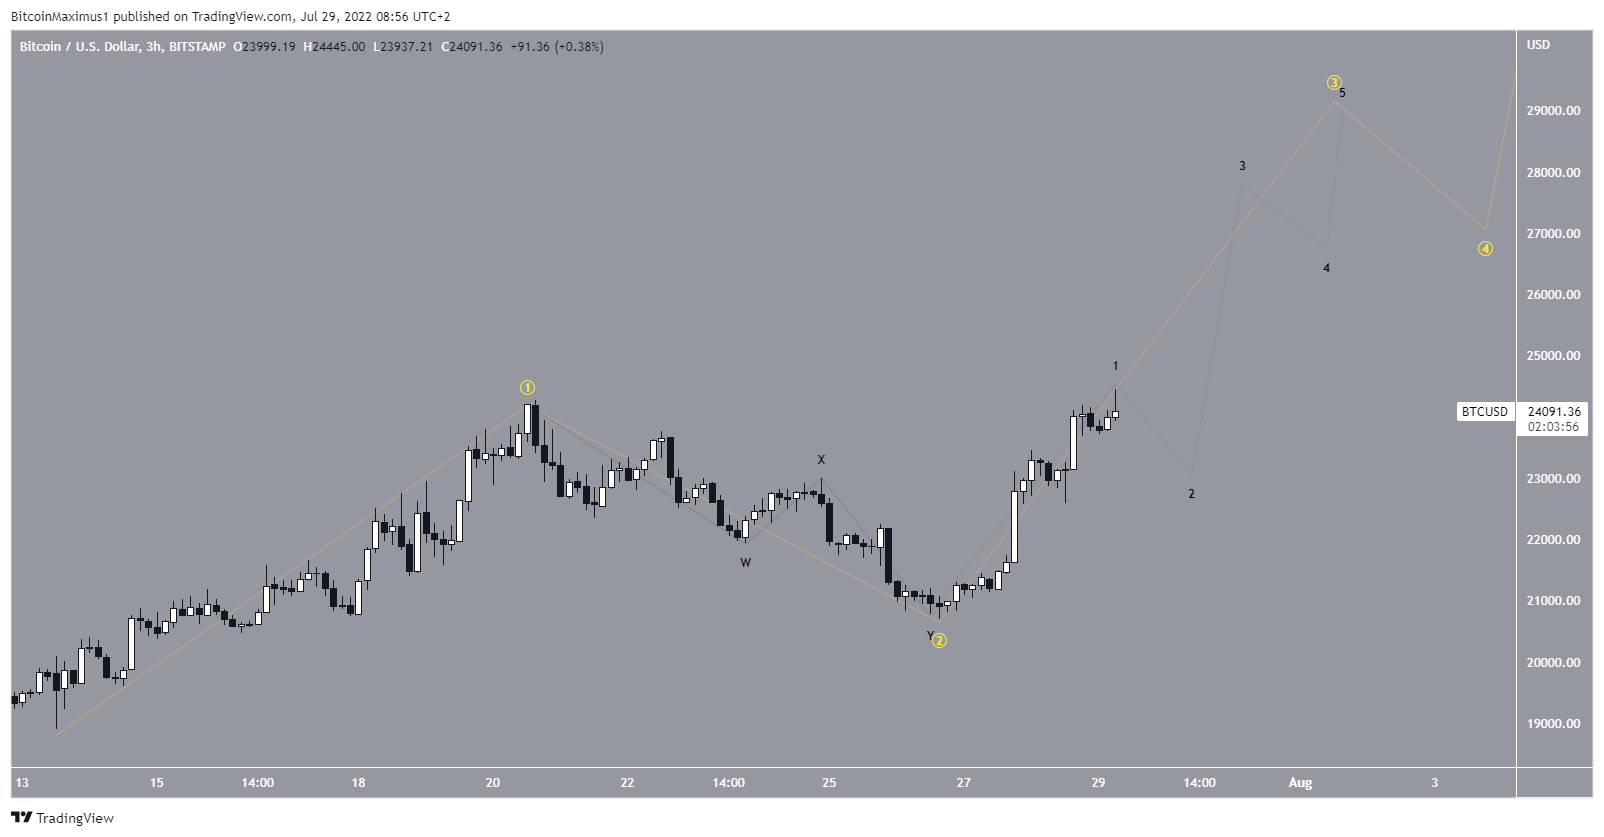
The most likely short-term wave count suggests that BTC has begun wave three of a five-wave upward move (yellow). Wave three is usually the sharpest out of the five, therefore a considerable increase is expected.
The sub-wave count is shown in black and suggests that the price is nearing the top of sub-wave one (black).
For Be[in]Crypto’s previous bitcoin (BTC) analysis, click here


