
A look at Bitcoin (BTC) on-chain data as it relates to miners, more specifically the Mean Block Interval and Mining Difficulty, in order to better understand the effects of the current miner migration.
The migration has caused a considerable increase in the time that it takes for a block interval to be mined. This has been adjusted by a significant increase in mining difficulty.
Mean block interval and Mining difficulty
The mean block interval is the average time (in seconds) that it take for a block to be mined. If a block takes too long to be mined, the difficulty will adjust in the next interval, moving lower so that a block is mined in a more average time.
The mean block interval reached a high of 1,033 seconds (using a seven-day moving average) on July 2. This was the highest value since 2009.
This is a stark difference to the mean interval time since the beginning of 2020, which has oscillated between 500 and 750 seconds.
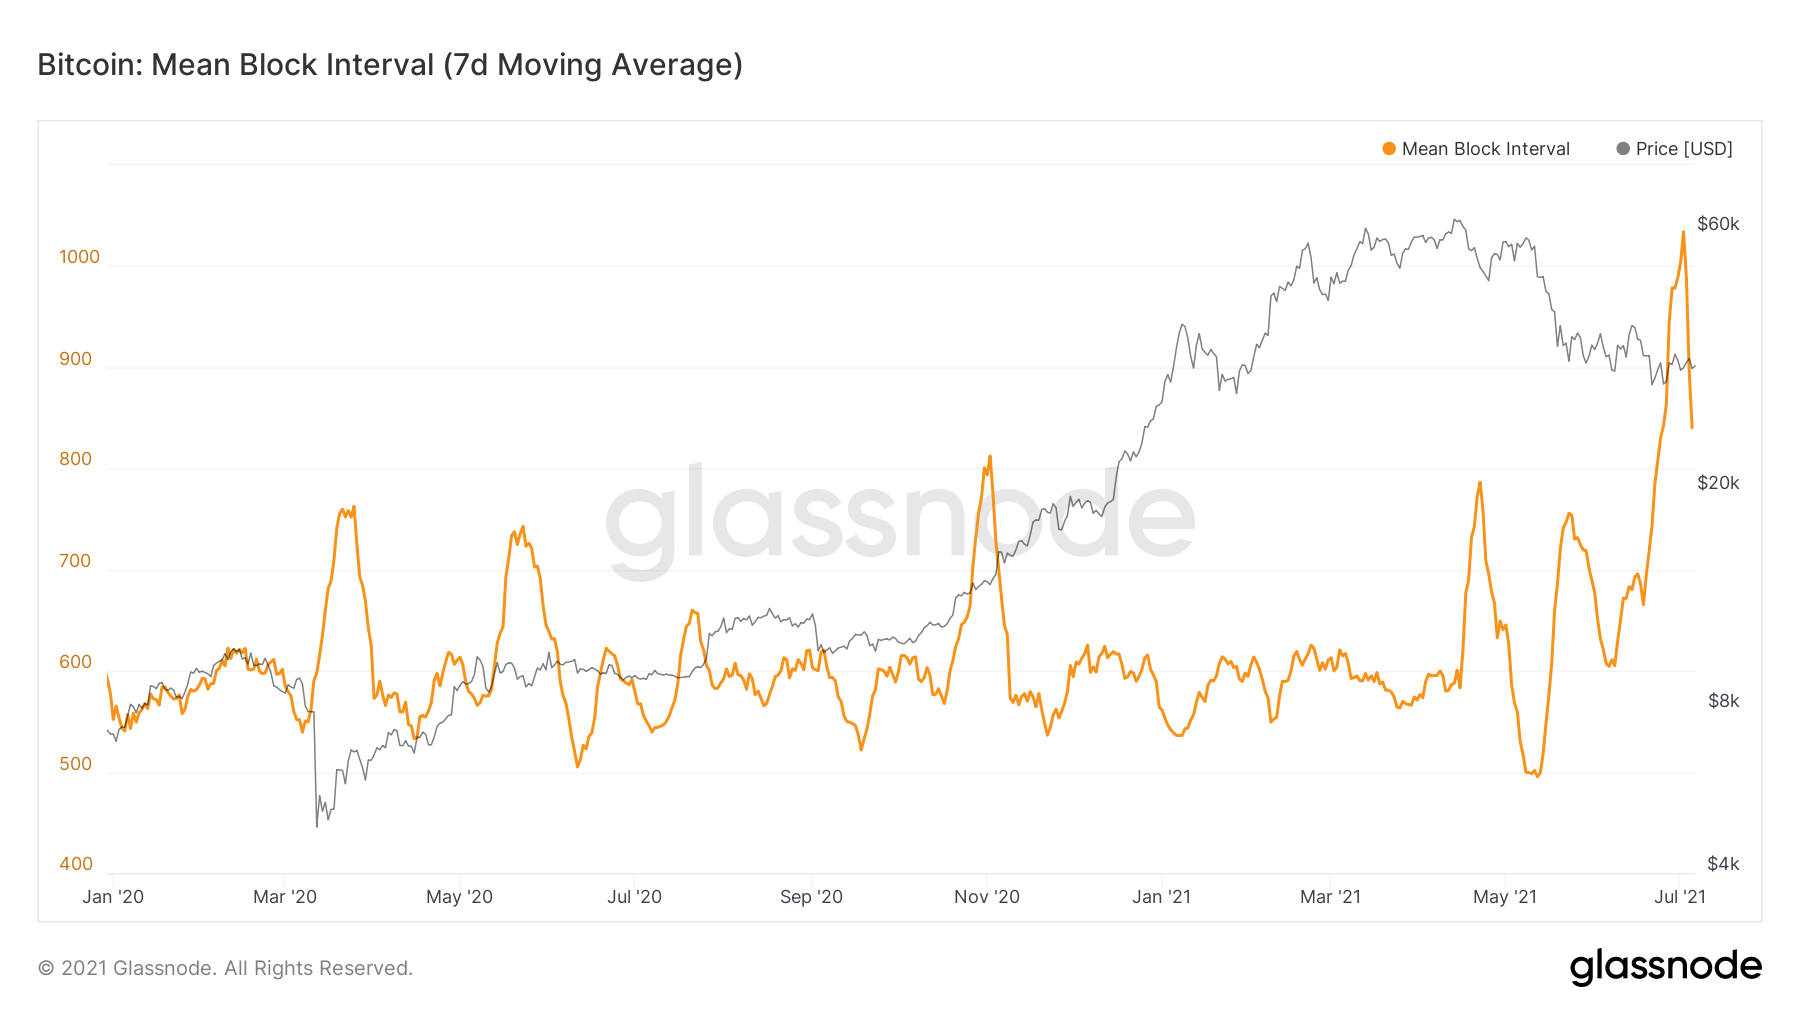
However, the event was temporary and the mean block interval rate has returned towards 800 seconds since.
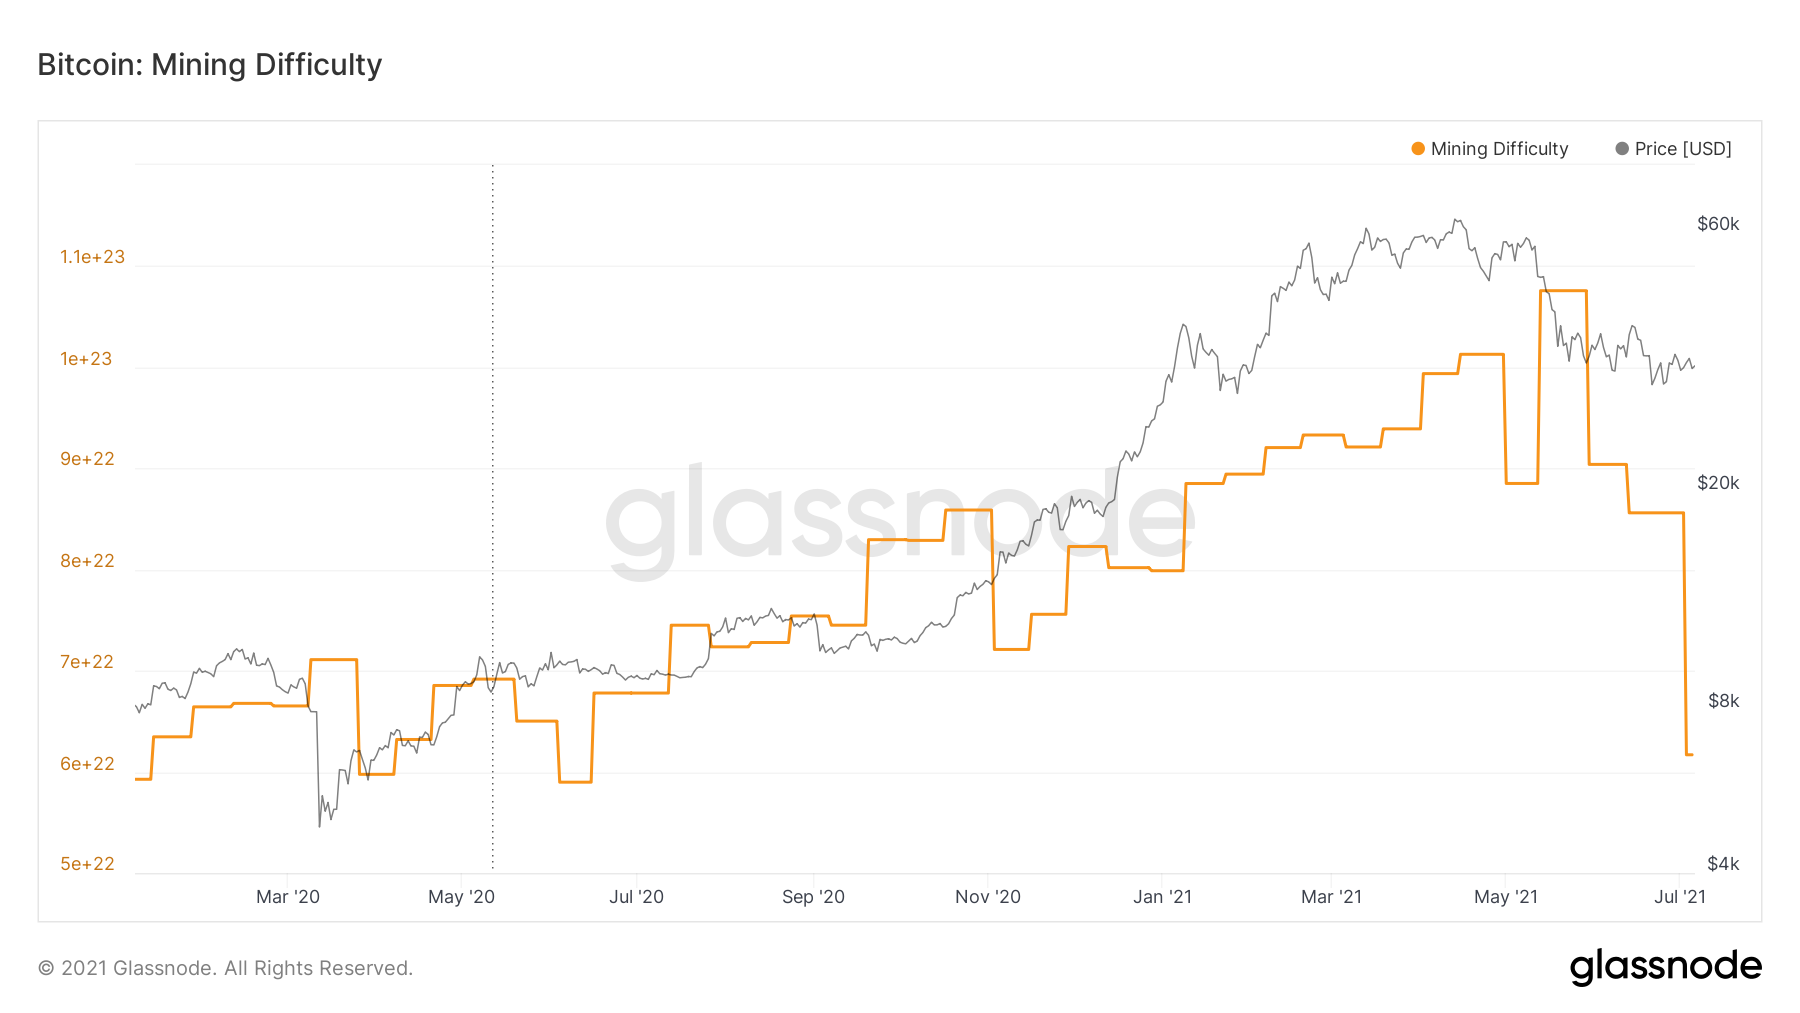
As a result of this increase in the time required to mine a block, the difficulty adjusted shortly afterwards.
It has fallen back to the levels of June 2020, when the BTC price was at around $9,000.
The increase in the time required to mine a block has nearly caused miner capitulation, something that could be remedied by either another decrease in difficulty or an increase in the price of BTC.
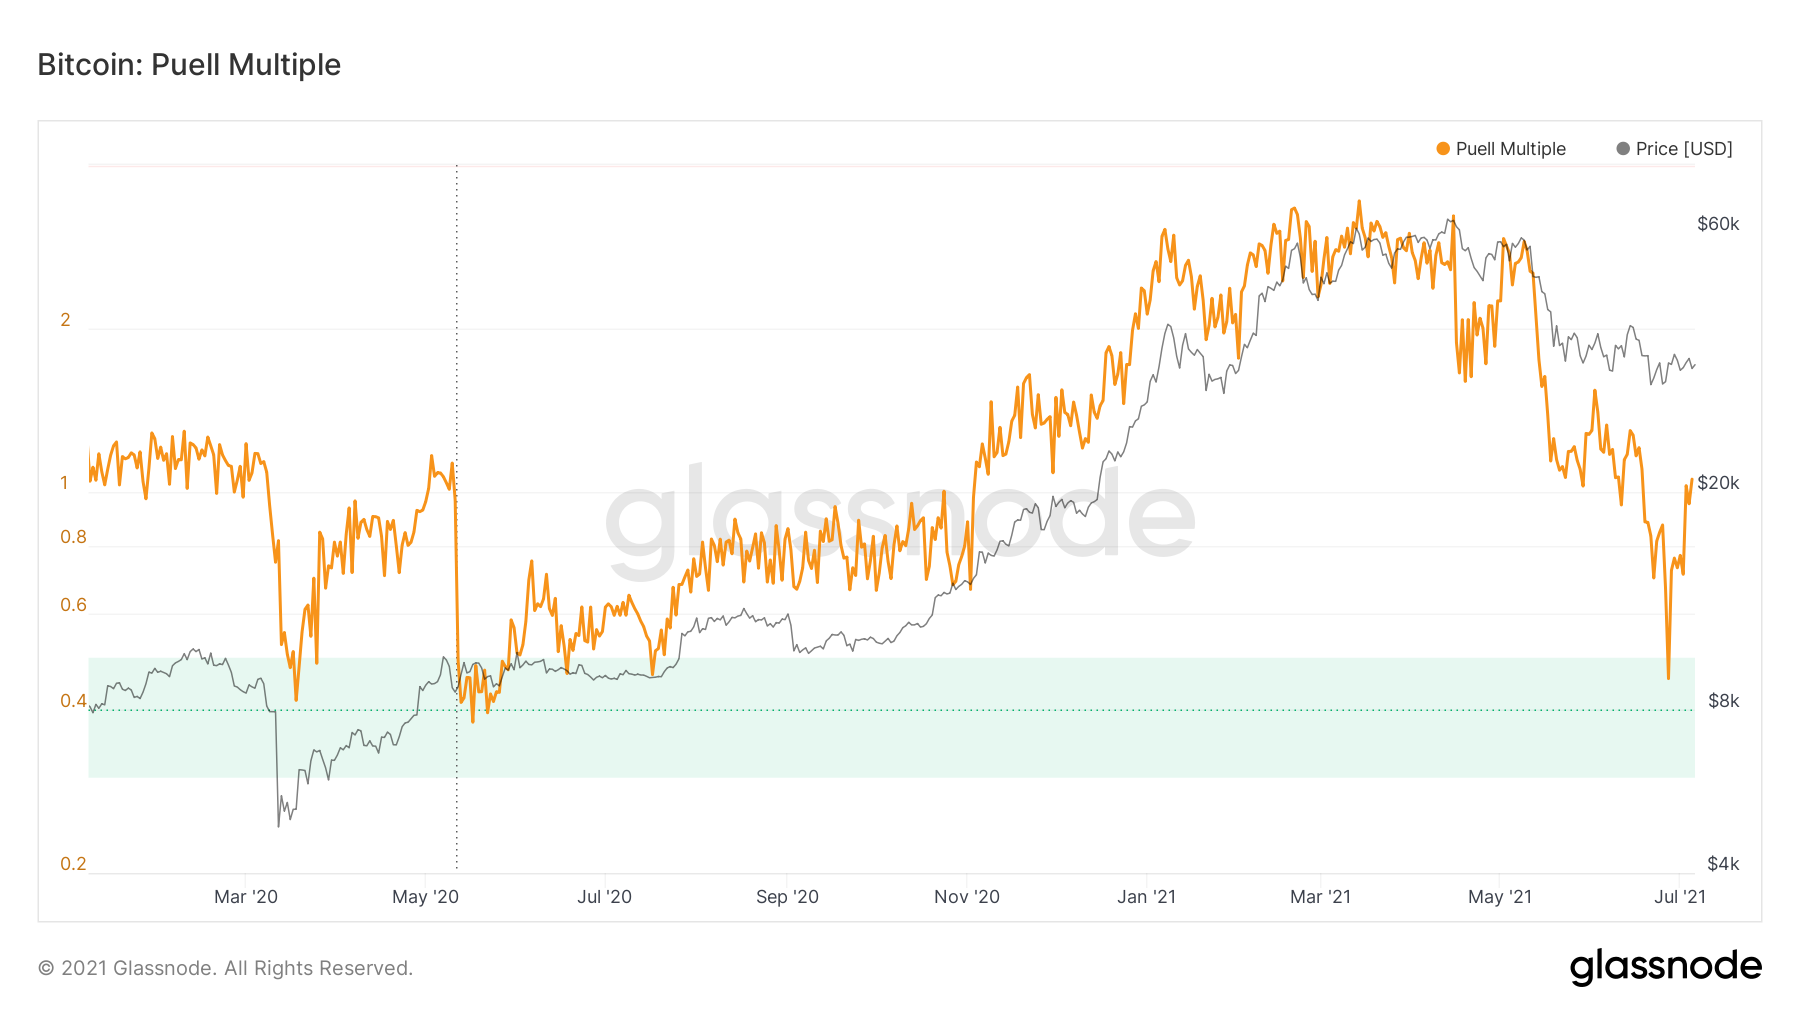
Miner indicators
It reached the undervalued zone once more, doing so on June 27. However, it bounced almost immediately afterwards.
The previous time the Puell multiple reached this zone was in June 2020, prior to the beginning of the current bull-run.
Interestingly, the mining difficulty is also close to its June 2020 level.
In addition to this, BTC long-term holders are continuously adding to their positions, a sign of confidence in the market.
For BeInCrypto’s latest bitcoin (BTC) analysis, click here.
