


Bitcoin (BTC) is trading inside a range between $31,300 and $40,550.
Ethereum (ETH) has completed a leading diagonal.
XRP (XRP), DIA (DIA), and Horizen (ZEN) have broken out from descending resistance lines.
TomoChain (TOMO) has reclaimed the $1.96 horizontal area.
Hedera Hashgraph (HBAR) is trading inside a descending channel.
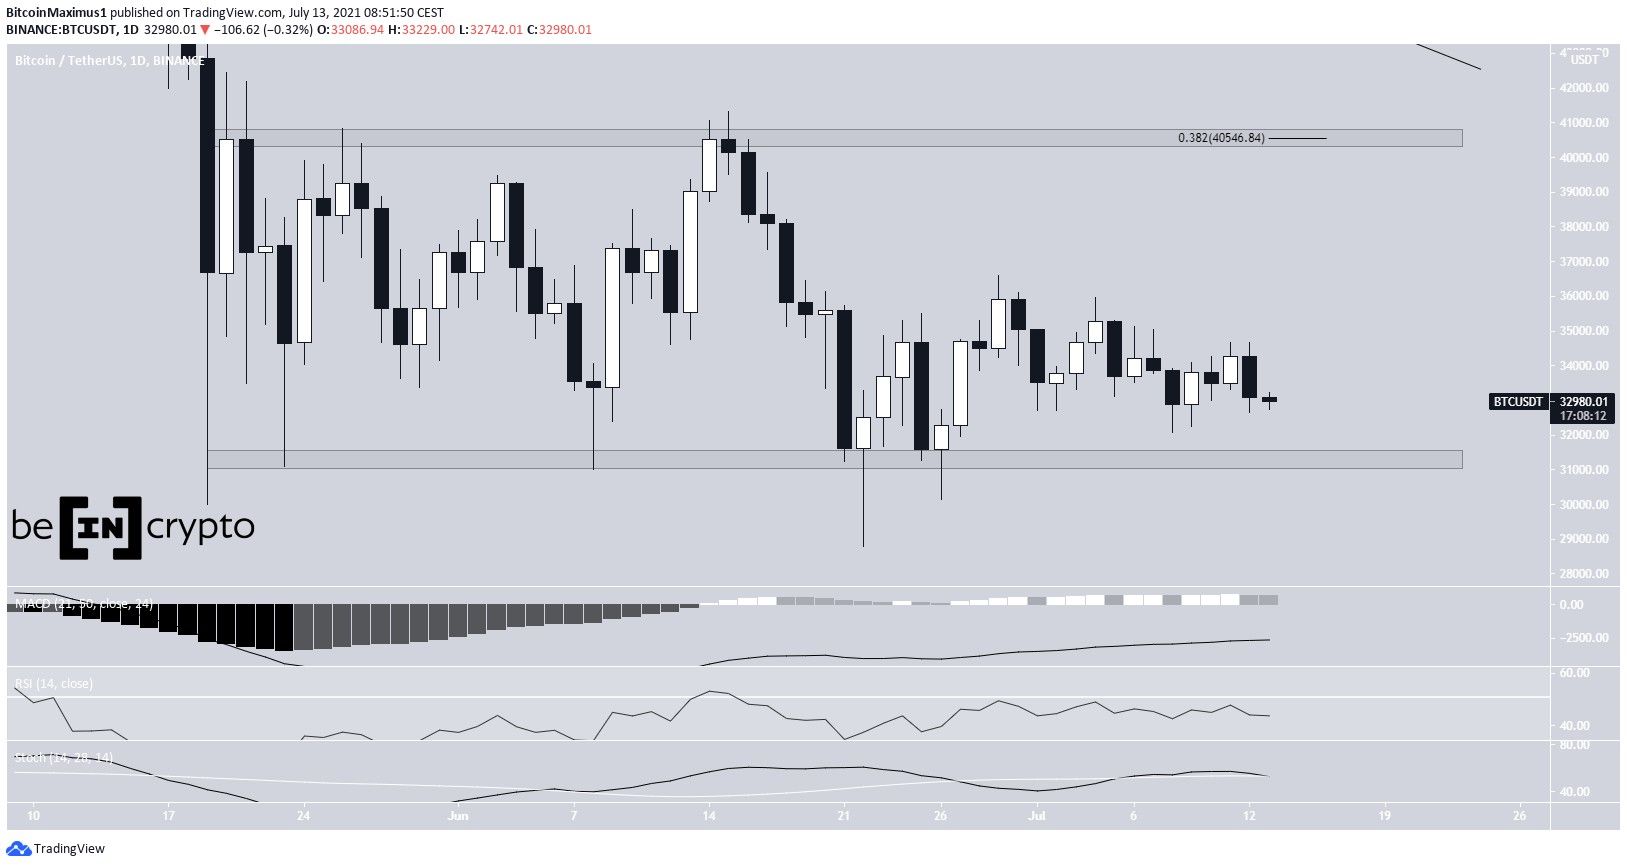
Bitcoin (BTC)
Since May 19, BTC has been consolidating inside a range of $31,300 and $40,550. On July 12, it fell to a low of $32,658 after creating a bearish candlestick, but has bounced since.
Despite the bounce, technical indicators in the daily time-frame are leaning bearish. The RSI is still below 50 and the MACD has created one lower momentum bar. In addition to this, the Stochastic oscillator has made a bearish cross.
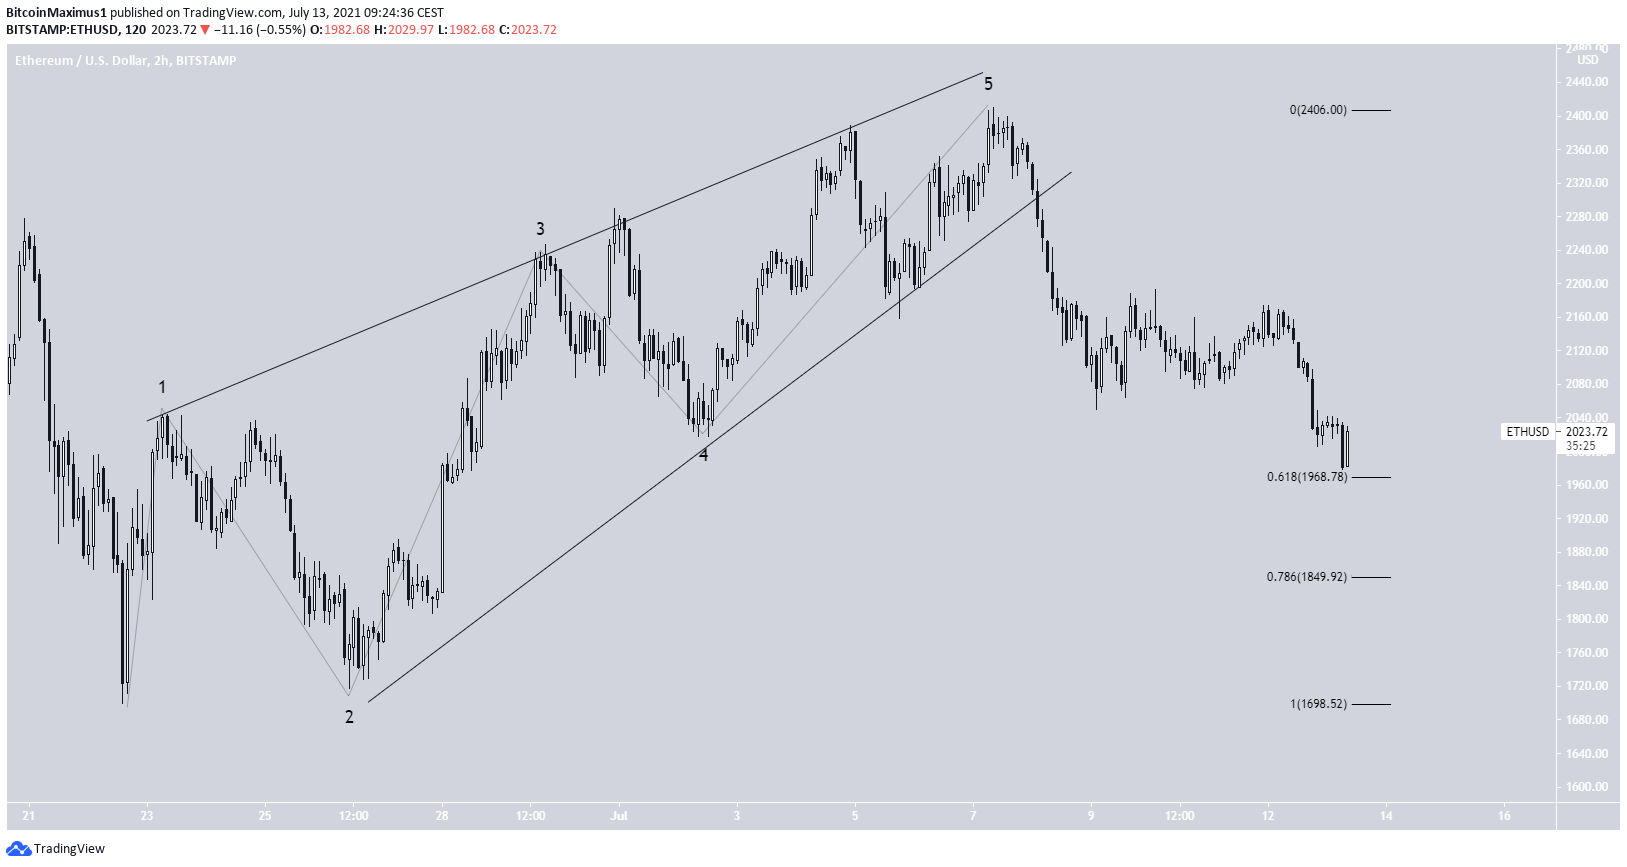
Ethereum (ETH)
ETH has been moving upwards since reaching a low of $1,700 on June 22. So far, it has reached a high of $2,410 before falling.
The decrease caused a breakdown from an ascending wedge. Currently, ETH is trading just above the 0.618 Fib retracement support level at $1,968.
It’s possible that the wedge was part of a leading diagonal pattern. If so, ETH would be expected to increase towards the $2,880 horizontal resistance area.
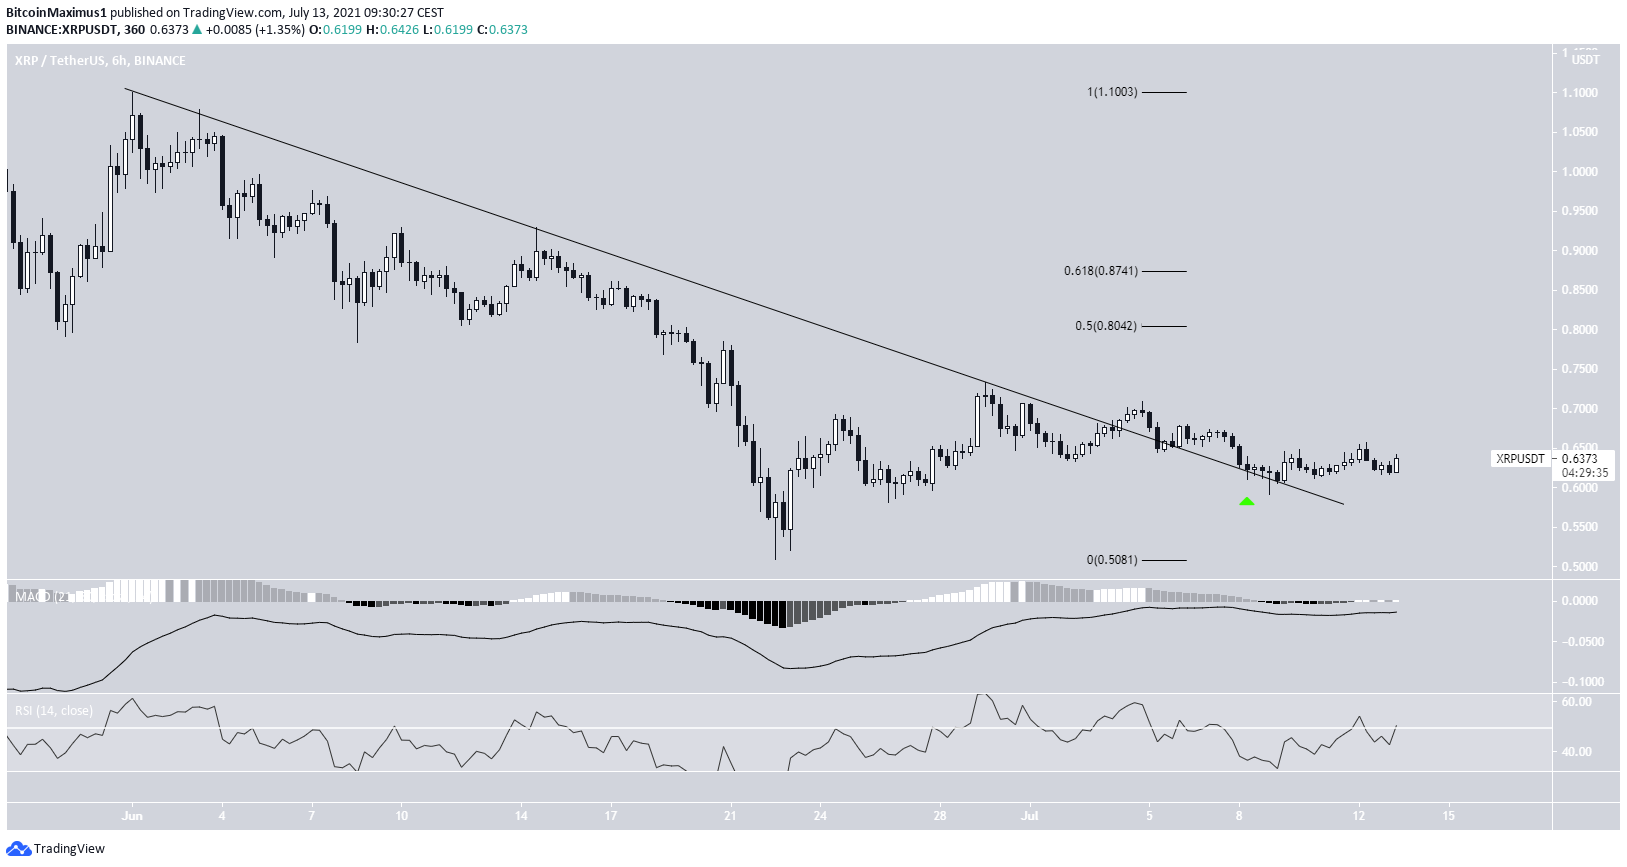
XRP (XRP)
XRP had been following a descending resistance line since June 1. It made four unsuccessful attempts at moving above the line before finally managing to break out on July 4.
After two days, it returned and validated the line as support (green icon).
If it begins an upward move, the closest resistances would be found at $0.80-$0.87. These targets are the 0.5-0.618 Fib retracement resistance levels.
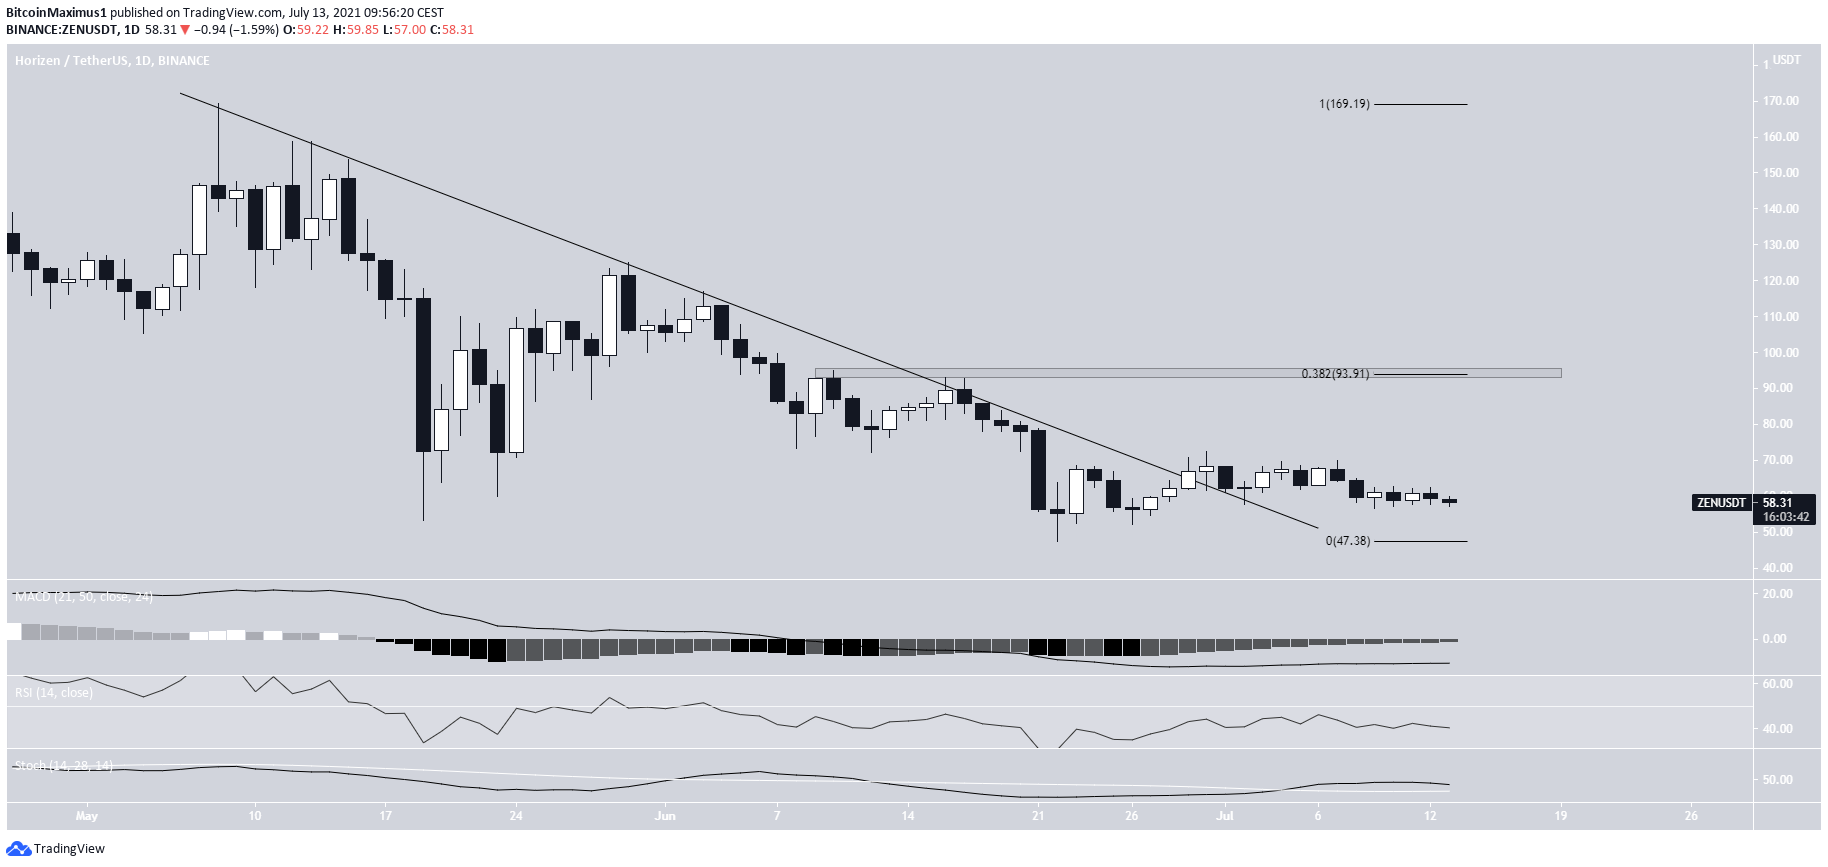
Horizen (ZEN)
ZEN had been following a descending resistance line since May 8 after reaching a high of $169.23. It made five unsuccessful attempts at moving above the line before finally breaking out on June 30.
However, it has yet to initiate any significant upward movement. In addition to this, technical indicators are relatively neutral.
The closest resistancea is found at $93.91. This is the 0.382 Fib retracement resistance level.
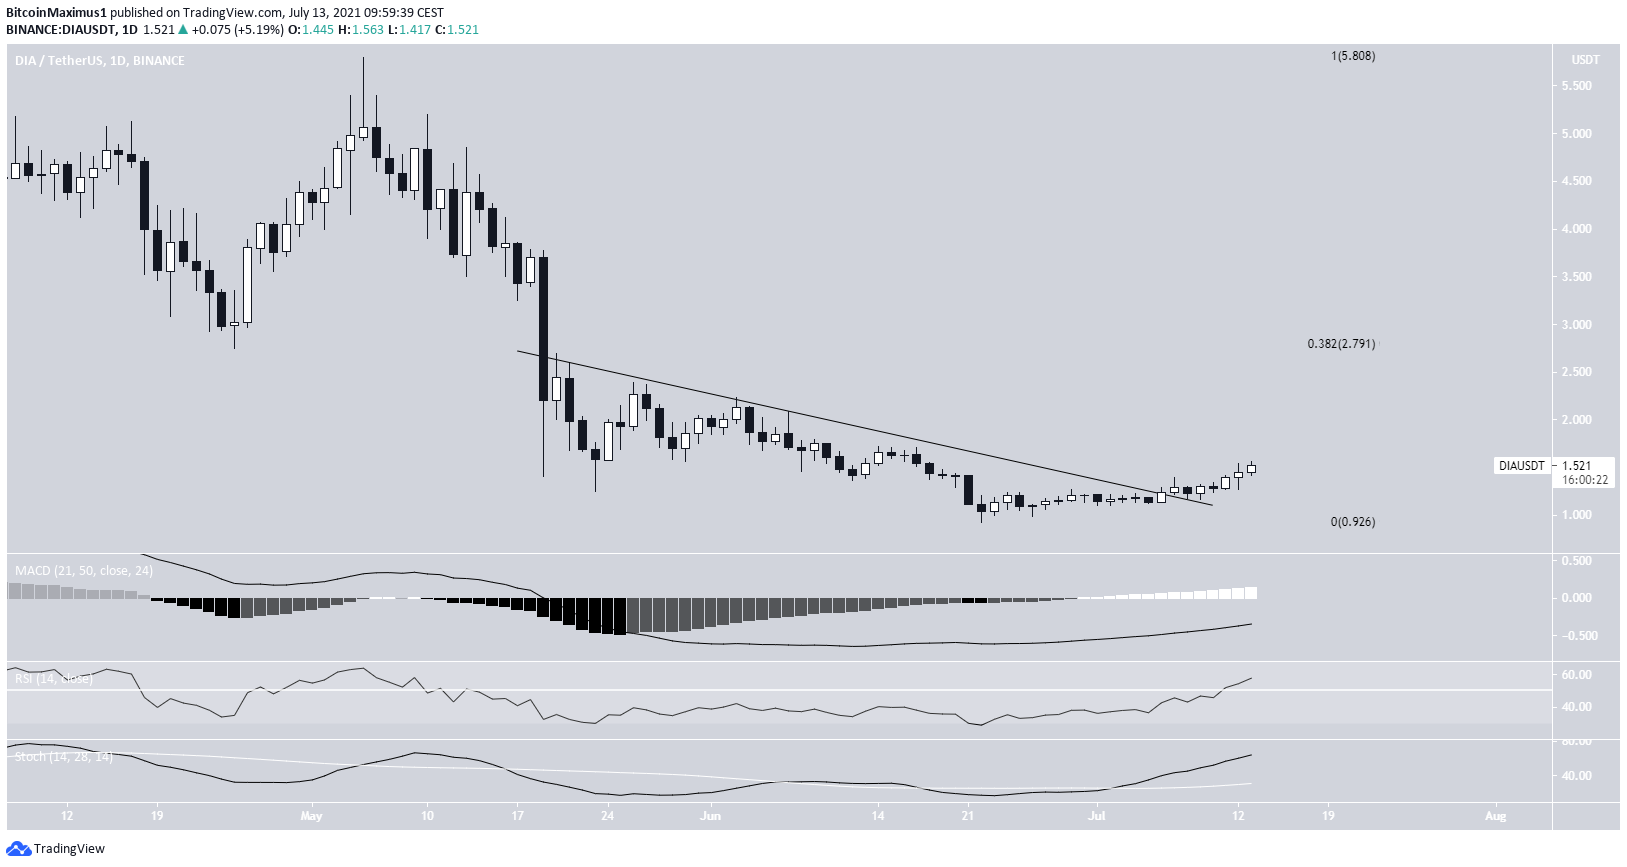
DIA (DIA)
DIA had been following a descending resistance since May 20. While following it, it dropped all the way to a low of $0.921 on June 22 but has been moving upwards since.
On July 6, it broke out from a descending resistance line. So far, it has reached a high of $1.57 on July 13.
Technical indicators in the daily time-frame are bullish. The RSI is above 50 and moving upwards and the Stochastic oscillator has made a bullish cross. In addition, the MACD is nearly positive.
The closest resistance is found at $2.79.
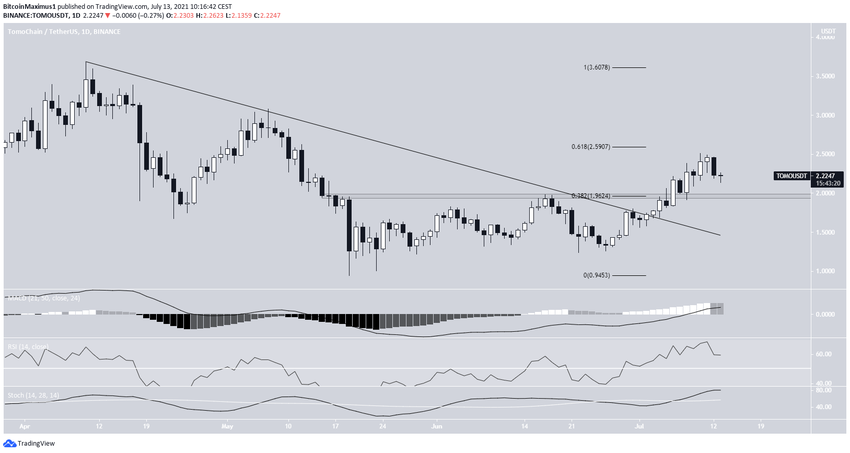
TOMO
TOMO has been moving upwards since May 19. On July 2, it broke out from a descending resistance line that had been in place since April 10.
Shortly after, it reclaimed the $1.96 area, which is now likely to act as support.
TOMO proceeded to reach a high of $2.51 before dropping. The high was made very close to the 0.618 Fib retracement resistance level.
Technical indicators are bullish. The MACD is positive, the RSI is above 50, and the Stochastic oscillator has made a bullish cross.
As long as TOMO is trading above the $1.96 horizontal area, the trend remains bullish.
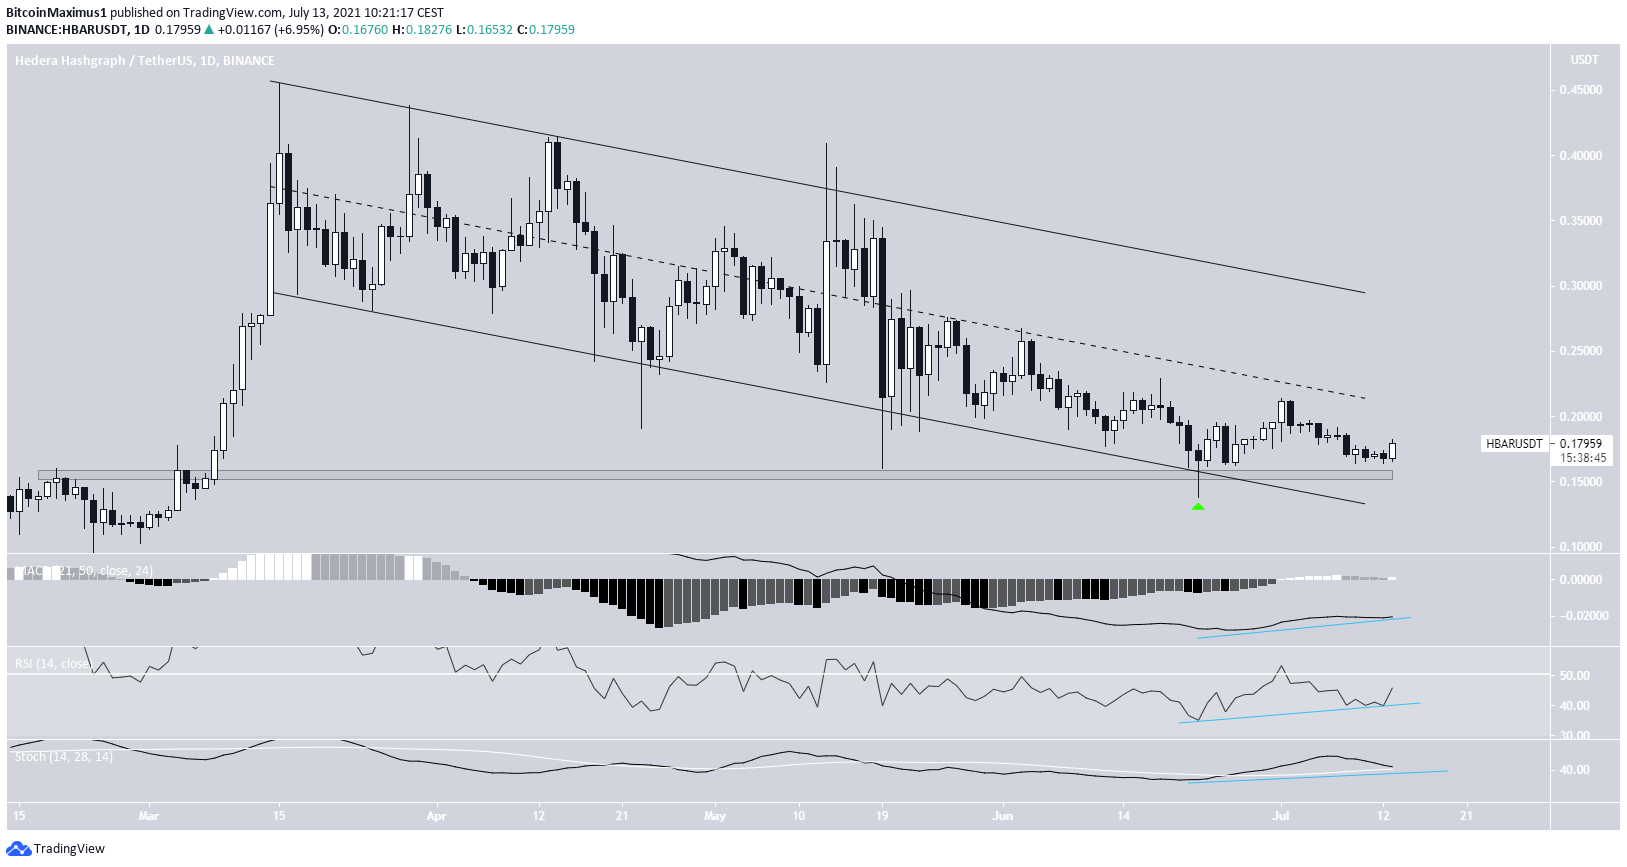
HBAR
HBAR has been decreasing inside a descending parallel channel since March 15. It proceeded to reach a low of $0.138 on June 22 but bounced almost immediately after, leaving a long lower wick in place.
In addition, the low validated the $0.155 area as support.
There are several bullish divergences in place.
Therefore, HBAR is expected to reclaim the midline of the channel and potentially move towards its resistance line.
For BeInCrypto’s latest bitcoin (BTC) analysis, click here.


