


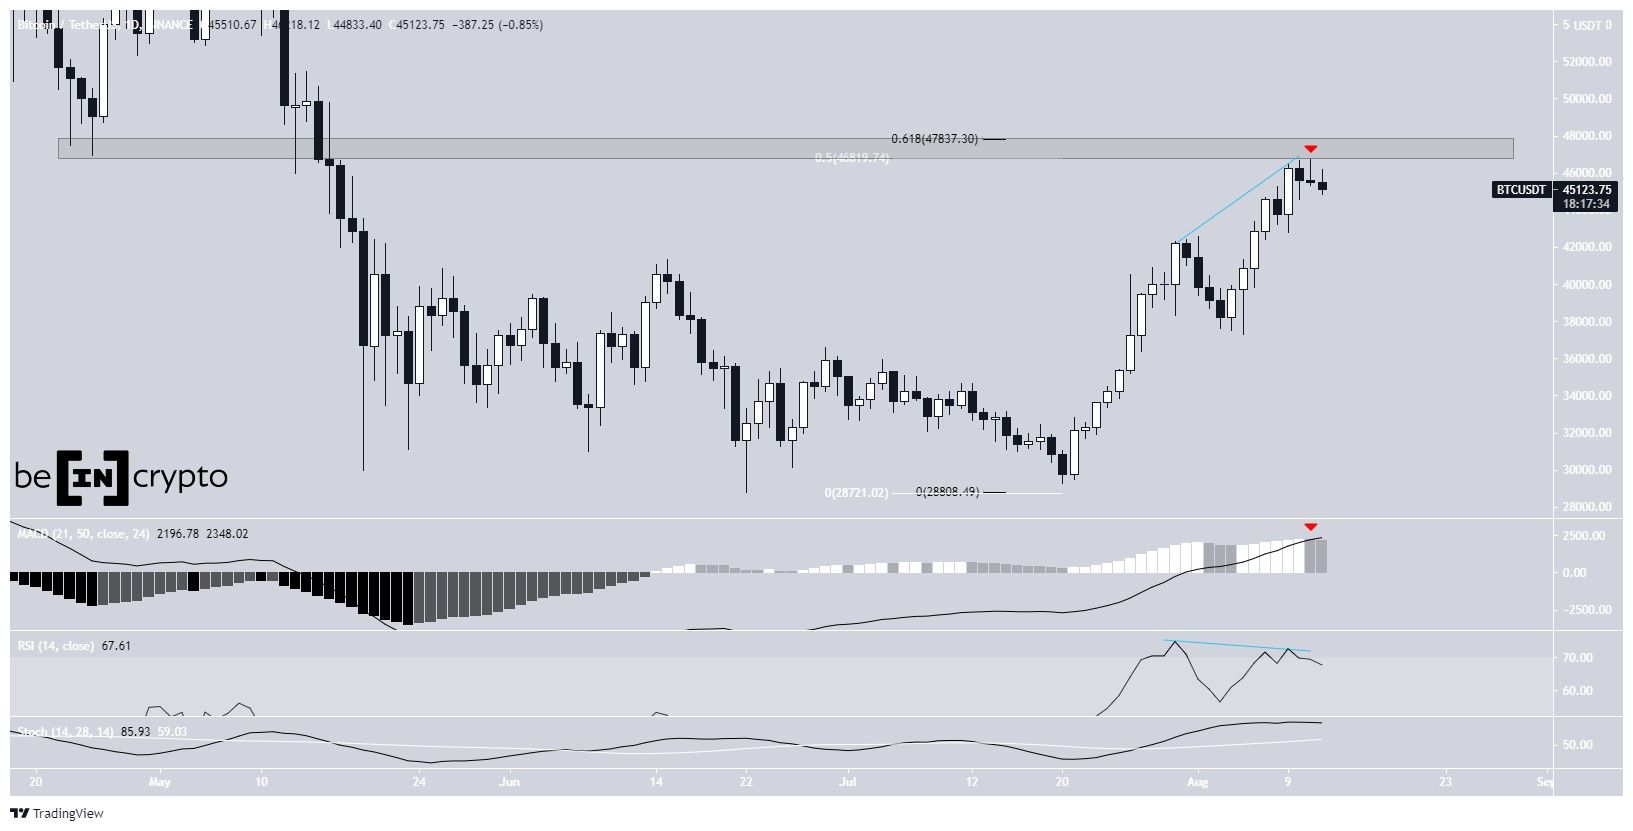
Bitcoin (BTC) was rejected by the $47,800-$48,800 resistance area.
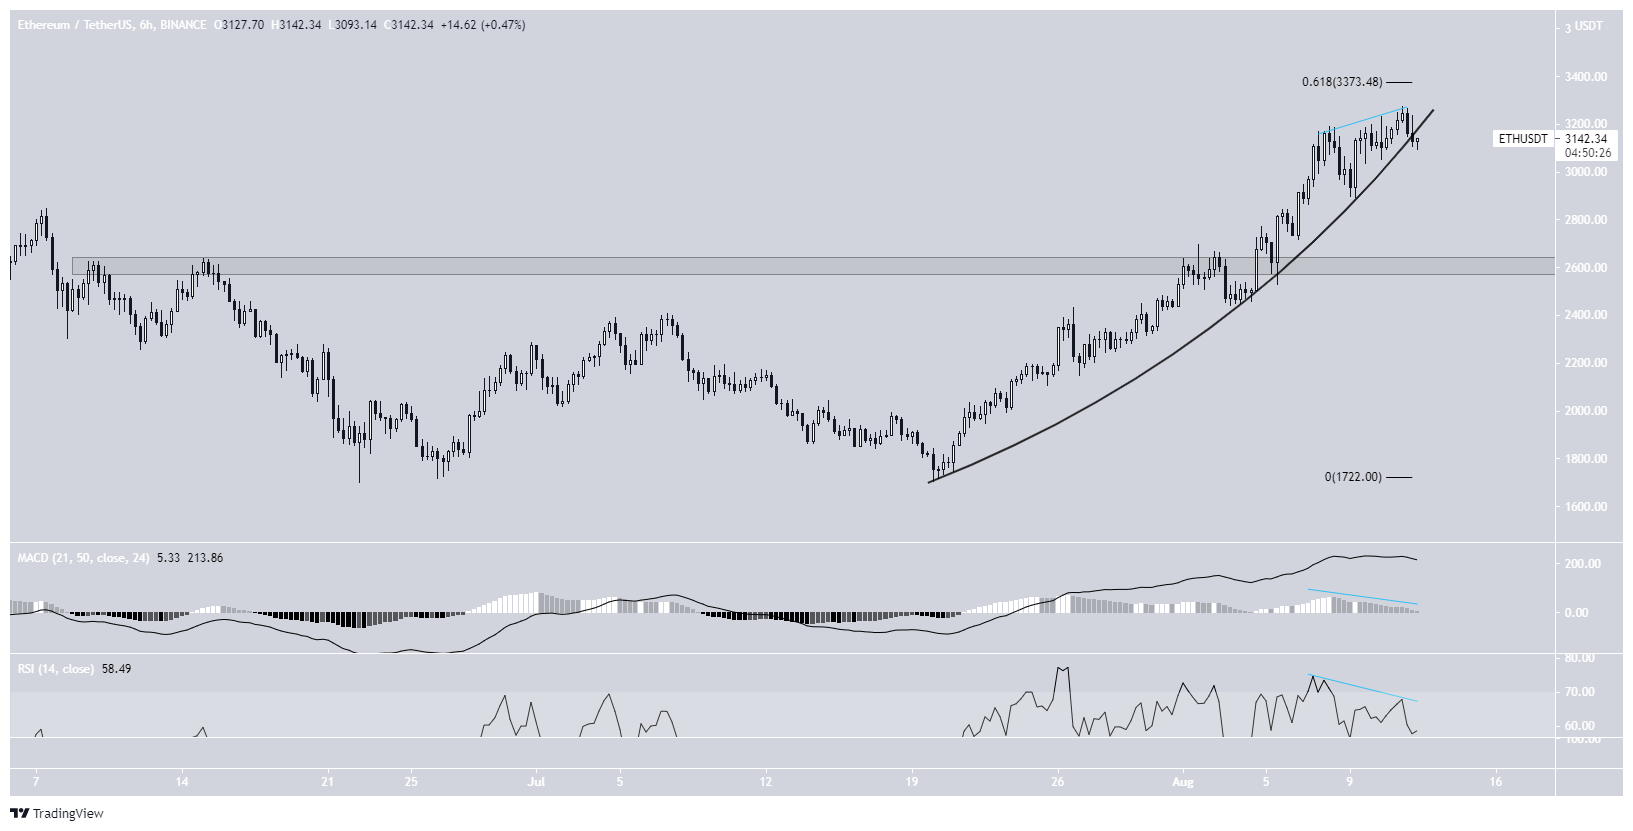
Ethereum (ETH) could be in the process of breaking down from a parabolic ascending support line.
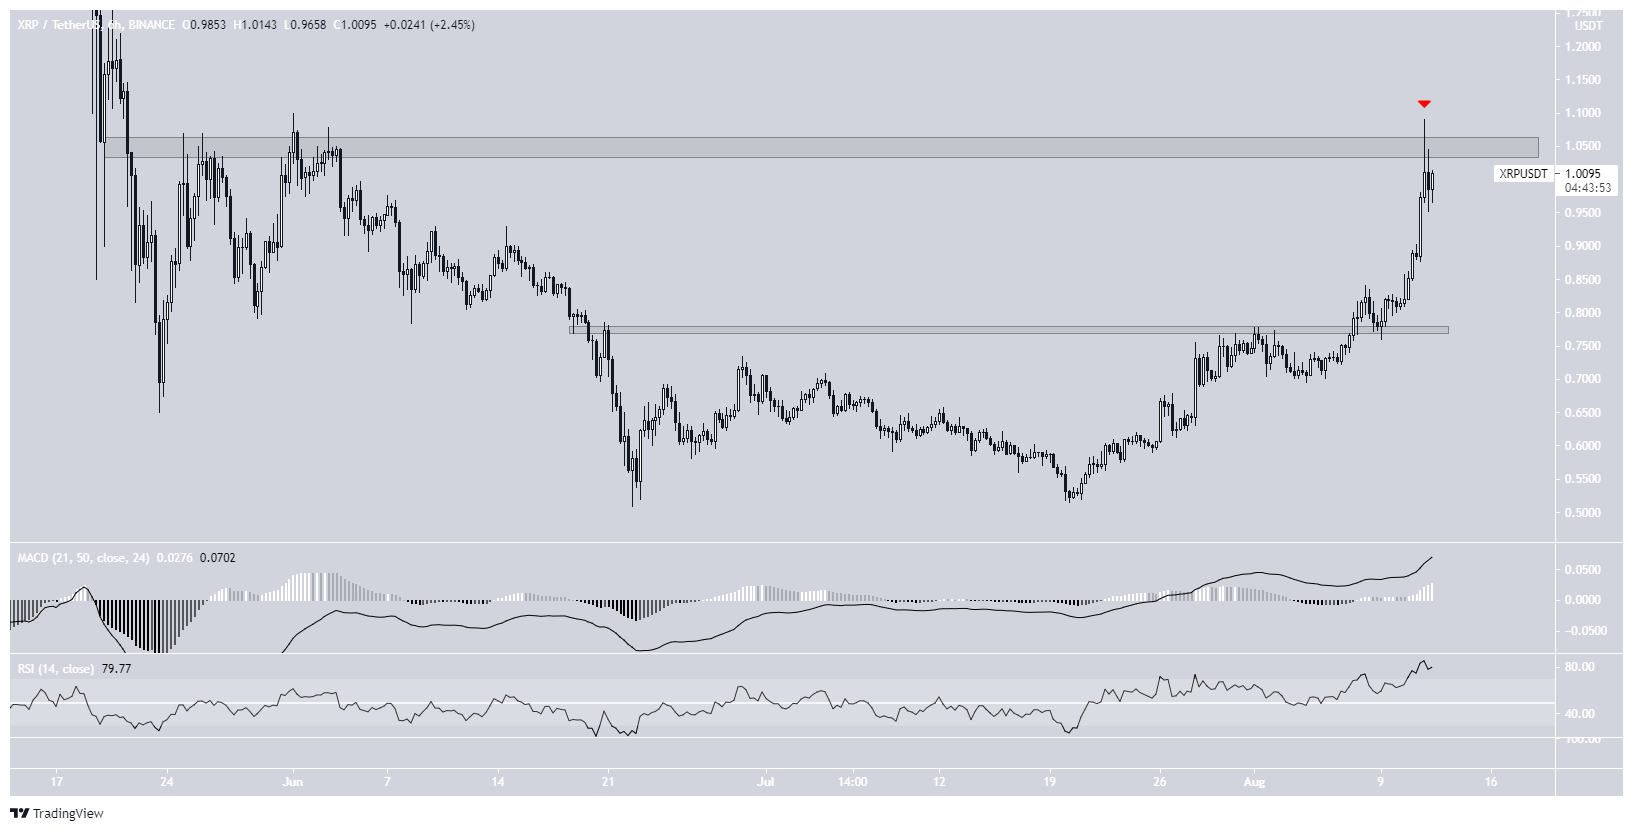
XRP (XRP) has reached the $1.05 resistance area.
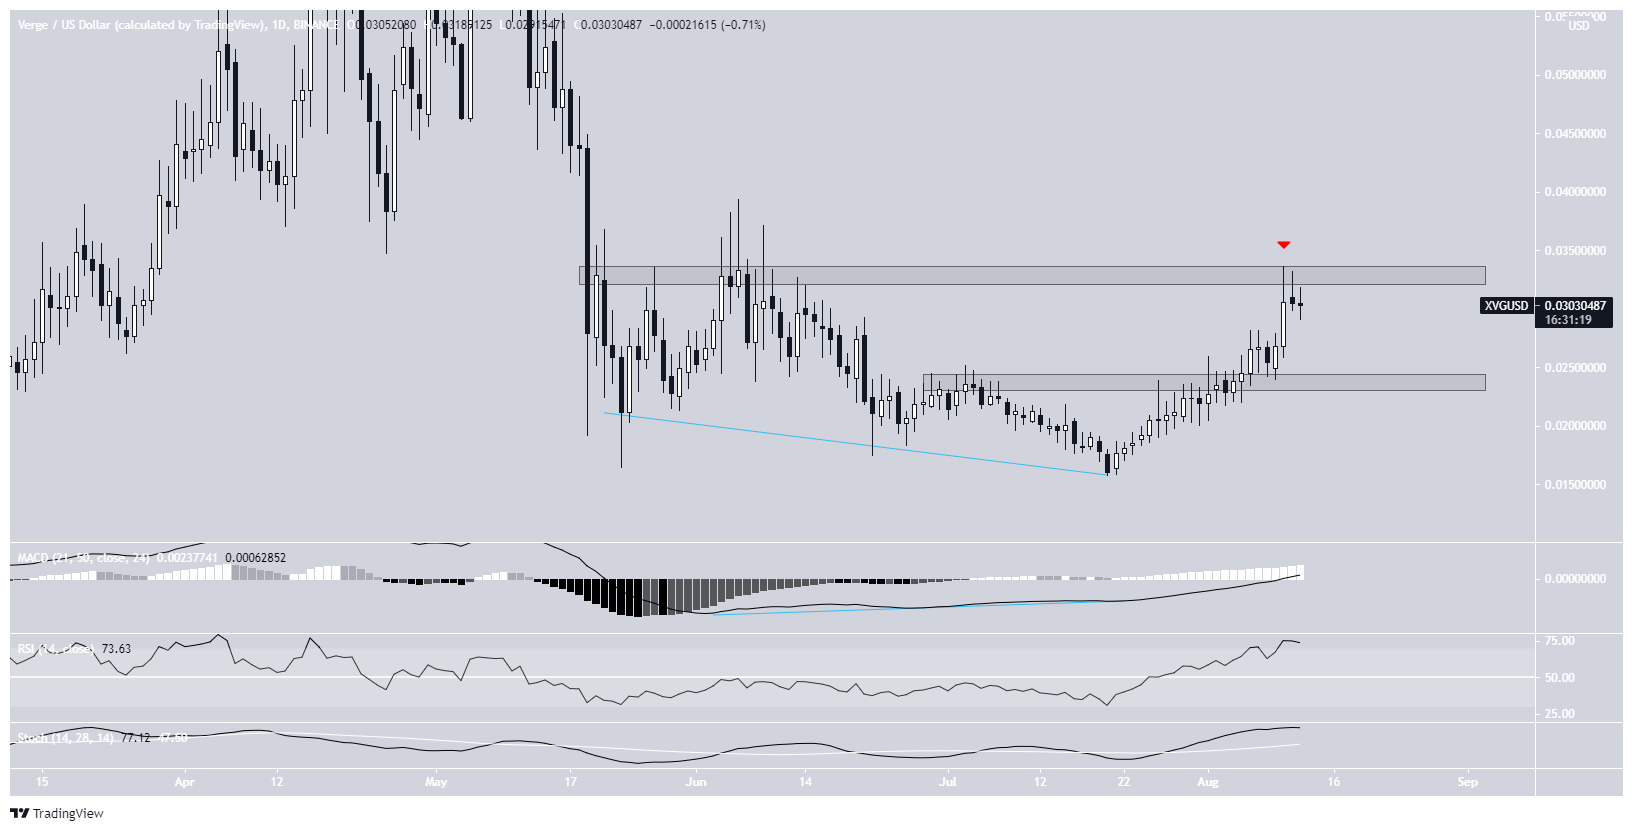
Verge (XVG) has successfully completed a double bottom pattern.
Near Protocol (NEAR) is trading inside a range between $2.50 and $3.63.
TRON (TRX) and Yearn.Finance (YFI) have broken out from descending resistance lines.
BTC
BTC has been increasing since July 20 and created a higher low on Aug 5. On Aug 11, it managed to reach a high of $46,743 before creating a shooting star pattern and decreasing.
The decrease was preceded by a bearish divergence in the RSI, and the MACD has already created a lower momentum bar.
Furthermore, the high was made at a confluence of Fib resistance levels between $46,800 and $47,800.
It’s possible that a local top has been reached and BTC could decrease towards the $39,900-$37,770 range.
ETH
ETH has been moving upwards at an accelerated rate since July 20. On Aug 5, it reclaimed the $2,600 horizontal support area.
So far, ETH has reached a local high of $3,274 on Aug 11.
However, the high was combined with bearish divergences in both the RSI and MACD. Since then, ETH has been decreasing and is in the process of breaking down from a parabolic ascending support line.
If it does, it would likely return to the $2,600 horizontal level once again.
XRP
On Aug 7, XRP broke out from the $0.77 horizontal resistance area and validated it as support after.
So far, it has managed to reach a local high of $1.09 on Aug 11. However, it was rejected by the $1.05 horizontal resistance area and created a long upper wick (red icon).
A breakout above this resistance area could trigger a sharp upward move.
So far, technical indicators are not showing any form of weakness.
XVG
On May 23 and July 20, XVG successfully completed a double bottom pattern near $0.015. The pattern was combined with a bullish divergence in the MACD.
Since then, it has been moving upwards and managed to reach a local high of $0.033 on Aug 10. However, it failed to break out and created a long upper wick instead. This validated the $0.033 area as resistance. A breakout above this level could be the trigger a sharp increase.
If a downward move occurs, the main support area would be found at $0.0235.
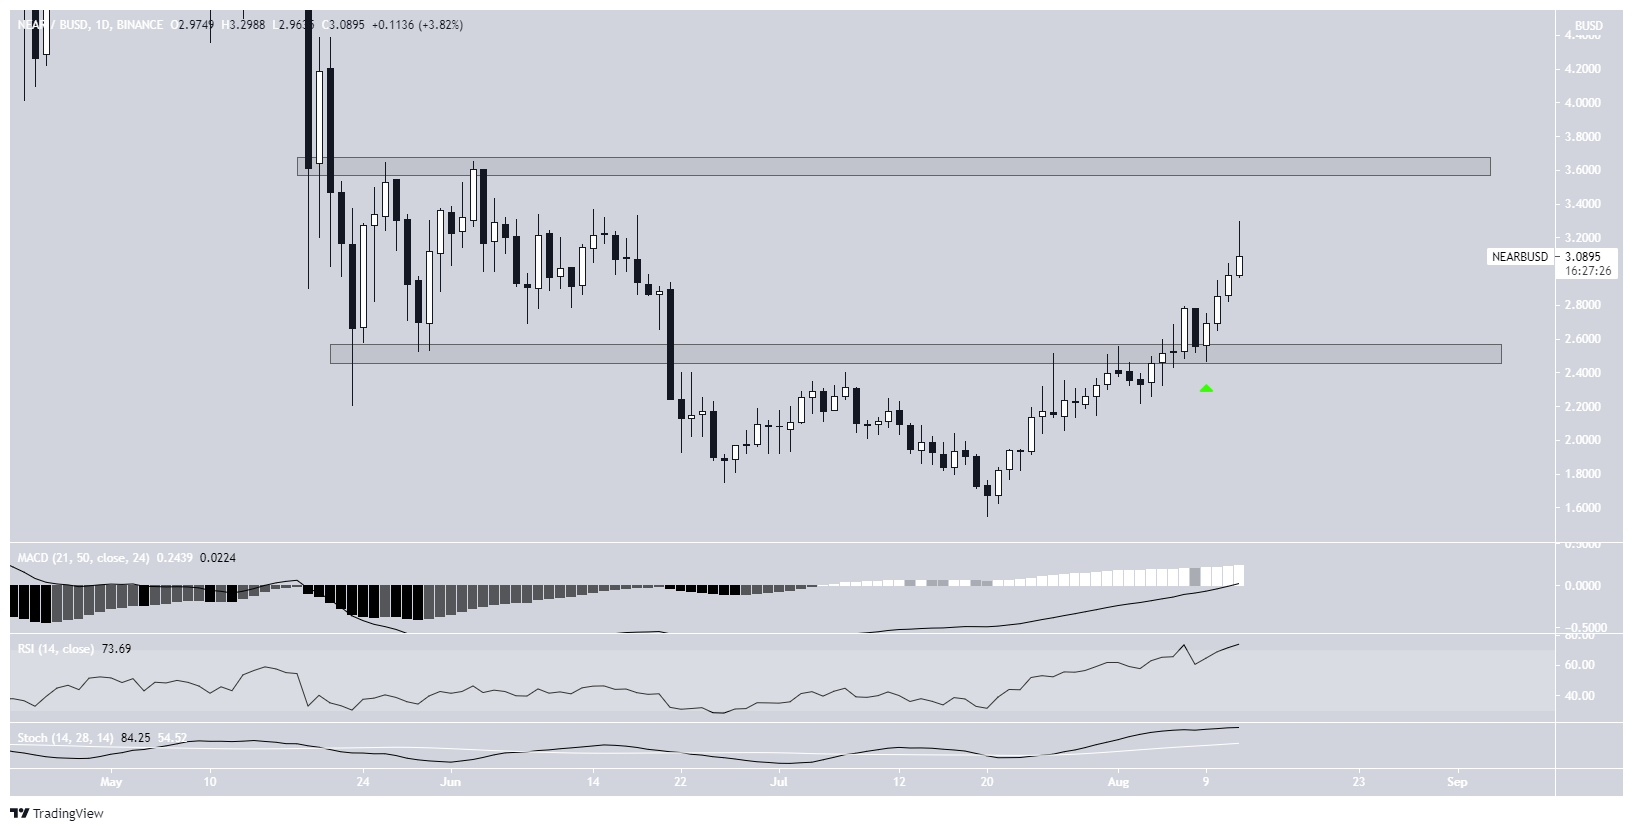
NEAR
NEAR has been moving upwards since July 20. On Aug 5, it reclaimed the $2.50 horizontal resistance area and validated it as support after (green icon). The main resistance area is found at $3.65.
Technical indicators are bullish and support the continuation of the upward move.
As long as it’s trading above the $2.50 area, NEAR is likely to make an attempt at moving past the $3.65 resistance.
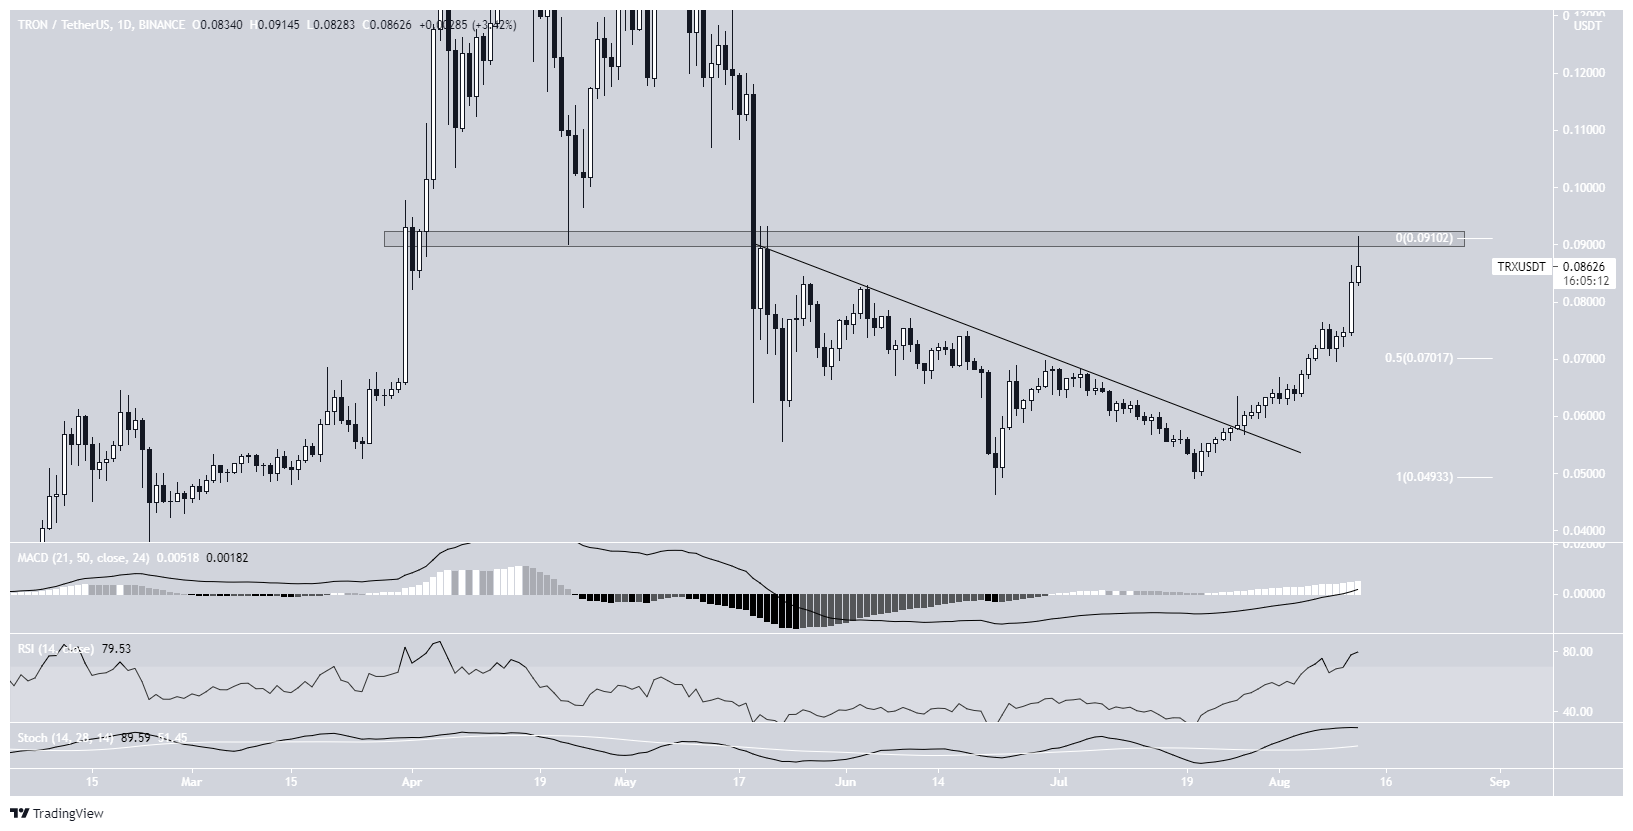
TRX
TRX has been increasing since July 20. On July 27, it broke out from a descending resistance line and accelerated.
The upward move is supported by the MACD and RSI, which are both increasing. The former has just crossed into positive territory while the latter has crossed above 70.
However, TRX failed to move above the crucial $0.91 resistance area and was rejected instead. Furthermore, the rally has become parabolic.
Because of this, some retracement would be likely. If this occurs, the closest support area would be found at $0.07.
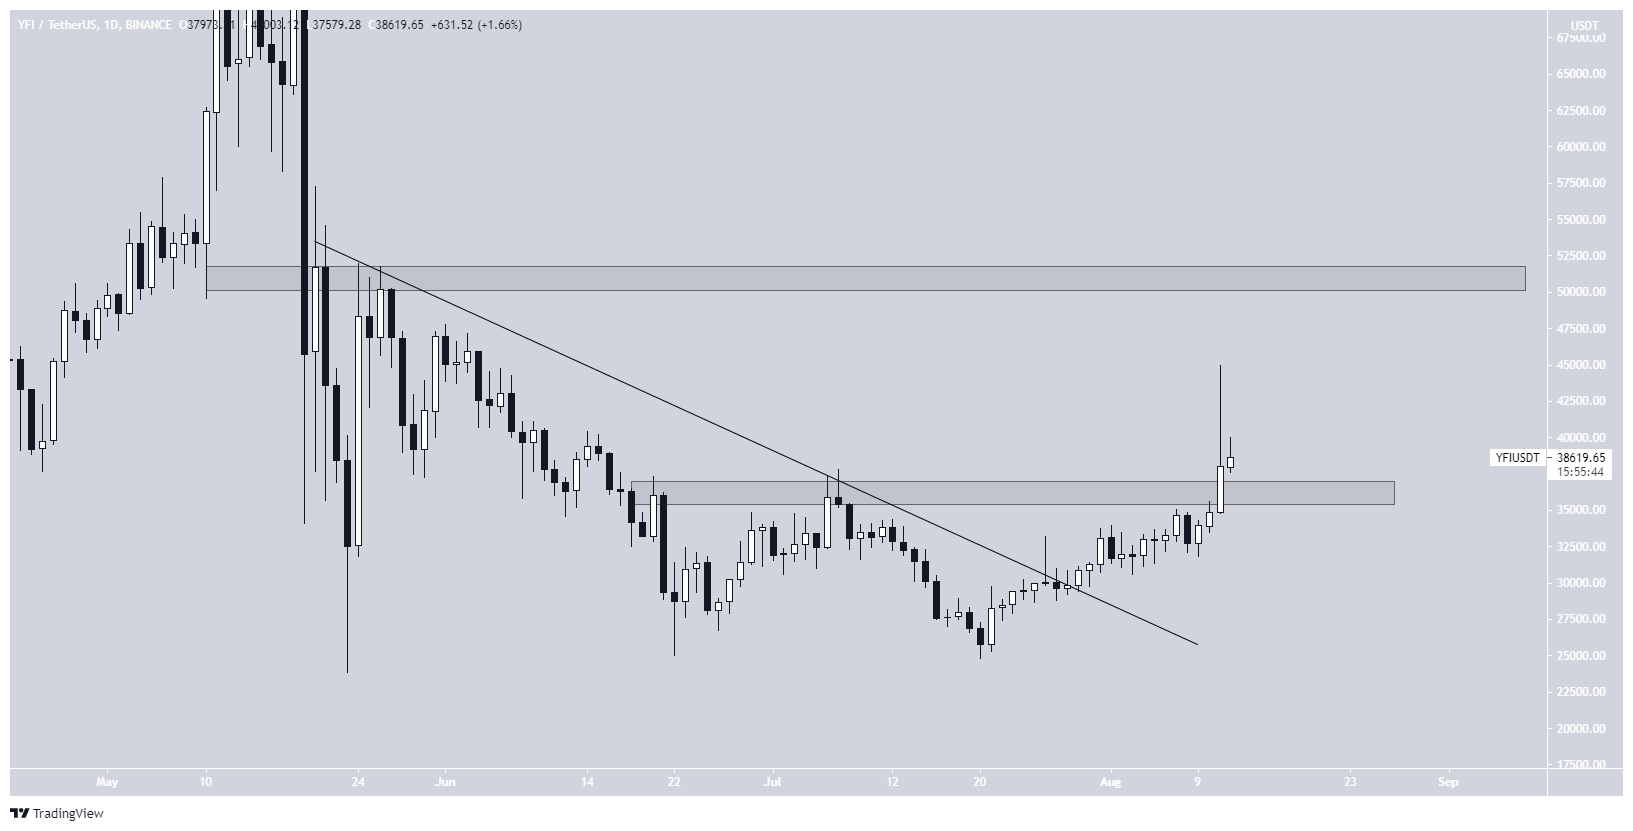
YFI
YFI has been moving upwards since July 20. On July 28, it managed to break out above a descending resistance line.
On Aug 12, it reclaimed the $38,000 resistance area and proceeded to reach a high of $45,000 the same day.
However, this created a long upper wick and YFI fell once more.
Despite the drop, the trend can be considered bullish as long as it’s trading above the $38,000 area.
The next closest resistance level is found at $51,000.
For BeInCrypto’s latest bitcoin (BTC) analysis, click here.


