


Bitcoin (BTC), Ethereum (ETH), and Aave (AAVE) are trading inside descending parallel channels.
XRP (XRP) is trading above the $1.05 horizontal support area.
Monero (XMR) has broken down from an ascending support line.
Cosmos (ATOM) reached a new all-time high price on Sept 13.
ICON (ICX) is attempting to break out from the $1.92 resistance area.
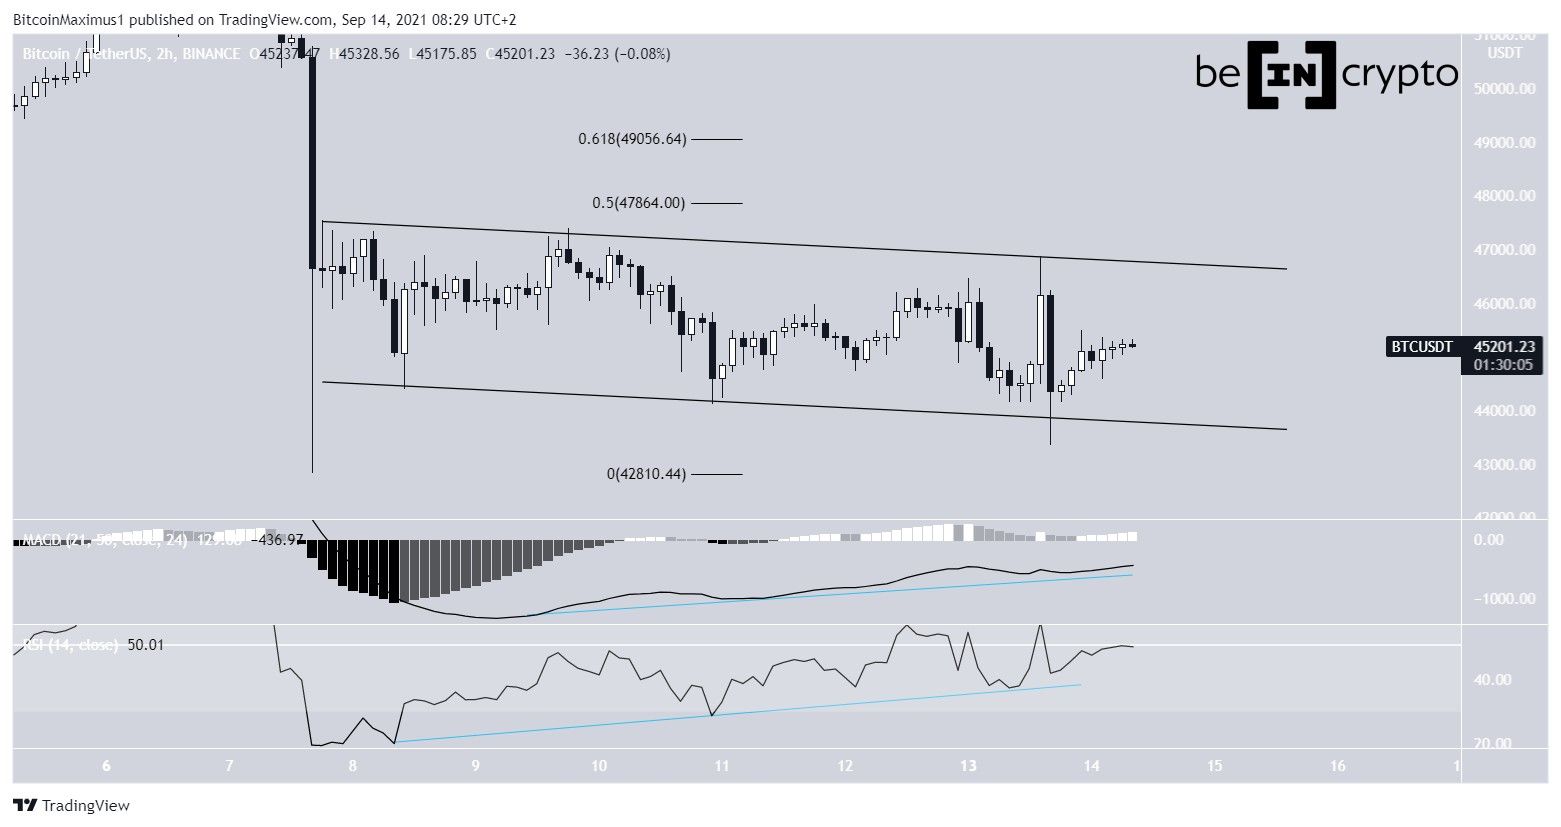
BTC
BTC has been trading inside a descending parallel channel since Sept 7. Such channels often contain corrective structures.
Furthermore, both the RSI and MACD have generated bullish divergences, a sign that a breakout is likely.
If one occurs, the closest resistance levels would be found at $47,850 and $49,050. These are the 0.5 and 0.618 Fib retracement resistance levels respectively.
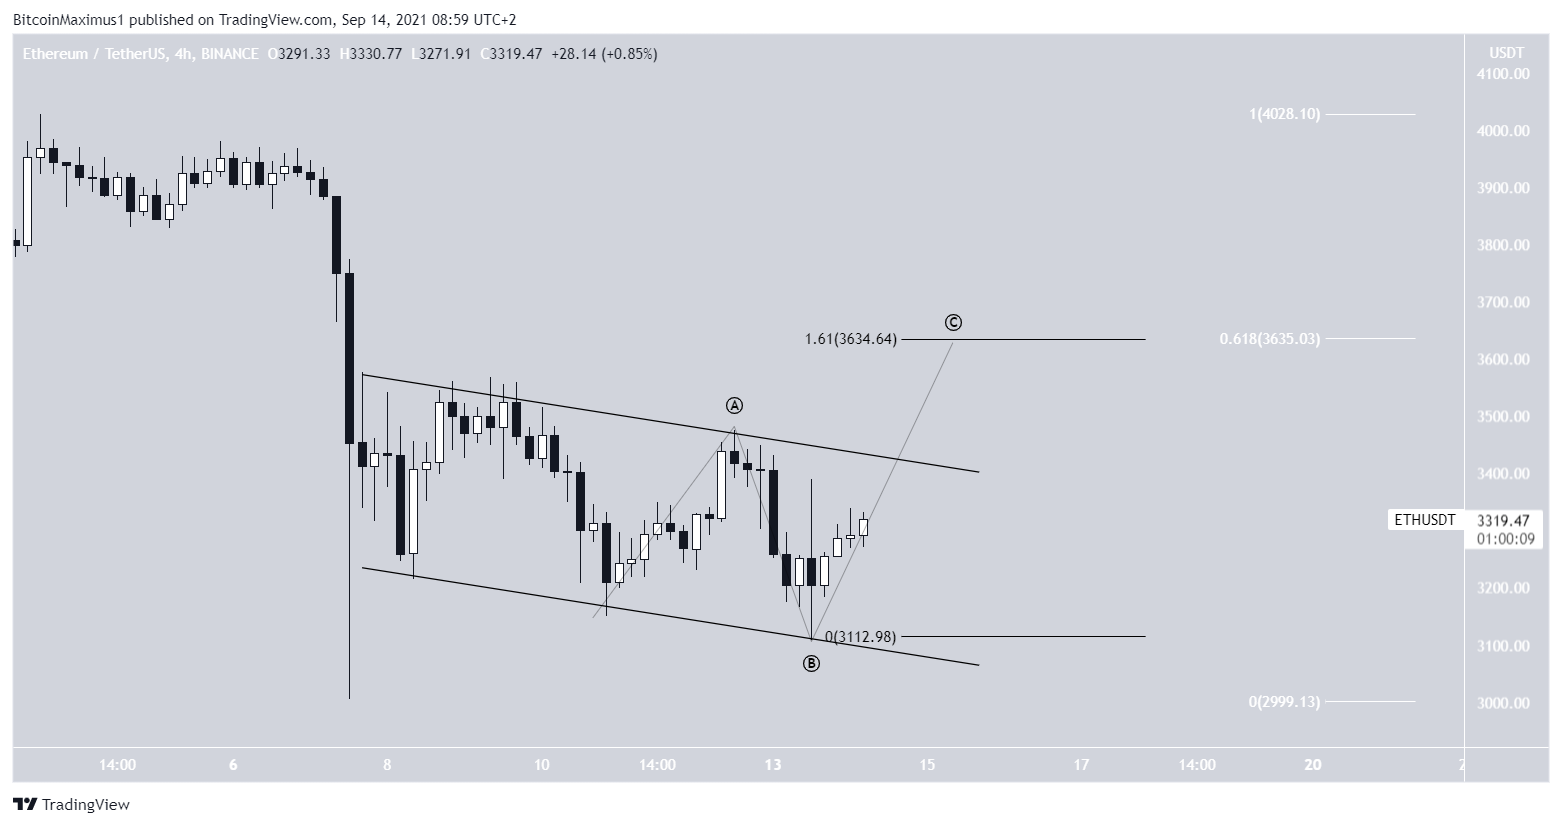
ETH
Similar to BTC, ETH has also been trading inside a descending parallel channel since Sept 7.
On Sept 13, it bounced at the support line of the channel and has been moving upwards since.
The movement may be forming an irregular flat corrective structure.
If true, ETH could increase all the way to $3,634 — the 0.618 Fib retracement resistance level (white). This would also give waves A:C a 1:1.61 ratio.
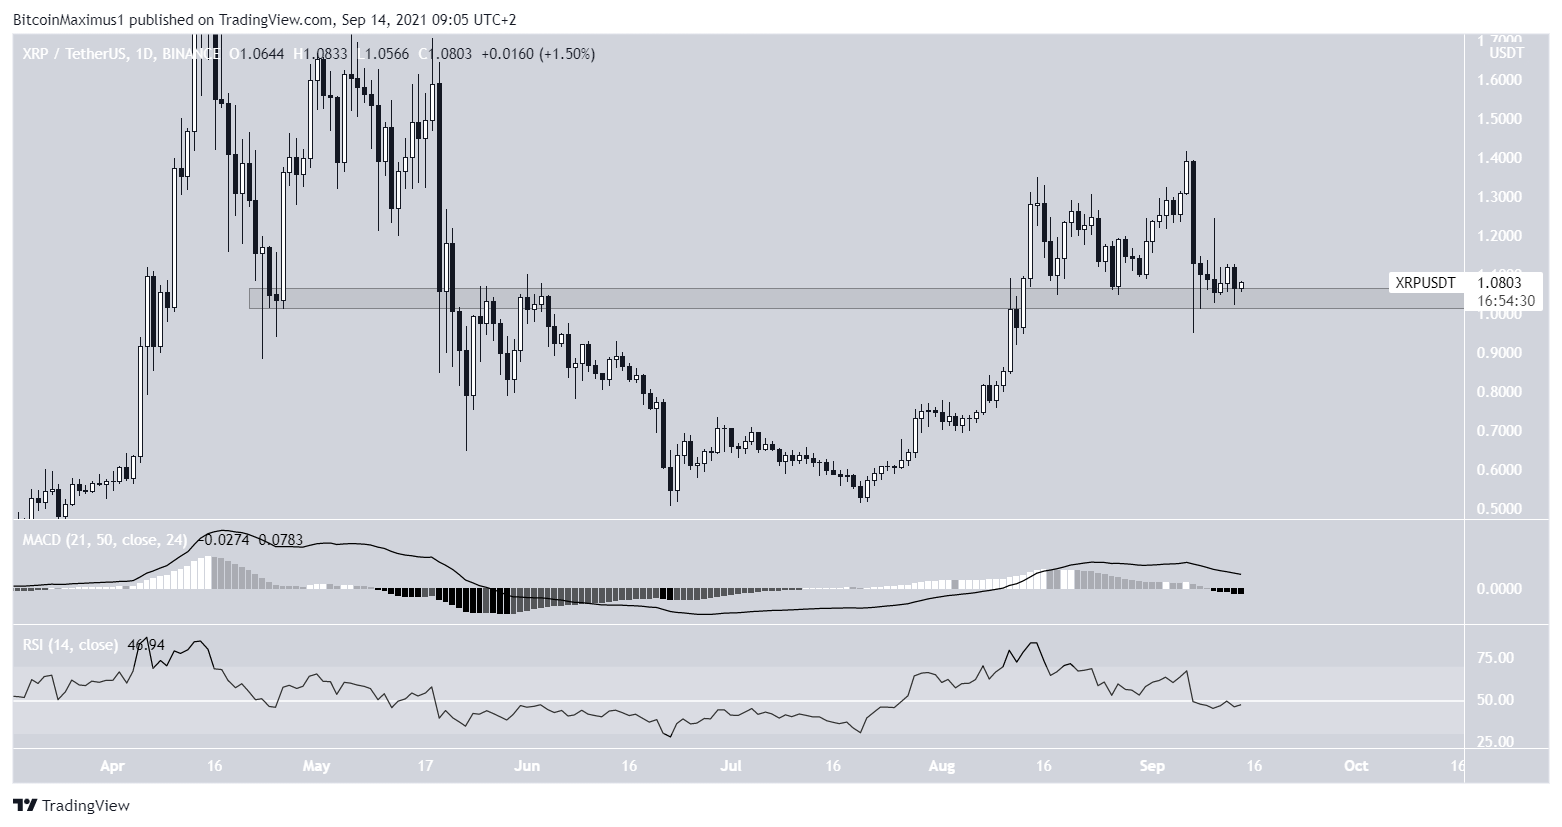
XRP
XRP has been decreasing since Sept 6 after it reached a high of $1.42. It’s currently trading just above the $1.05 horizontal support area.
Despite still being above support, technical indicators are bearish. The MACD and RSI are both decreasing and the latter is below 50.
Therefore, XRP may drop after a short-term bounce.
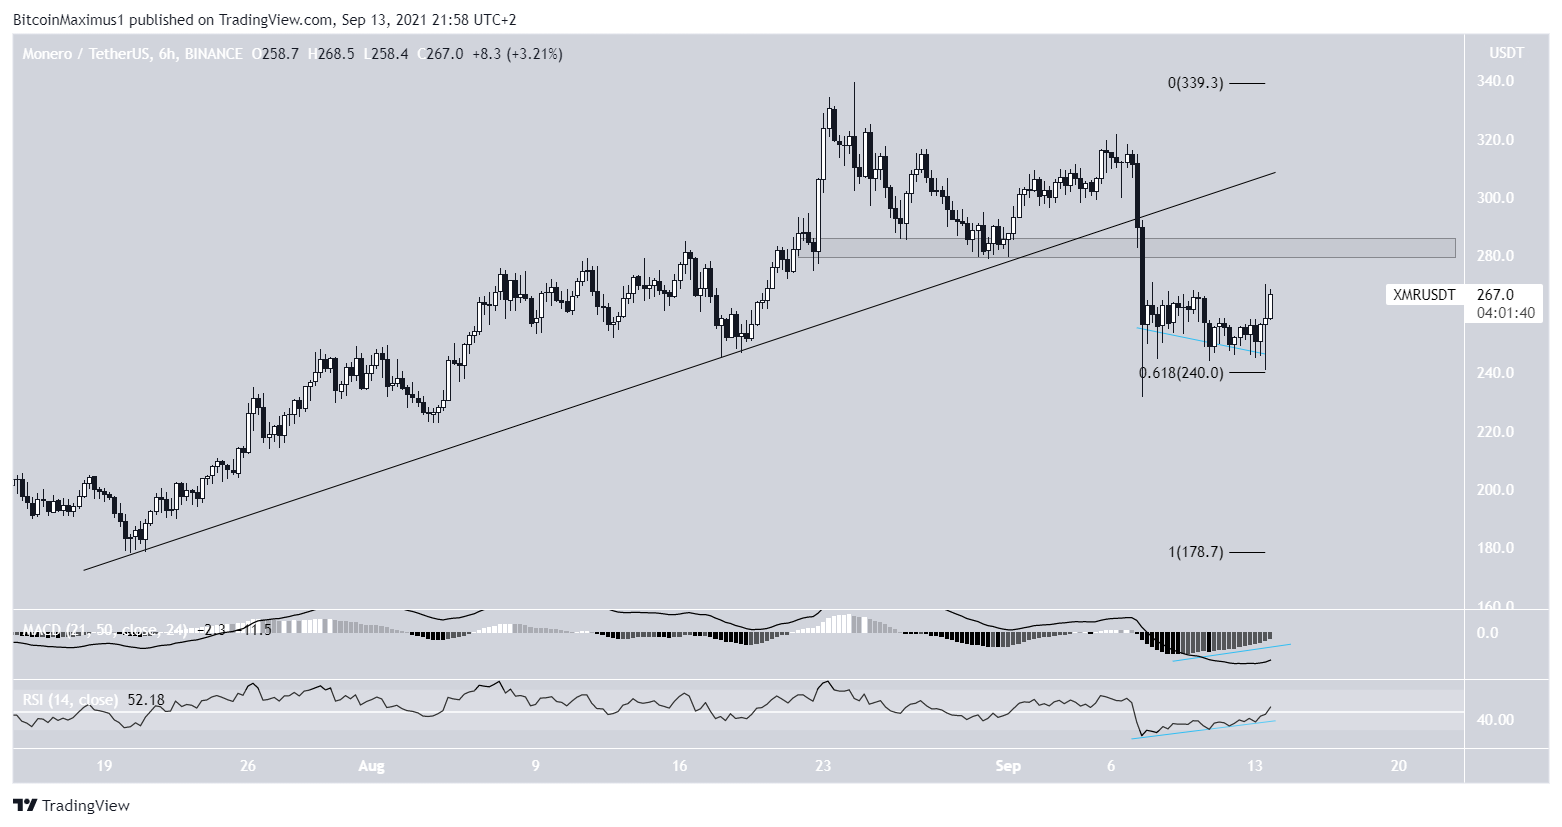
XMR
XMR had been following an ascending support line beginning on July 20. This led XMR to reach a high of $339.70 on Aug 24.
However, its price has been decreasing since. On Sept 7, it broke down from the support line and proceeded to reach a low of $232. The low was made right at the 0.618 Fib retracement support level.
After generating a bullish divergence, it began an upward move that is still ongoing. However, despite the rebound, XMR has to reclaim the $282 horizontal level for the short-term trend to be considered bullish.
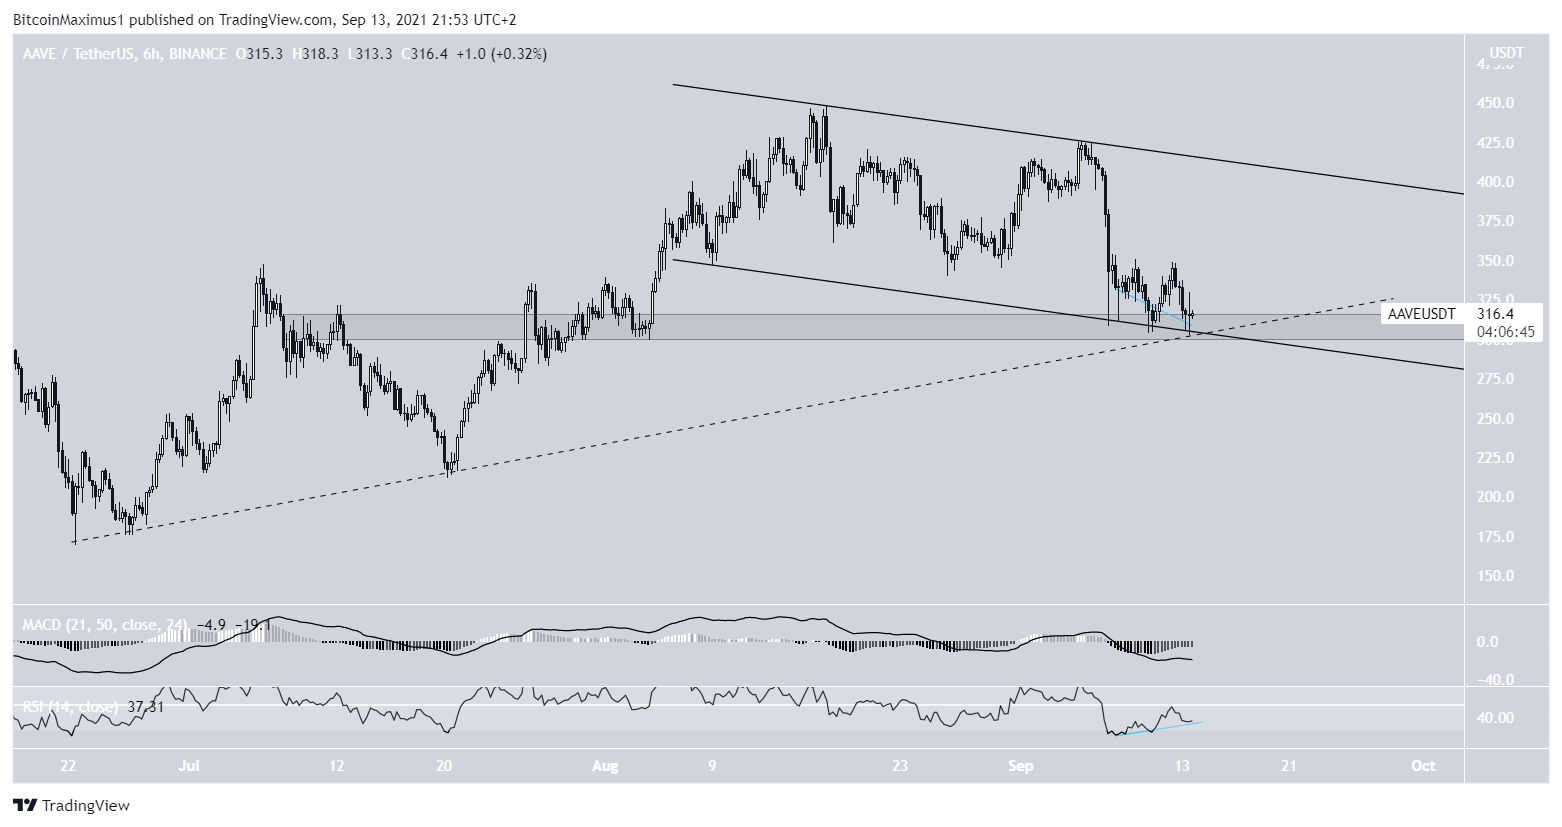
AAVE
AAVE has been decreasing inside a descending parallel channel since reaching a high of $443 on Aug 17.
On Sept 13, it reached a confluence of support levels (green circle), created by the:
- Support line of the channel
- $310 horizontal support area
- An ascending support line (dashed)
In addition to being at a strong support area, the RSI has generated a bullish divergence and the MACD is moving upwards. Since descending parallel channels usually contain corrective structures, an eventual breakout is expected.
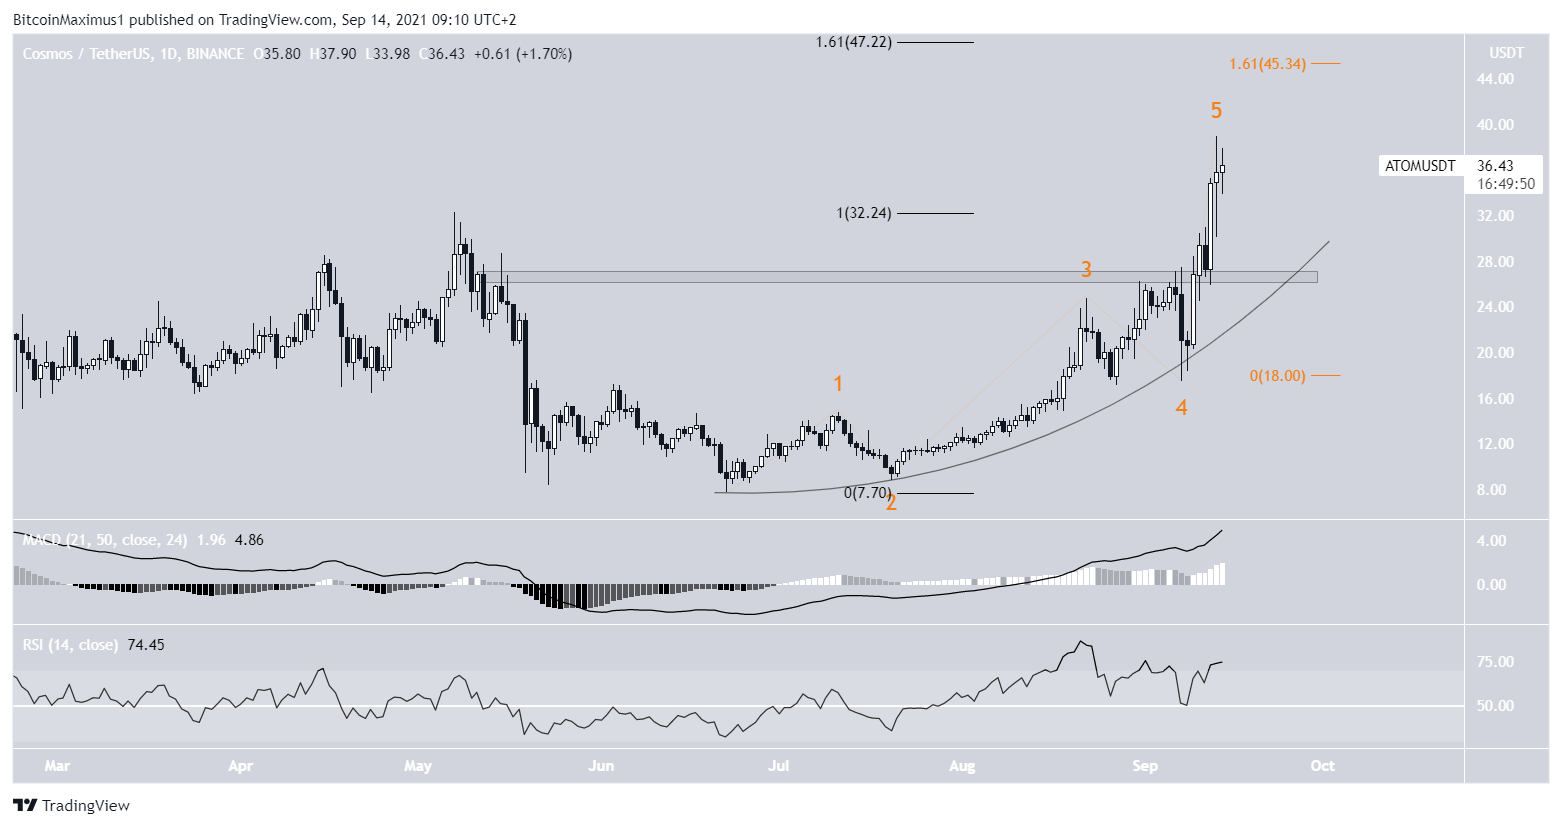
ATOM
ATOM has been increasing alongside a parabolic ascending support line since June 22.
On Sept 10, it broke out above the $26.80 resistance area and proceeded to reach a new all-time high of $38.95 three days later.
Technical indicators do not yet show any weakness and both the RSI and MACD are increasing.
It seems that ATOM is in wave five of a bullish impulse, with a potential target for the top of the move between $45.34 and $47.22. The target range is found using the 1.61 external Fib retracement level (black) and the 1.61 length of waves 1-3 (orange).
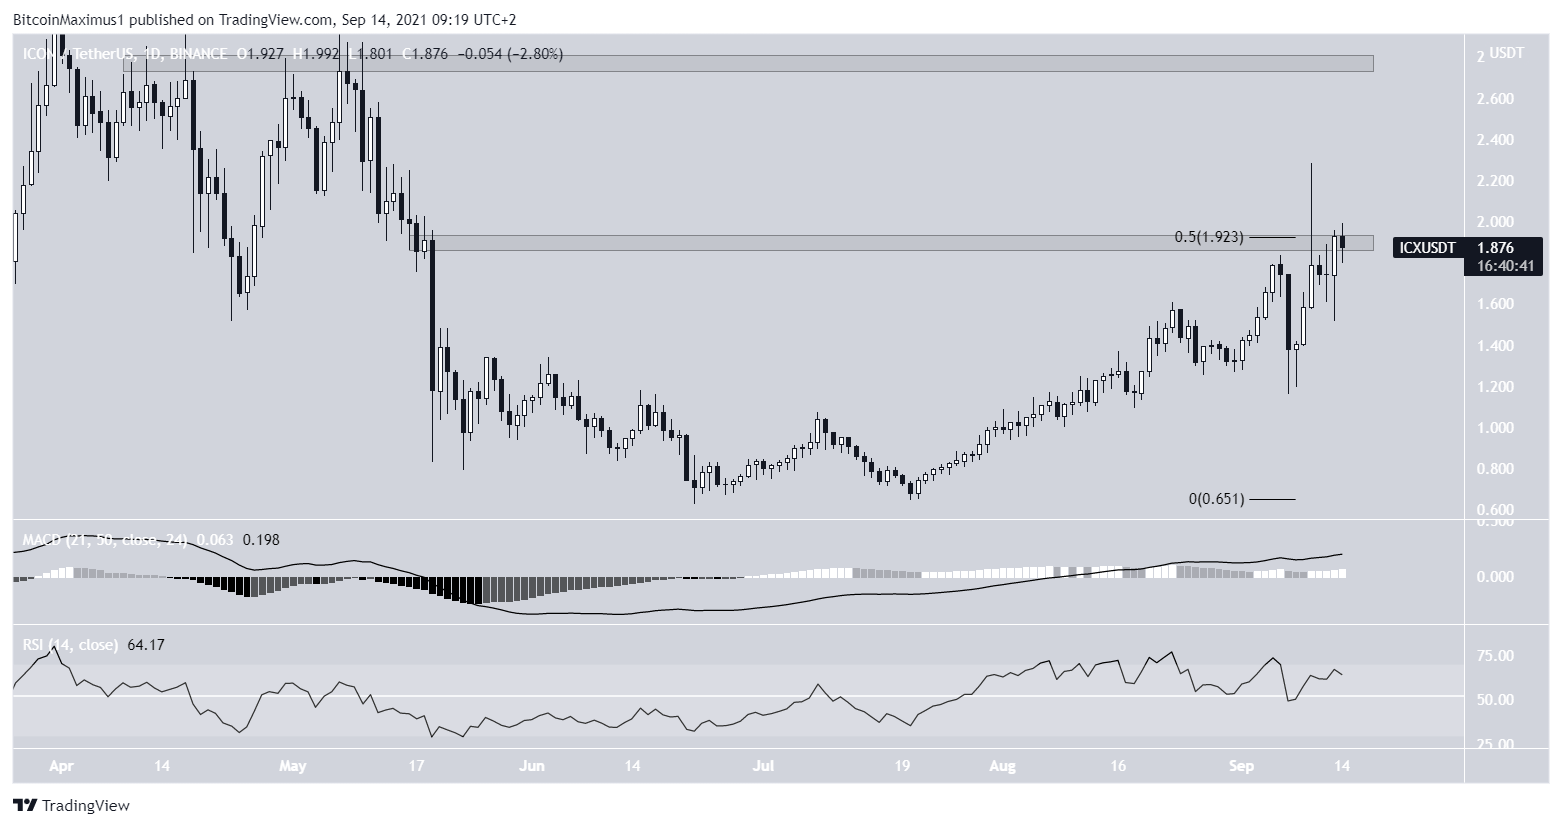
ICX
ICX has been increasing since July 20. On Sept 10, it attempted to break out above the $1.92 resistance area but was rejected and created a long upper wick.
However, it’s currently making another breakout attempt.
Both the MACD and RSI are increasing, supporting the possibility that ICX will move above this resistance area. If it does, the next resistance level would be found at $2.70.
For BeInCrypto’s latest Bitcoin (BTC) analysis, click here.


