XRP is trading inside a descending parallel channel.
OMG has broken out from a descending resistance line.
promo
Bitcoin (BTC) has bounced at the $30,000 support area.
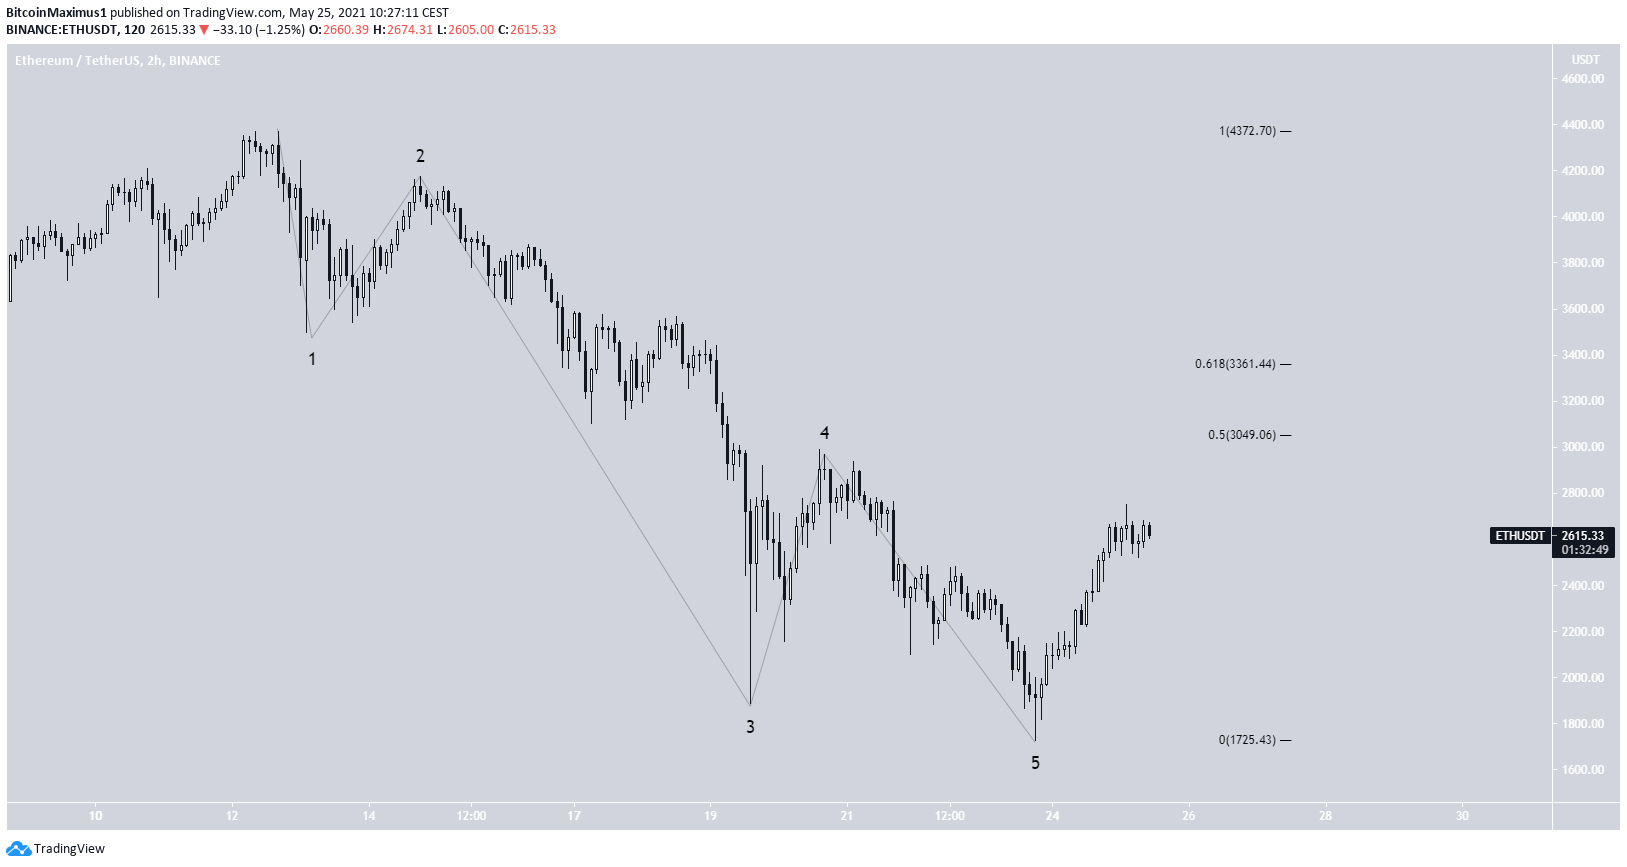
Ethereum (ETH) has completed a bearish impulse pattern.
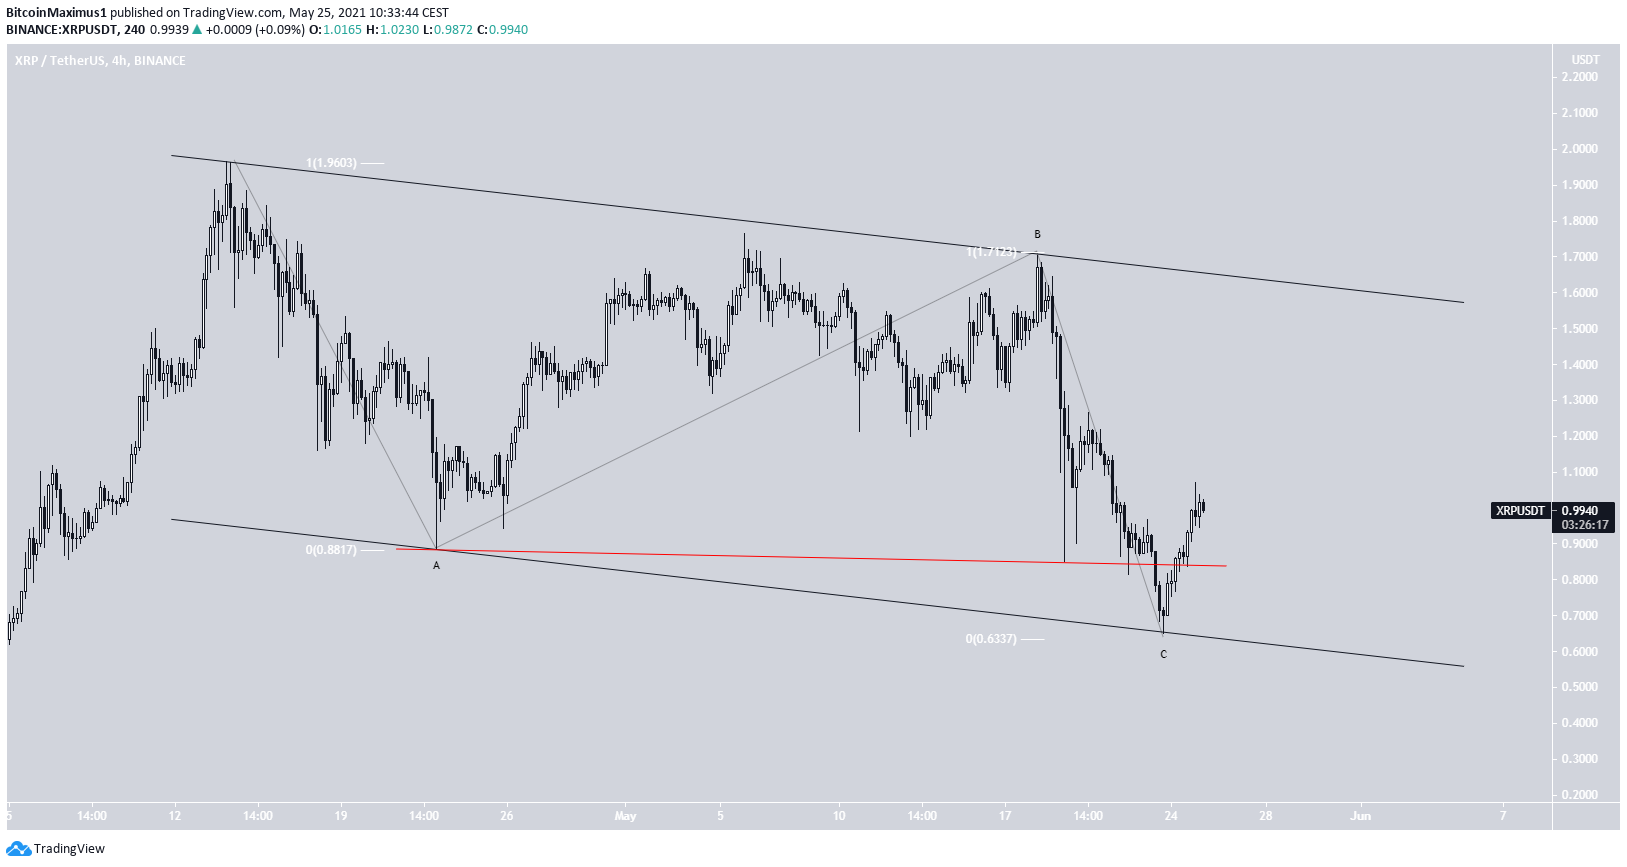
XRP (XRP) is trading inside a descending parallel channel.
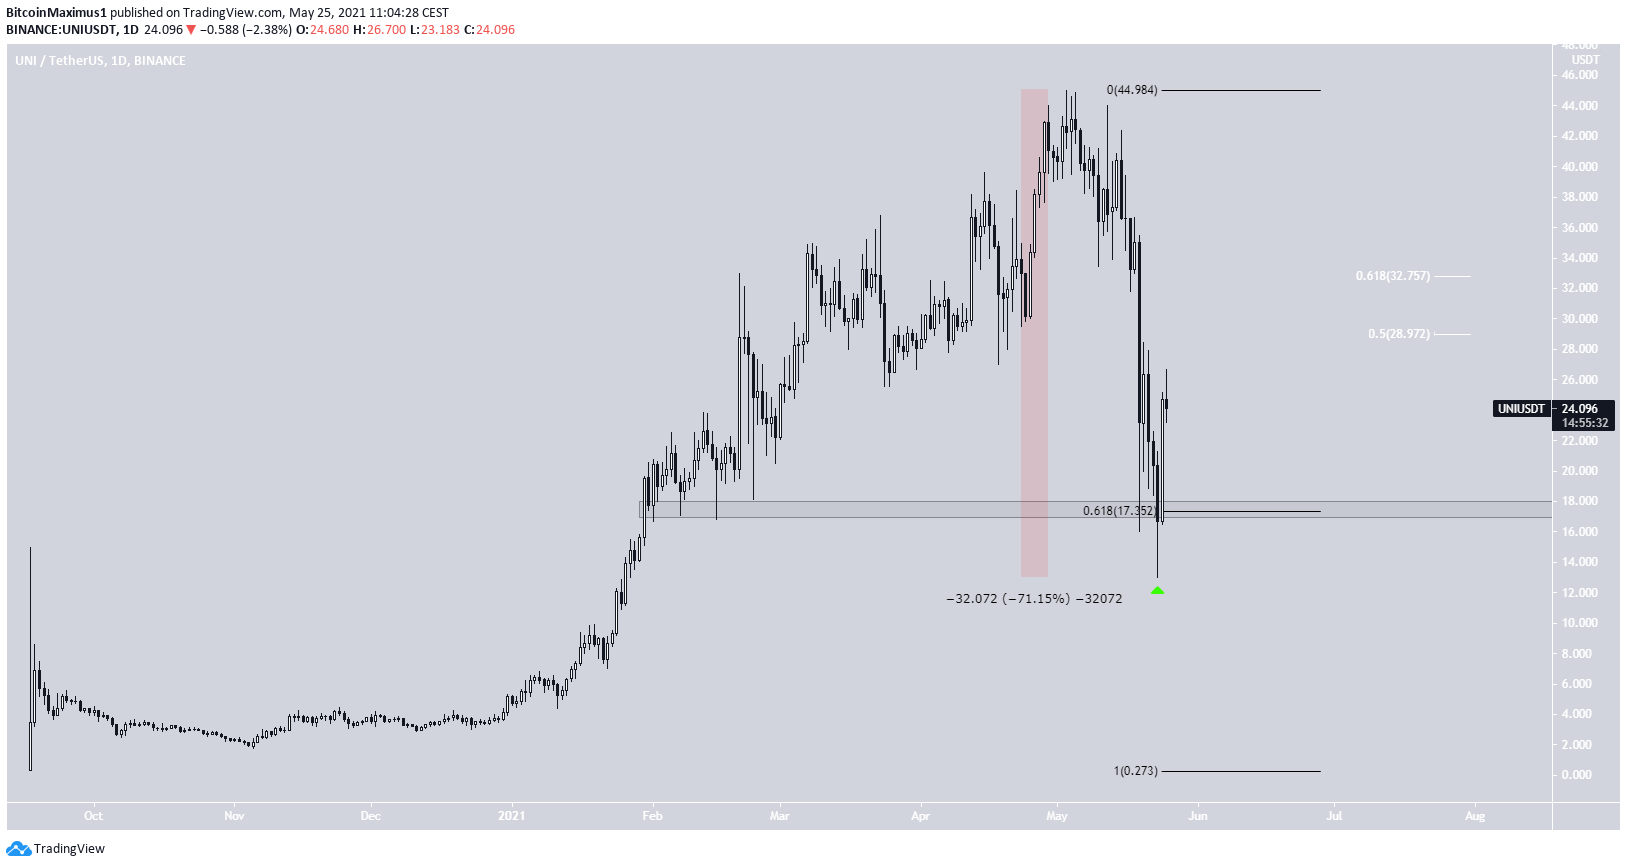
Uniswap (UNI) has bounced at the $17.35 support area.
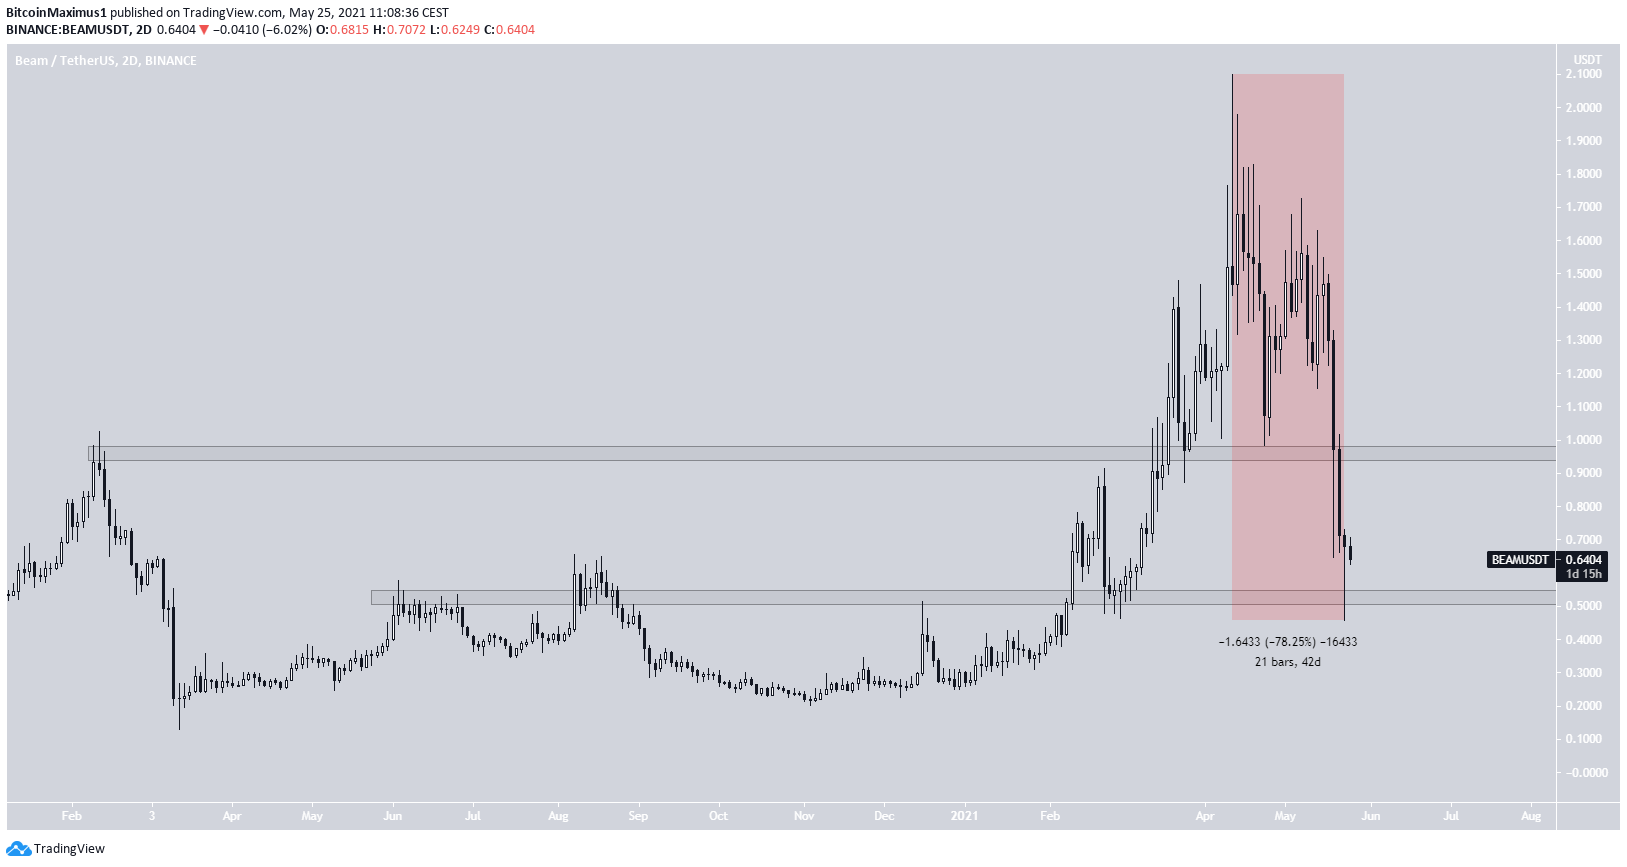
Beam (BEAM) is trading inside a range between $0.52 and $0.86.
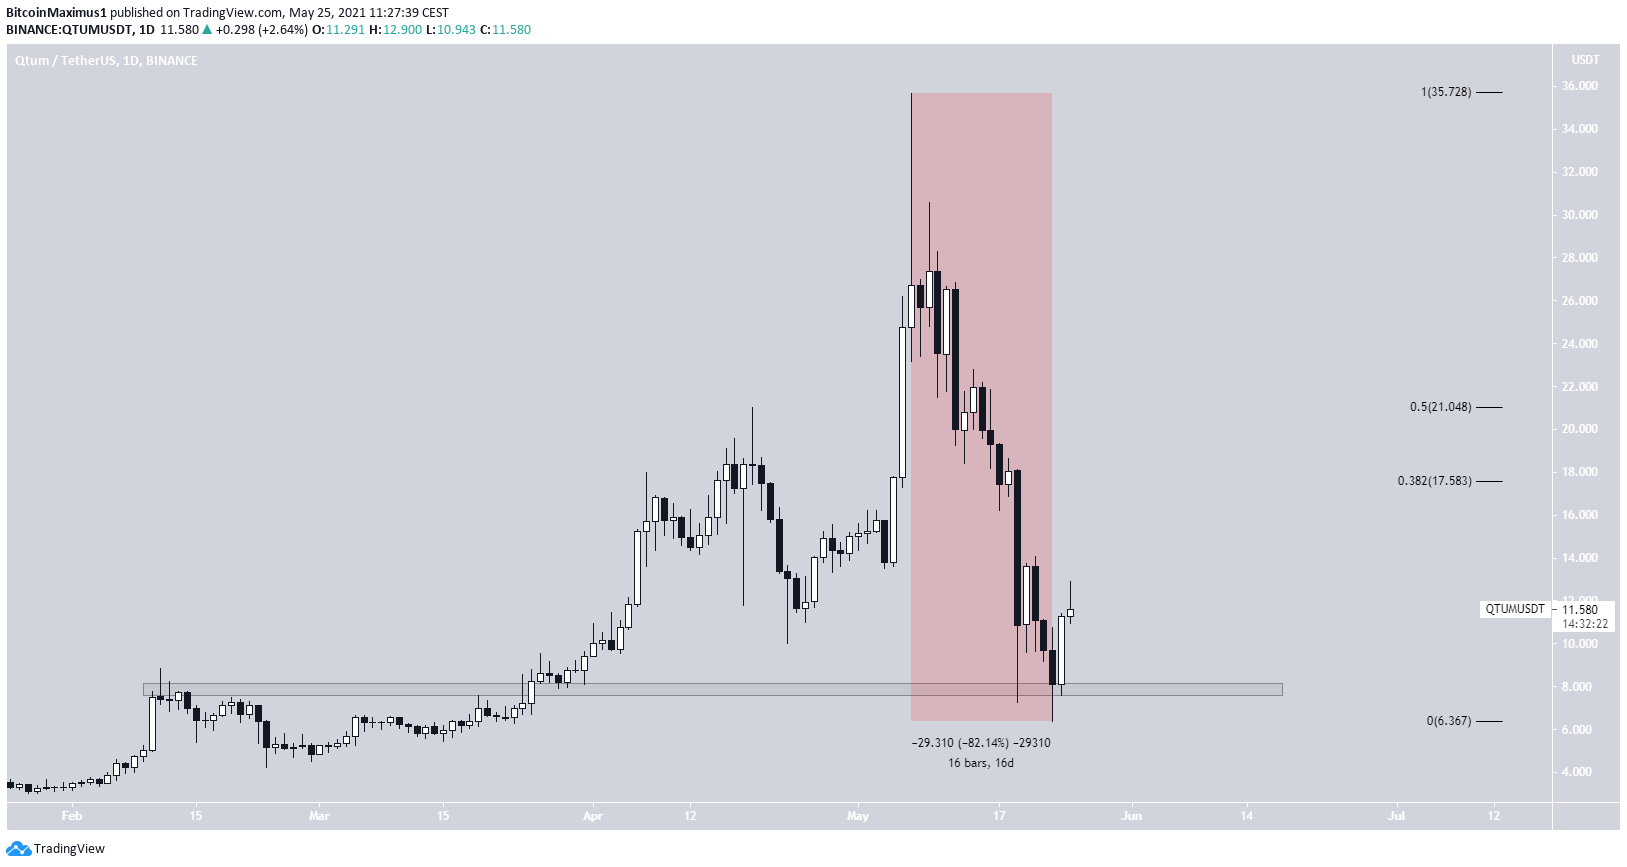
Qtum (QTUM) has bounced at the $7.70 support area.
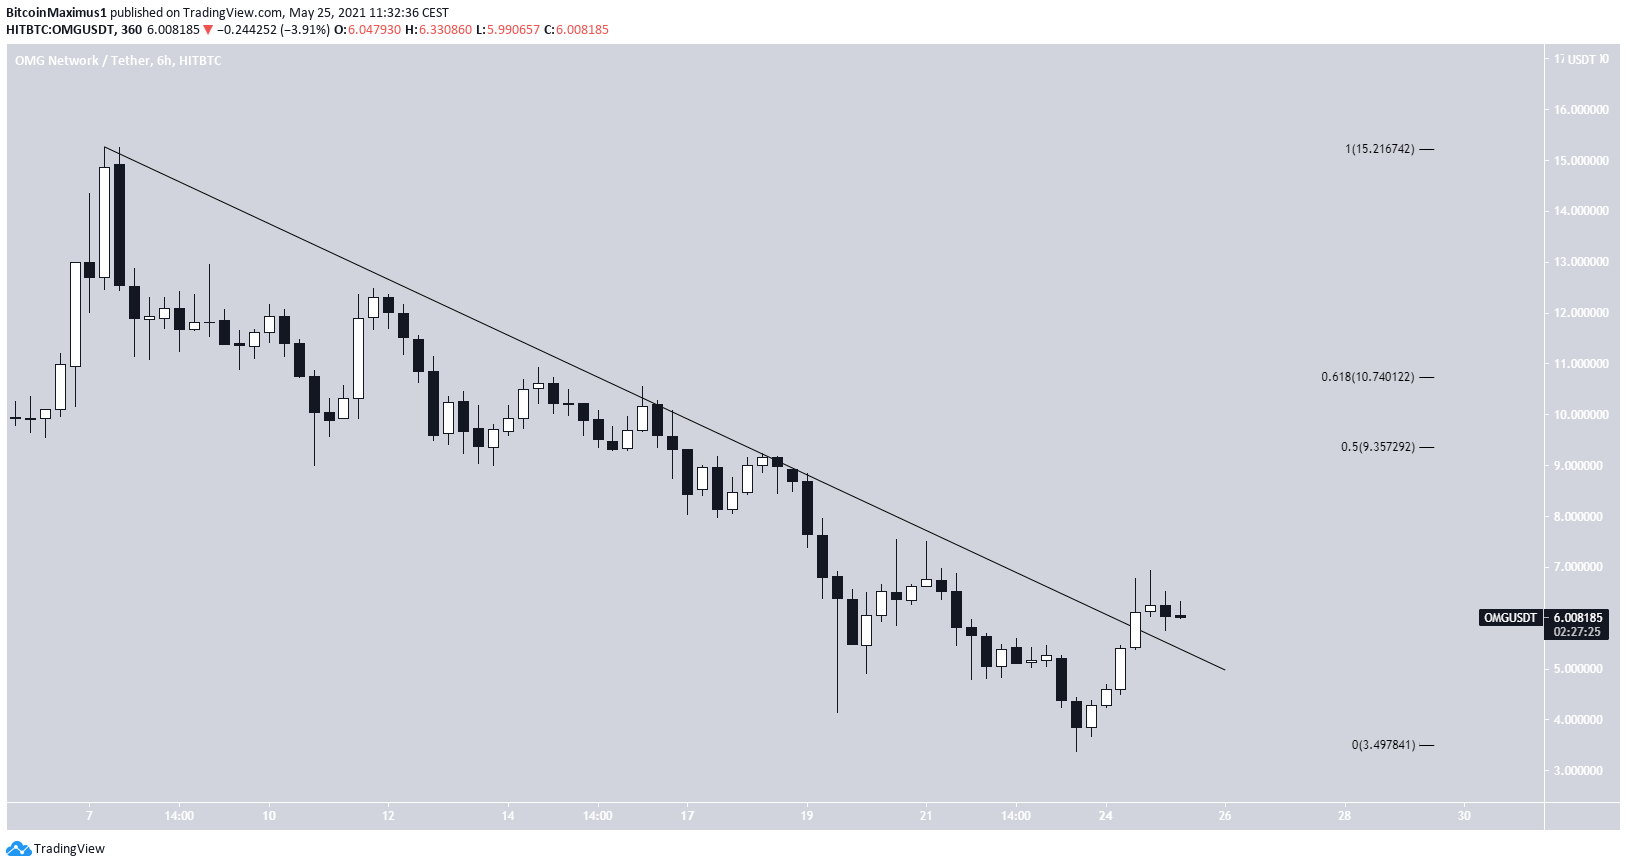
OMG Network (OMG) has broken out from a descending resistance line.
BTC
After reaching a low of $30,000 on May 19, BTC bounced significantly. While it retraced afterward, it managed to create a higher low on May 23 and followed it with a bullish engulfing candlestick.
Technical indicators are potentially turning bullish. The daily RSI has generated a bullish divergence and has crossed above 30. In addition, the MACD has made a higher momentum bar.
The next closest resistance levels are found at $41,200 and $48,170.
BTC Chart By TradingView
ETH
ETH has been decreasing since May 12 after reaching an all-time high price of $4,372. The decrease has been sharp, culminating with a low of $1,728, reached on May 23.
While ETH has been increasing since then, the preceding downward movement looks like a bearish impulse. Therefore, it’s possible that the ongoing increase is the A wave of an A-B-C corrective structure.
If so, ETH could find resistance between the 0.5-0.618 Fib retracement support levels found at $3,050 and $3,360, respectively.
ETH Chart By TradingView
XRP
XRP has been trading inside a descending parallel channel since reaching a high on April 14. Parallel channels usually contain corrective structures. XRP bounced at the support line of the channel on May 23 and has been increasing since.
Another element that substantiates the possibility of the movement being a correction is the ratio between the decreases. If the movement is an A-B-C structure, waves A:C had an exact 1:1 ratio (white), very common in such structures.
Unlike ETH, the overlap between the two movements (red line) indicates that this is not a bearish impulse.
XRP Chart By TradingView
UNI
UNI has been moving downwards since May 3, when it reached an all-time high price of $45. The decrease was swift, at one point measuring 71%.
On May 23, UNI reached a low of $13 and bounced, creating a bullish engulfing candlestick. Since then, it has reclaimed the 0.618 Fib retracement support level at $17.35.
As a result of the drop, the next closest resistance levels are found between $29 and $32.75. These are the 0.5 and 0.618 Fib retracement resistance levels.
UNI Chart By TradingView
BEAM
BEAM has been decreasing since reaching an all-time high price of $2.10 on April 11.
The correction continued for 42 days, culminating with a low of $0.256 being reached on May 24. This amounted to a downward movement of 78%, slightly higher than those of UNI and ETH.
However, BEAM has bounced above the $0.52 support area, creating a long lower wick. The closest resistance area is found at $0.96.
It’s possible that BEAM will consolidate inside this range for a bit.
BEAM Chart By TradingView
QTUM
On May 7, QTUM reached an all-time high price of $35.68. What followed was a 16-day corrective period, in which the token’s price fell by 82%. This culminated with a low of $6.37 on May 23. Similar to ETH, the drop resembles a bearish impulse.
The dip also managed to validate the $7.70 area as support.
If QTUM continues to increase, the closest resistance levels are found at $17.60 and $21. These are the 0.382 and 0.5 Fib retracement resistance levels.
QTUM Chart By TradingView
OMG
OMG had been following a descending resistance line since reaching a high of $15.62 on May 7.
After four unsuccessful breakout attempts, OMG finally moved above the line on May 24.
At the time of press, it was in the process of validating the level as support.
The main resistance area is found between $9.36 and $10.74. This target zone is made from the 0.5-0.618 Fib retracement resistance levels.
OMG Chart By TradingViewFor BeInCrypto’s latest bitcoin (BTC) analysis, clickhere.
In line with the Trust Project guidelines, this price analysis article is for informational purposes only and should not be considered financial or investment advice. BeInCrypto is committed to accurate, unbiased reporting, but market conditions are subject to change without notice. Always conduct your own research and consult with a professional before making any financial decisions. Please note that our Terms and Conditions, Privacy Policy, and Disclaimers have been updated.
Valdrin discovered cryptocurrencies while he was getting his MSc in Financial Markets from the Barcelona School of Economics. Shortly after graduating, he began writing for several different cryptocurrency related websites as a freelancer before eventually taking on the role of BeInCrypto's Senior Analyst.
(I do not have a discord and will not contact you first there. Beware of scammers)