
Bitcoin (BTC) price and the Ethereum (ETH) price have broken out from their respective patterns. XRP price has yet to do so and is still showing conflicting signs in regard to the direction of its trend.
Bitcoin Price Prediction: BTC Sustains Gains Above $20,000
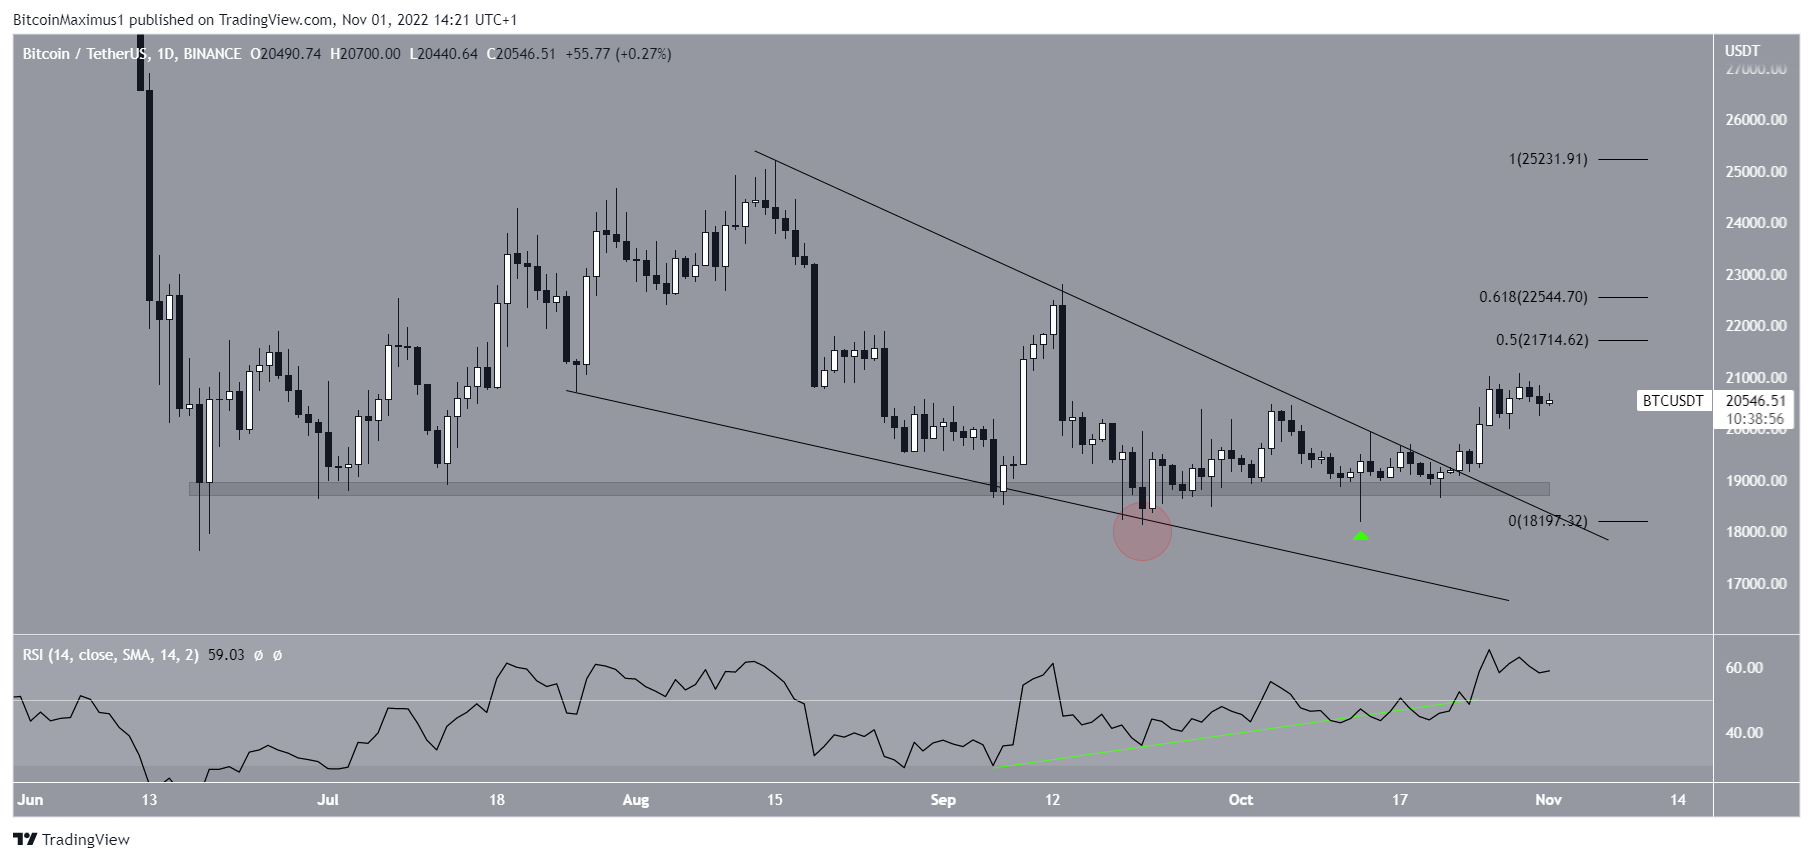
Bitcoin price had been decreasing inside a descending wedge since Aug. 15. While doing so, it seemed to break down below the $18,850 area several times, most notably on Sept. 21 (red circle) and Oct. 13 (green icon). However, it bounced both times, creating a long lower wick during the latter.
Afterward, the BTC price initiated an upward movement. It broke out from the wedge on Oct. 23. The breakout is supported by the daily RSI, which has generated a bullish divergence (green line) and moved above 50. So far, the Bitcoin price has reached a high of $21,085, doing so on Oct. 29.
The main resistance area is between $21,714-$22,544, created by the 0.5-0.618 Fib retracement resistance levels and a horizontal resistance area.
Whether the Bitcoin price will break out or get rejected from it will likely determine the direction of the future trend.
Ethereum Price Prediction: ETH Breaks Out
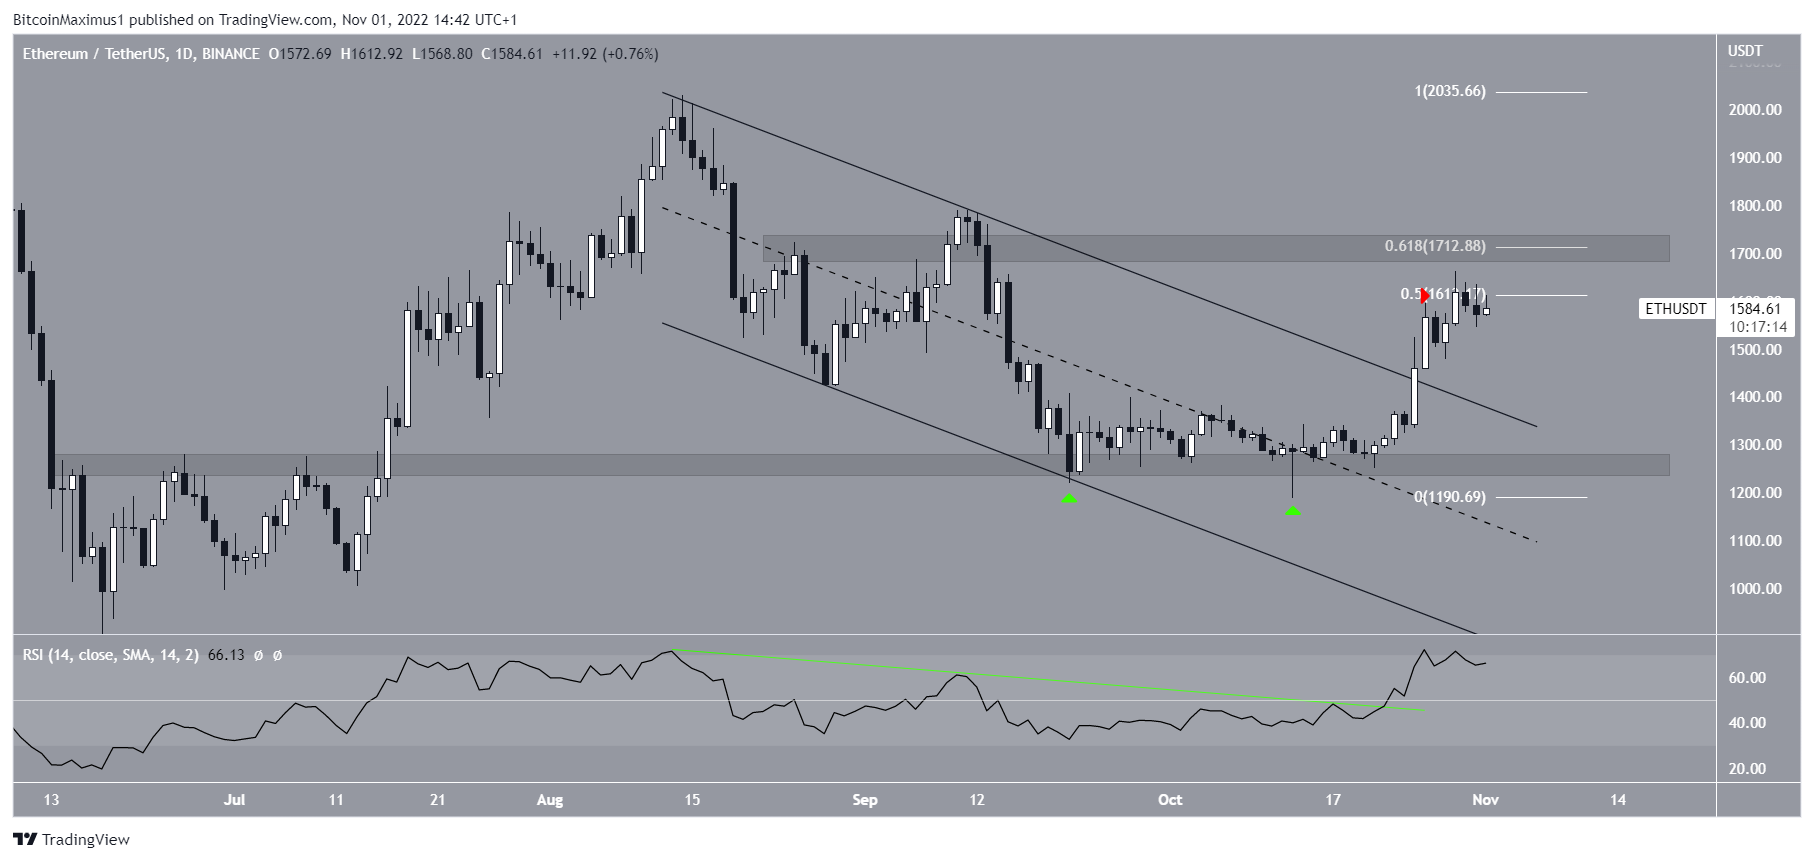
The Ethereum price had decreased inside a descending parallel channel since Aug. 22, when it reached a high of $2,020. While doing so, it bounced at the $1,260 horizontal support area twice (green icons), on Sept. 21 and Oct. 13, respectively. The latter also created a long lower wick, which is considered a sign of buying pressure.
Technical indicators are bullish. While the RSI did not generate bullish divergence, it broke out from its bearish trend line (green) on Oct. 23 and is now above 50. The ETH price broke out from the channel two days later and reached a high of $1,663 on Oct. 29.
Currently, the Ethereum price is attempting to move above the 0.5 Fib retracement resistance level at $1,613 (red icon). However, the first attempt was unsuccessful, and the ETH price has decreased in the past 24 hours. In any case, the main resistance area is at $1,713, created by both the 0.618 Fib retracement resistance level and a horizontal resistance area.
Whether the ETH price manages to reclaim the $1,713 level or gets rejected will likely determine the direction of the future trend.
XRP Price Prediction: Ripple Continues Consolidating
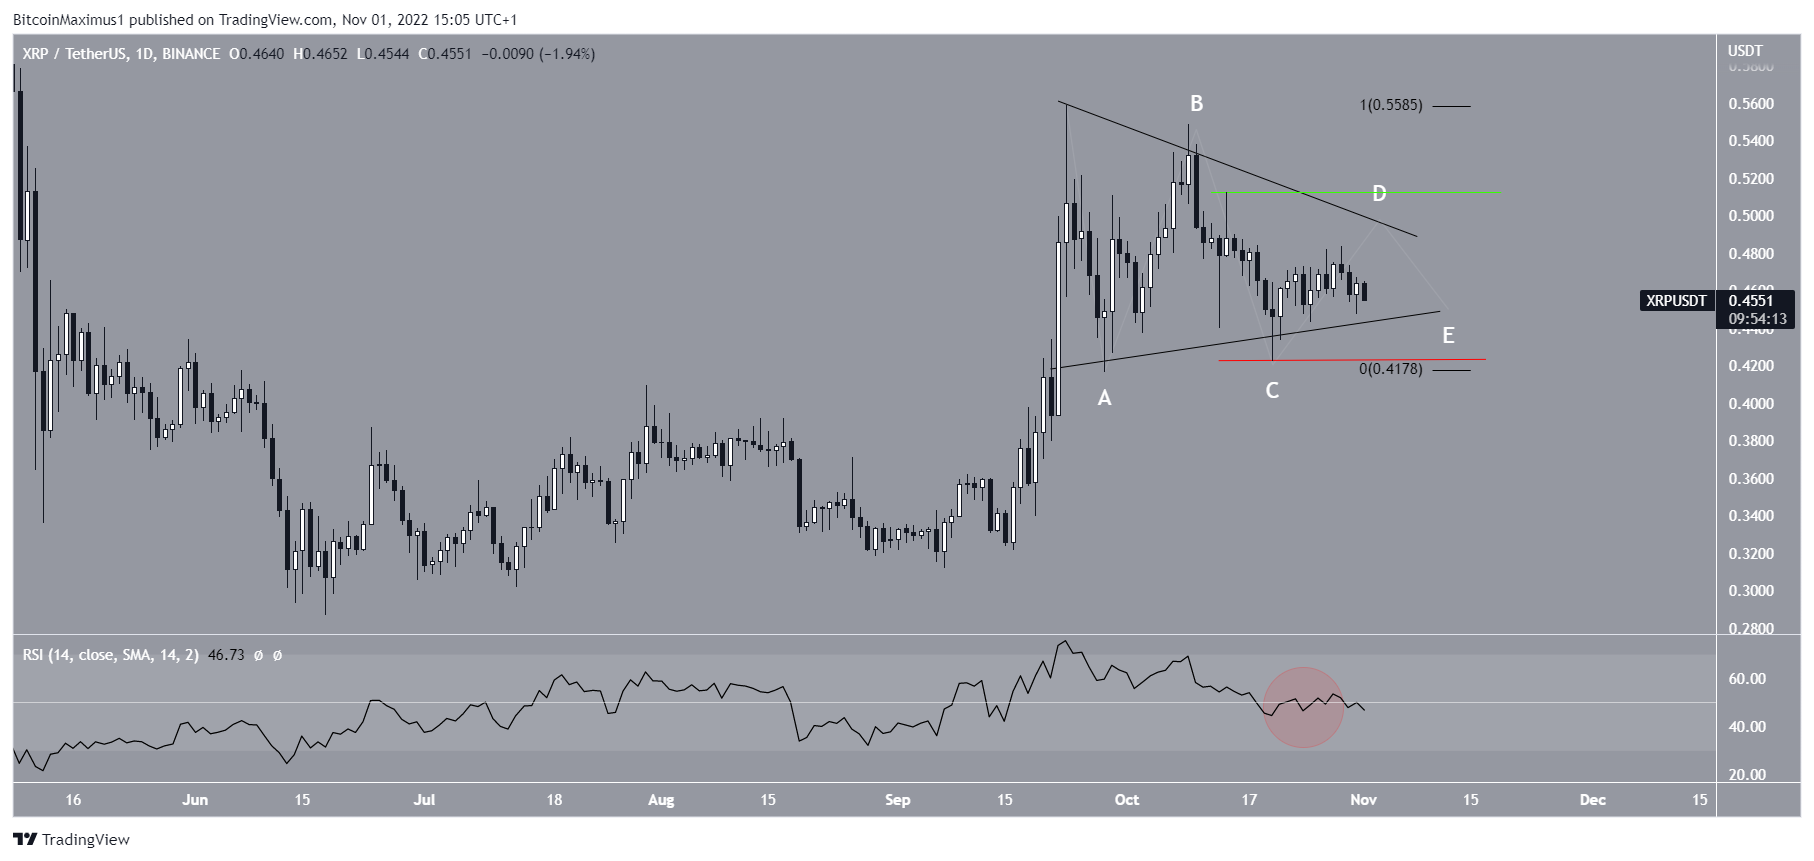
While the price action for both BTC and ETH looks decisively bullish, the outlook is less clear for XRP. The price of XRP has been trading inside a symmetrical triangle since reaching a high of $0.56 on Sept. 23. Since the triangle is considered a neutral pattern, both a breakout and breakdown remain possible.
Furthermore, the daily RSI is moving freely above and below 50 (red circle). This is also considered a sign of a neutral trend and adds to the uncertainty from the daily time frame.
Therefore, whether the XRP price breaks out or down from the triangle will likely determine the direction of the future trend. A drop below $0.42 (red line) would be bearish while an increase above $0.51 (green line) would be bullish.
For the latest BeInCrypto Bitcoin (BTC) and crypto market analysis, click here
Disclaimer: BeInCrypto strives to provide accurate and up-to-date information, but it will not be responsible for any missing facts or inaccurate information. You comply and understand that you should use any of this information at your own risk. Cryptocurrencies are highly volatile financial assets, so research and make your own financial decisions.
