
Bitcoin (BTC) has reached an important Fibonacci resistance level.
WAVES (WAVES) reached a new all-time high price on April 27. Ethereum (ETH) and Verge (XVG) have shown bullish trend continuation signs. XRP (XRP), COTI (COTI), and Balancer (BAL) have completed their fourth waves.
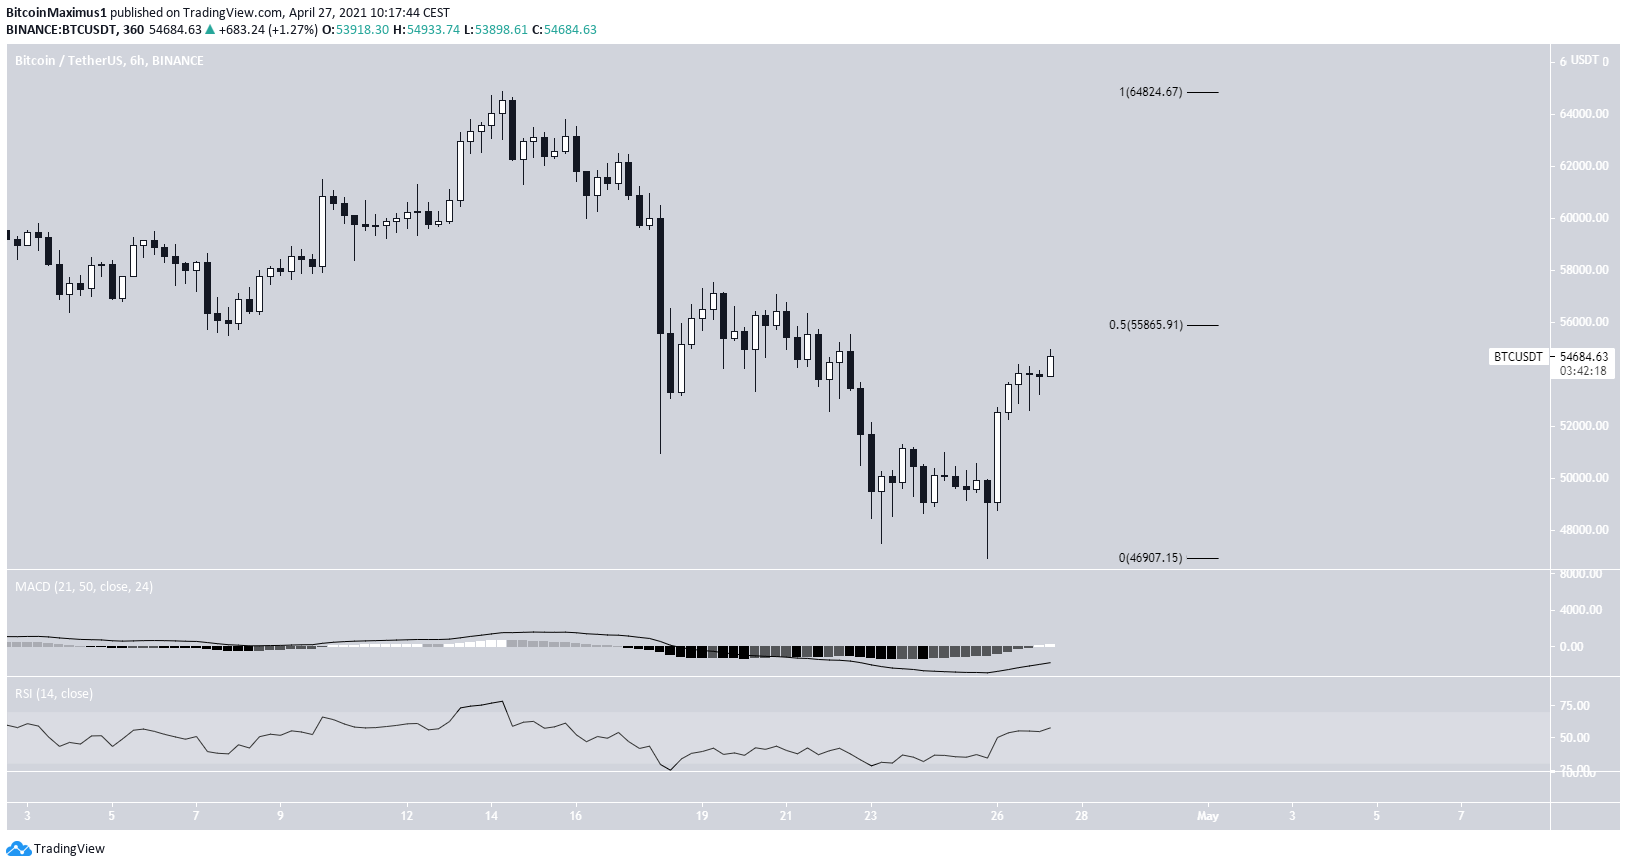
BTC
BTC has increased considerably since bouncing on April 26. Currently, it’s trading close to the 0.5 Fib retracement level of the previous downward movement. This is likely to act as resistance and cause a short-term rejection.
For a longer-term analysis, click here.
ETH
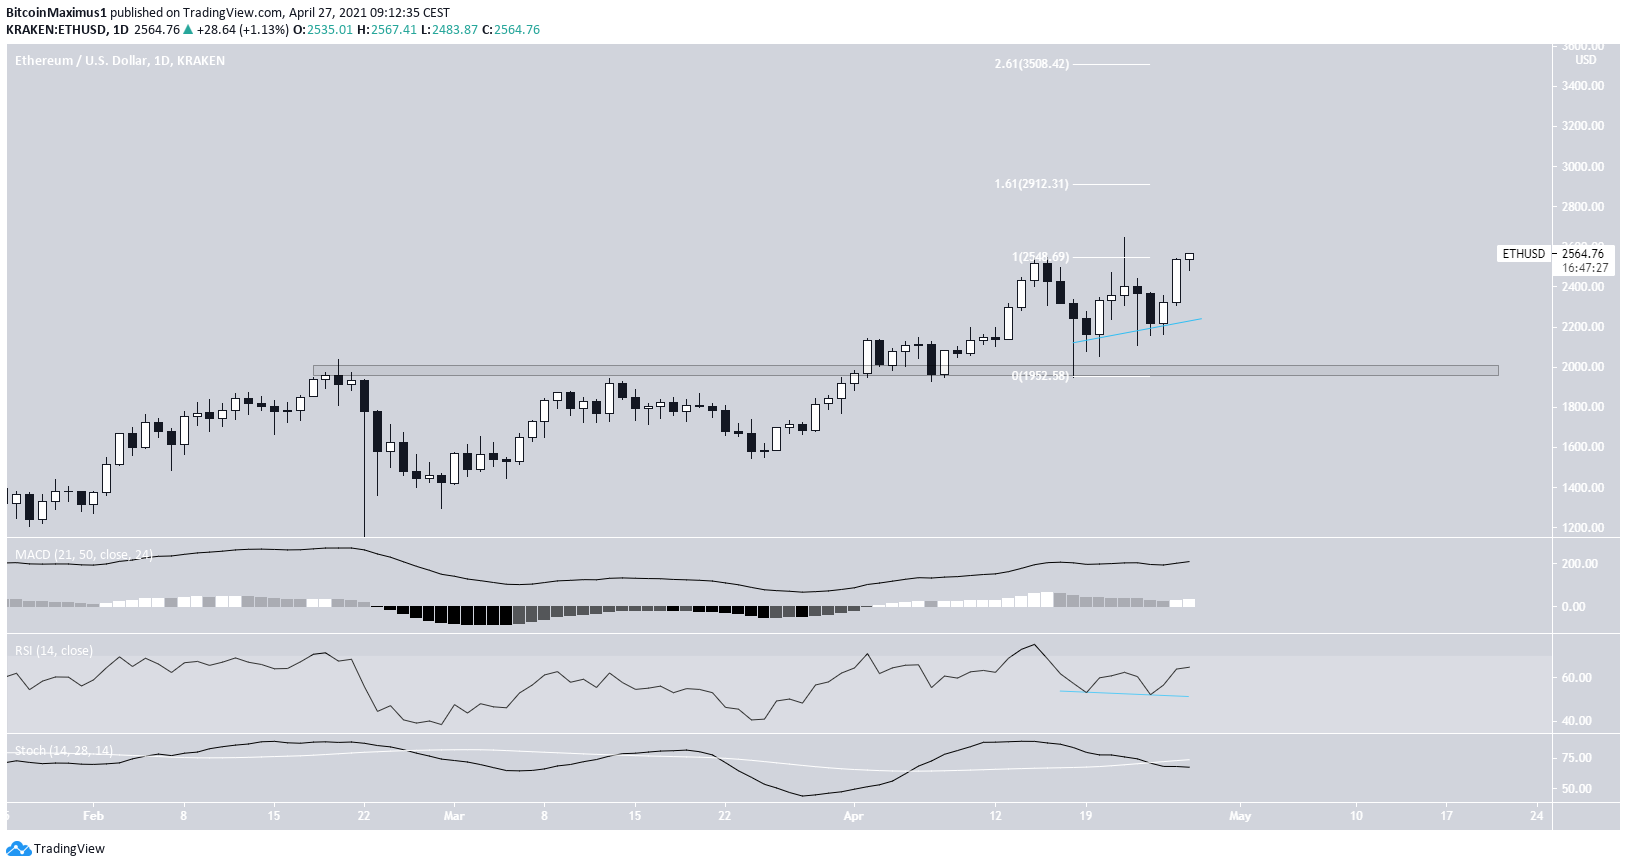
On April 22, ETH reached a new all-time high price but decreased shortly after.
Currently, it’s making another attempt at breaking out. If successful, the next closest resistance levels would be found at $2,912 and $3,508. These levels are found using the 1.61 and 2.61 external Fib retracements.
Technical indicators are mostly bullish. The MACD and RSI are increasing. The latter has even generated a hidden bullish divergence. However, the Stochastic oscillator is still bearish.
For a longer-term analysis, click here.
XRP
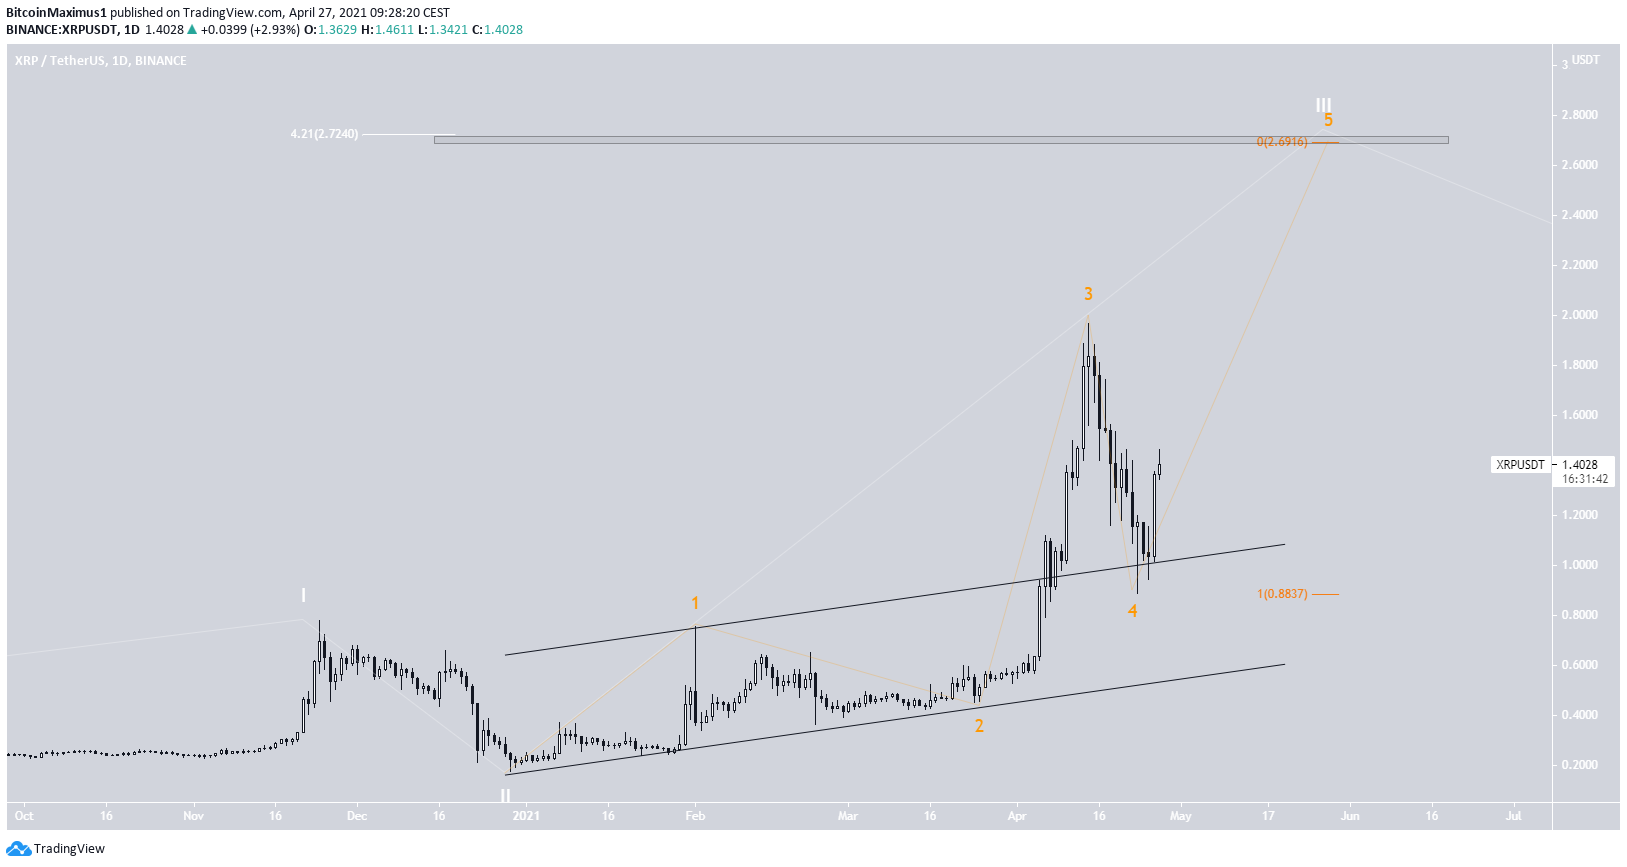
XRP has been moving downwards since it reached a local high of $1.96 on April 14. It’s likely that this was the top of sub-wave three (orange).
The ensuing decrease took the token to a low of $0.88 on April 23, potentially completing a fourth wave pullback.
A potential target for the top of the ensuing upward movement is given at $2.69-$2.72, found by using a combination of Fib projections and extensions.
BAL
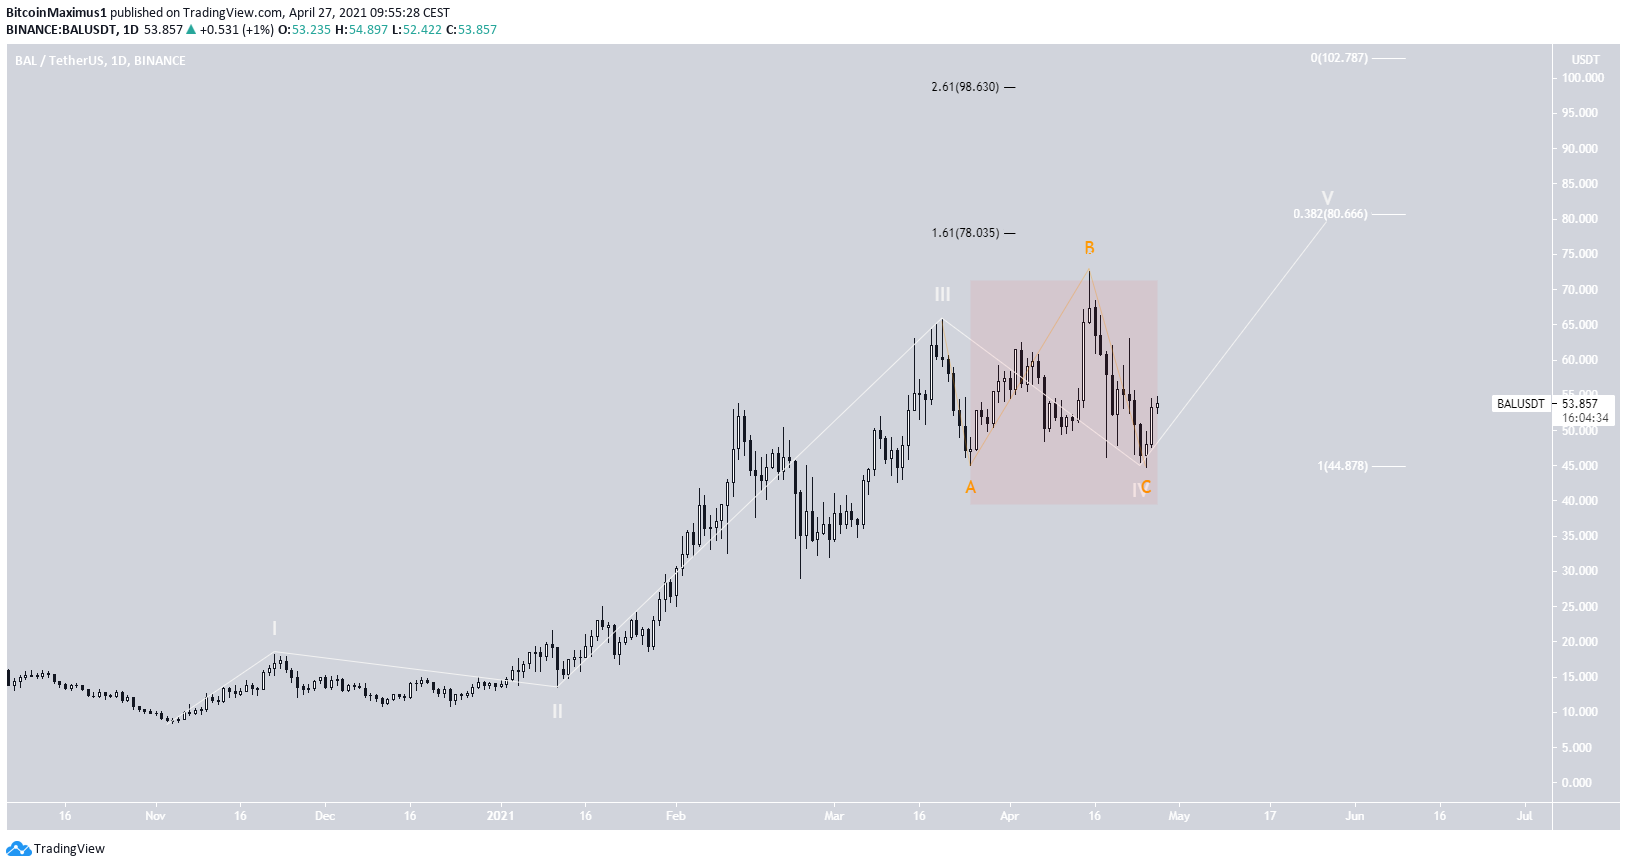
BAL has been decreasing since reaching an all-time high price of $72.63 on April 15. On April 25, it reached a low of $43.73 and bounced.
The movement since the previous high on March 20 looks like a completed flat A-B-C corrective structure.
Therefore, it’s possible that the highlighted wave four is complete and BAL will begin increasing once more.
As a result, the two most likely targets for the top of the movement are found between $78-80 and $98-102.
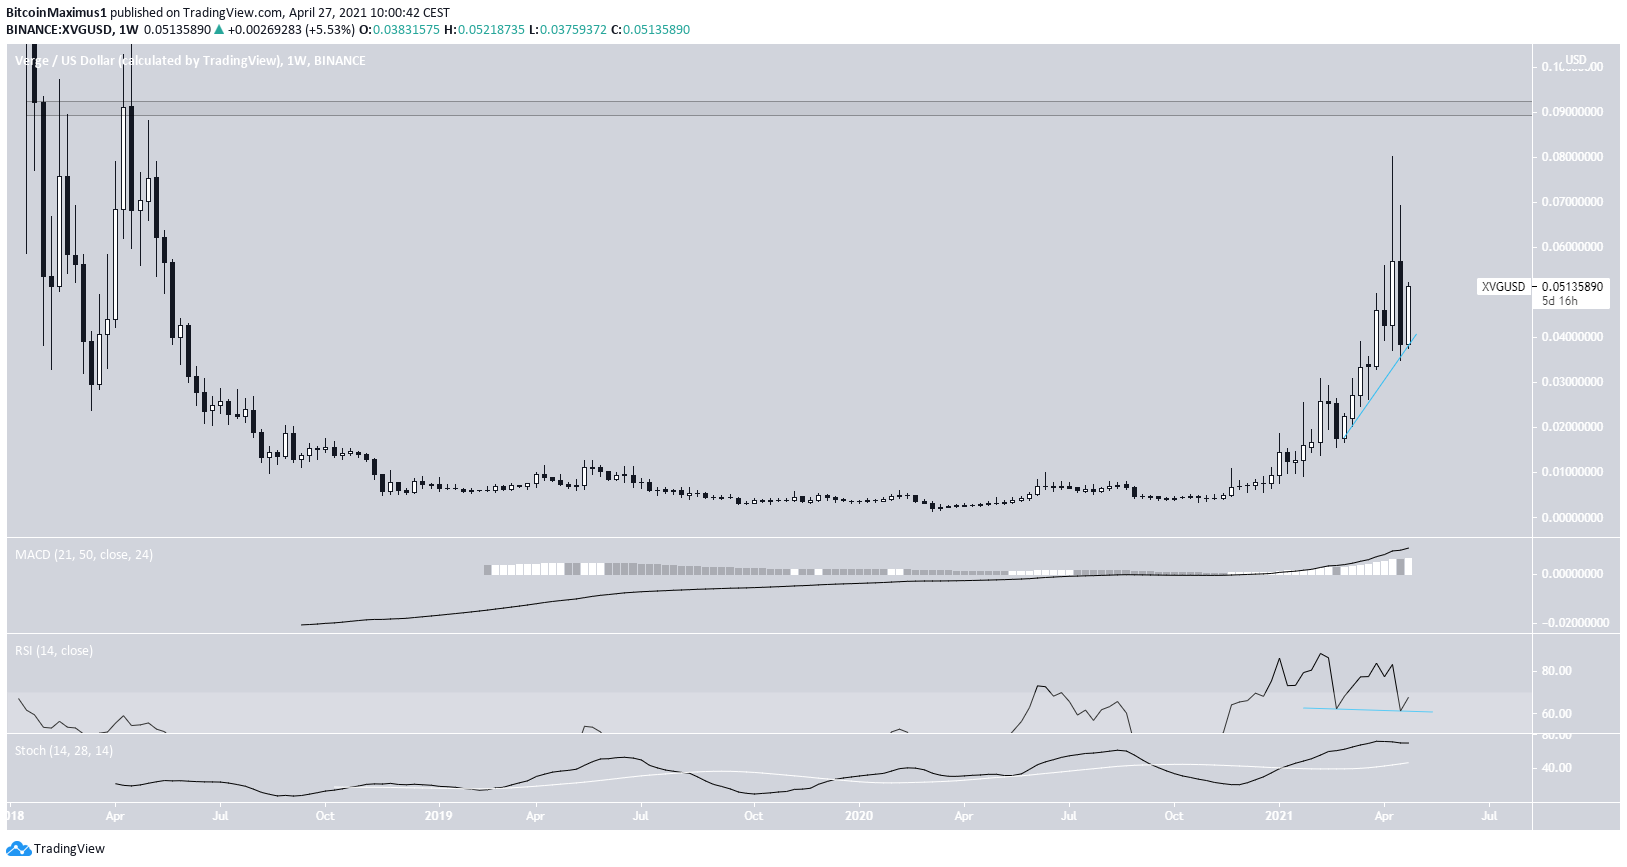
XVG
XVG has been decreasing over the past two weeks, creating successive long upper wicks. In addition, it has created a bearish engulfing candlestick.
Despite the drop, technical indicators are bullish. The MACD and Stochastic oscillator are increasing. In addition, the weekly RSI has generated a hidden bullish divergence.
The next significant resistance area is found at $0.09.
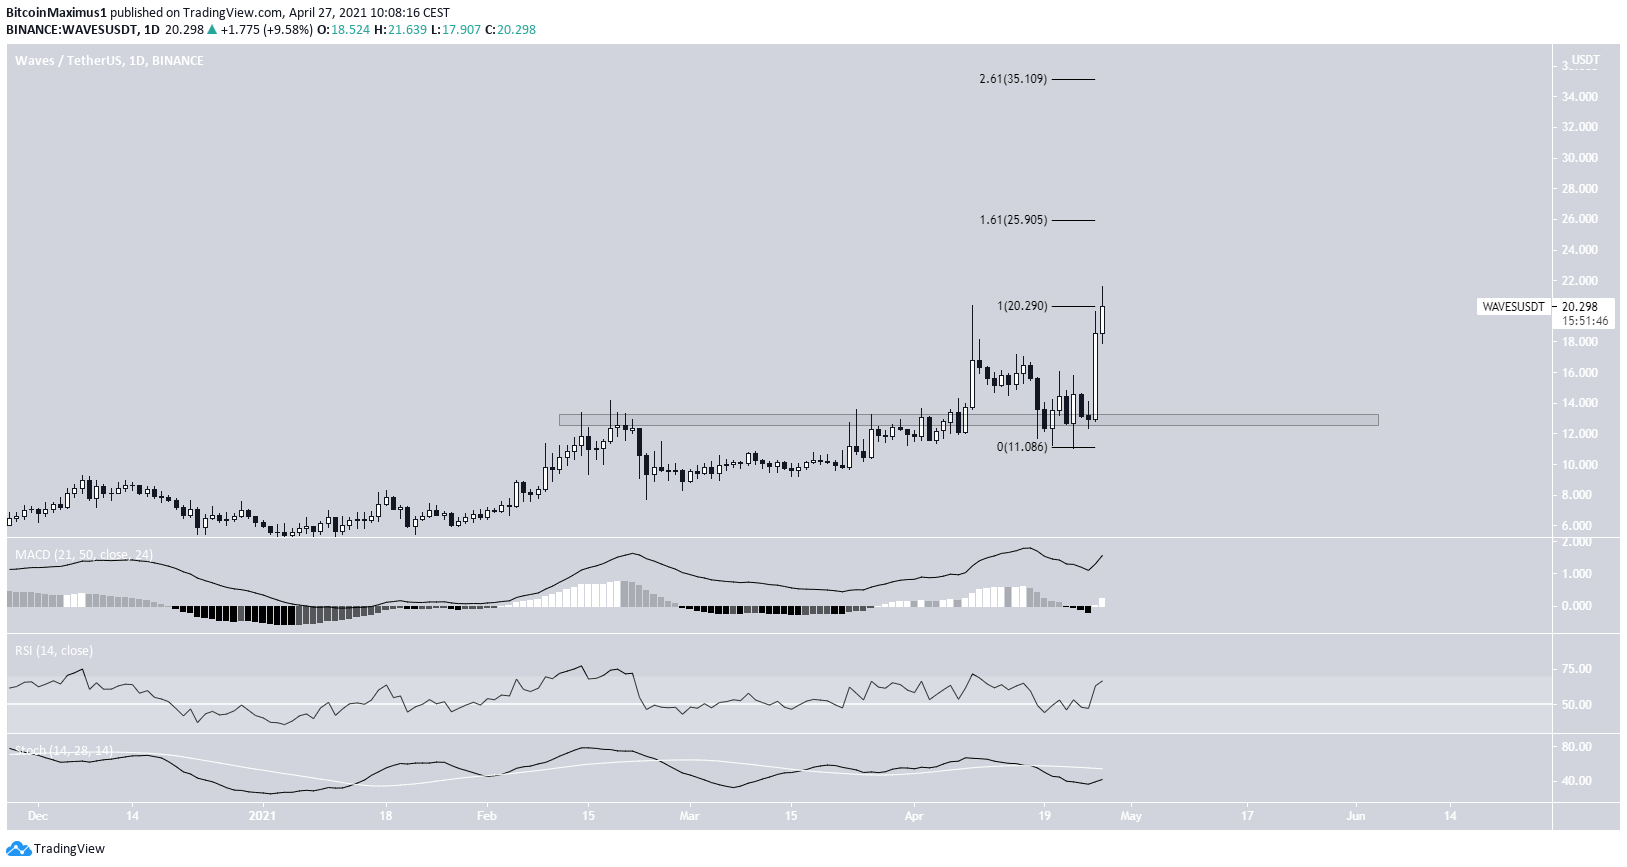
WAVES
On April 9, WAVES reached a then all-time high price of $20.35 and dropped. The decrease served to validate the $13 area as support, before beginning another bounce.
On April 27, the token reached a new all-time high price of $21.63. The next resistance levels are found at $25.90 and $35.10.
Technical indicators are bullish, supporting the continuation of the upward movement.
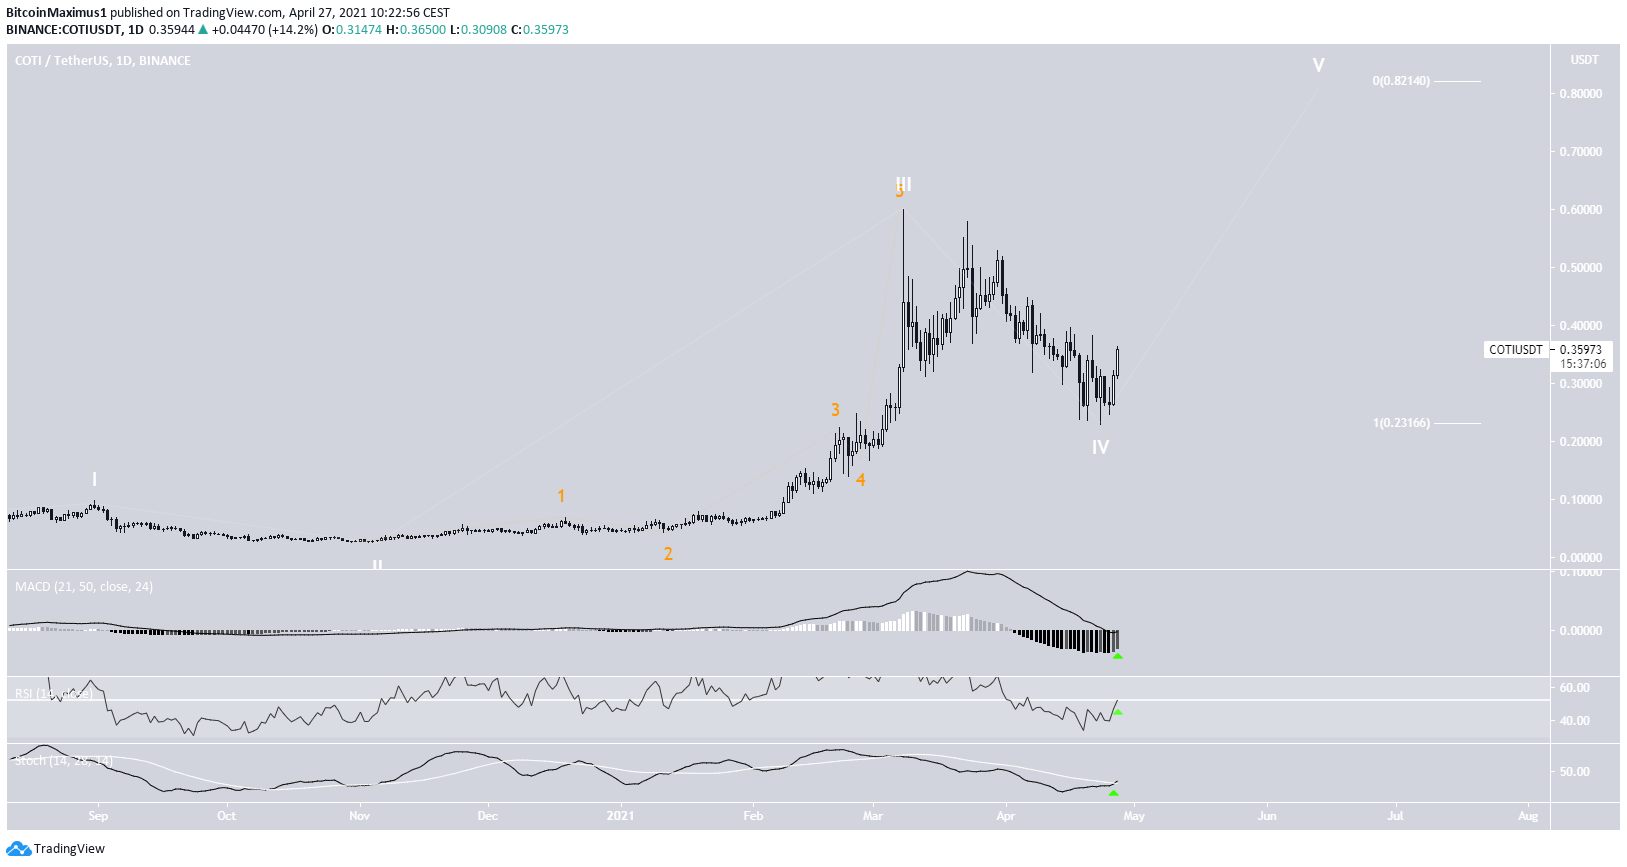
COTI
COTI has been moving downwards since March 8 when it reached an all-time high price of $0.60.
The decrease continued until a low of $0.23 was reached on April 23.
The wave count suggests that this was the end of wave four (white). If so, a potential target for the top of wave five is found at $0.82.
Technical indicators are turning bullish, supporting the possibility that the upward movement continues
For BeInCrypto’s latest bitcoin (BTC) analysis, click here.
