

Bitcoin (BTC) was rejected sharply yesterday and failed to break out from a descending resistance line that has been in place since March.
BTC has been falling underneath a descending resistance line since April 5. The line has caused numerous rejections which eventually led to the May 12 low.
More recently, the line caused a rejection on June 6. After the rejection, the price is in the process of creating a bearish engulfing candlestick.
An interesting development comes from the RSI. While the indicator generated bullish divergence (green line) right after the May 12 low, the trendline of the divergence is at risk of breaking down.
Also, this potential breakdown coincides with a breakdown from an ascending support line (dashed), which has been in place for the same amount of time.
If confirmed, it could lead to the acceleration of the downward movement.

Short-term BTC movement
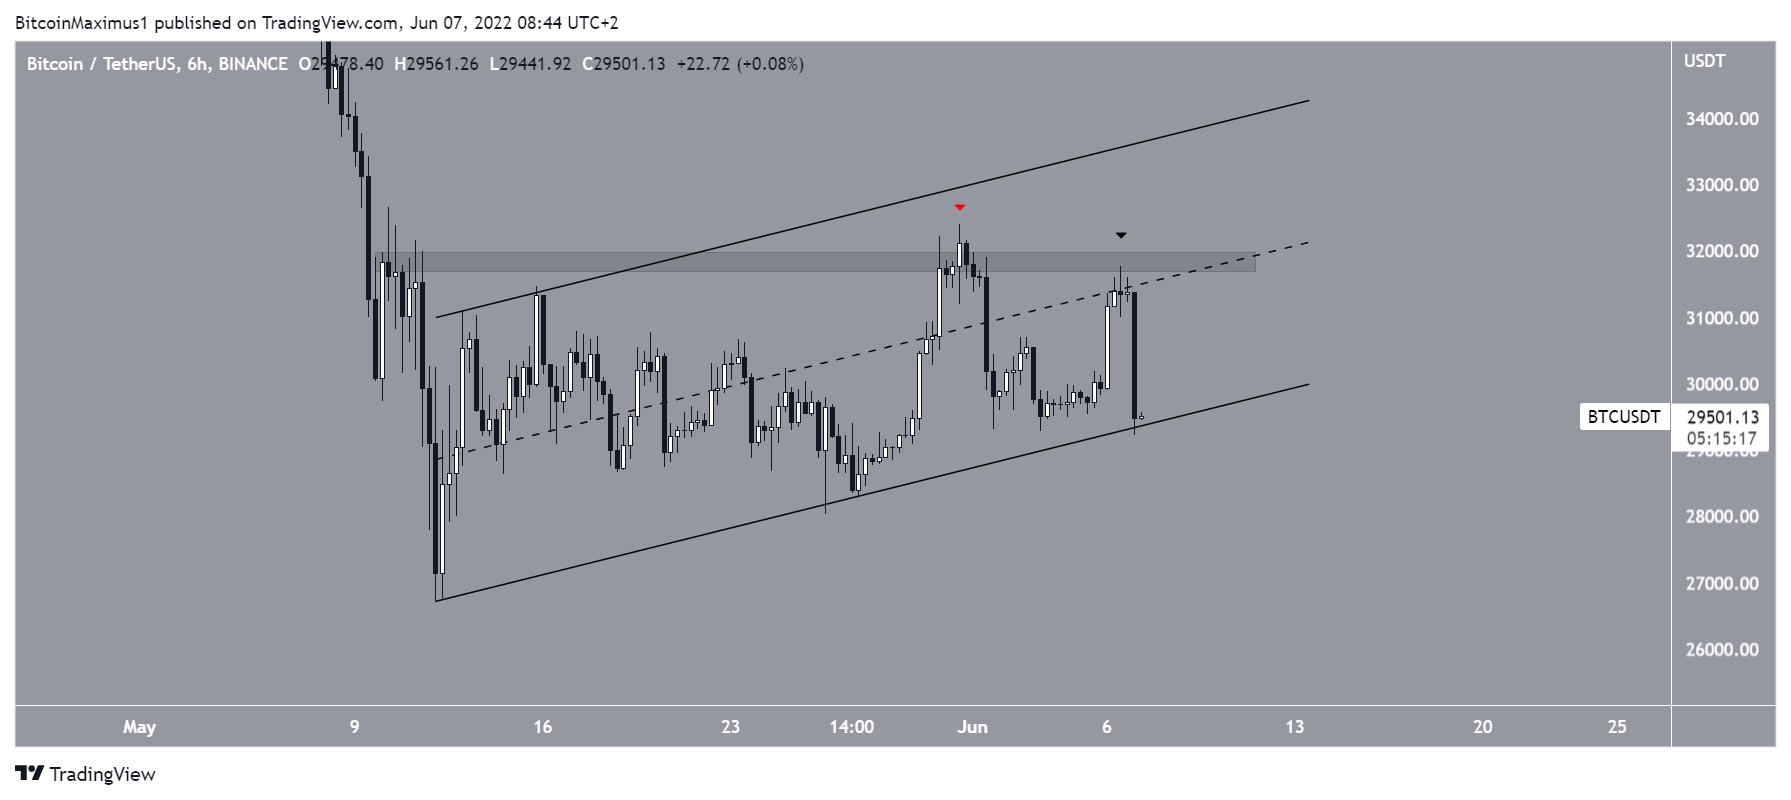
The six-hour chart shows that BTC has been increasing inside an ascending parallel channel since May 12. Such channels usually contain corrective structures, meaning that an eventual breakdown from them would be expected.
Besides the presence of the channel and the breakdown in the daily time frame, there are two more bearish signs.
Firstly, the price failed to reach the top of the channel on May 31 and fell below the $31,500 resistance area (red icon) afterward.
Secondly, the price was rejected by the middle of the channel and the $31,500 area once more on June 6 (black icon).
Wave count analysis
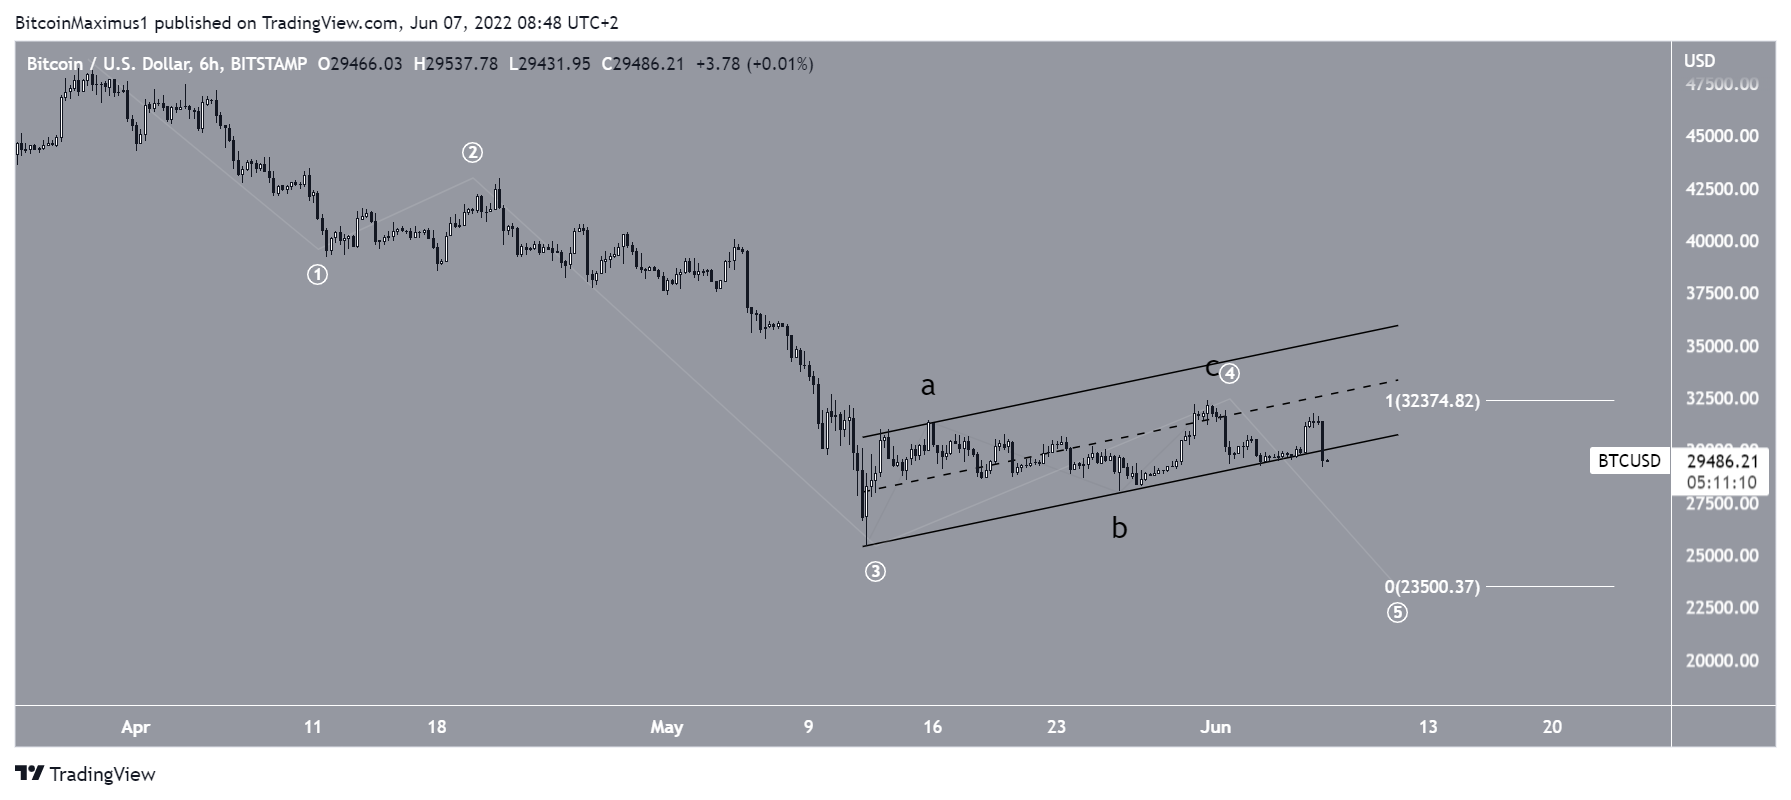
It is possible that the entire downward movement since March is part of a five-wave downward movement (white). If so, BTC is currently in the fifth and final wave of this decrease.
A potential target for the bottom of the movement would be at $23,500. The target is found by projection the length of wave one to the top of wave four.
For Be[in]Crypto’s previous bitcoin (BTC) analysis, click here
Disclaimer
In line with the Trust Project guidelines, this price analysis article is for informational purposes only and should not be considered financial or investment advice. BeInCrypto is committed to accurate, unbiased reporting, but market conditions are subject to change without notice. Always conduct your own research and consult with a professional before making any financial decisions. Please note that our Terms and Conditions, Privacy Policy, and Disclaimers have been updated.
