
Bitcoin (BTC) has been moving upwards since rebounding on June 22. It reached a local high of $34,881 the next day.
Whether it finds support at the current price level or gets rejected will likely determine the direction of the future trend.
BTC breaks down and bounces
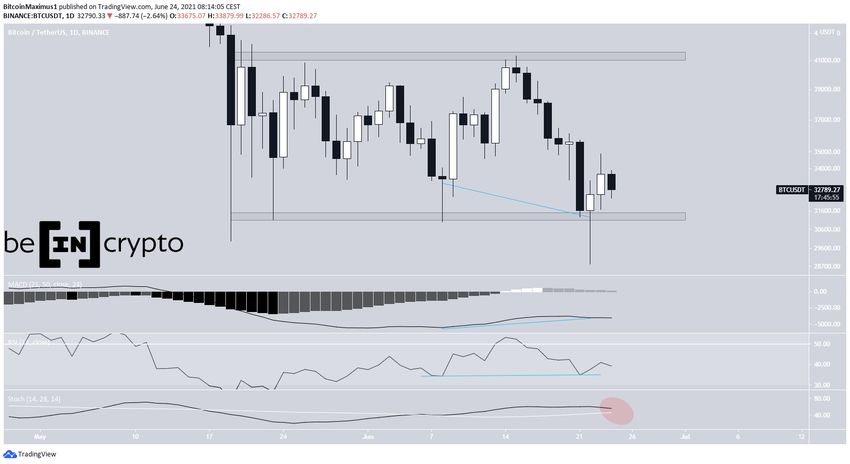
Bitcoin has been moving upwards since June 22 after reaching a local low of $28,805. The bounce that followed was preceded by bullish divergences in both the RSI and the MACD signal line (blue lines). The next day, BTC reached a high of $34,881.
However, it has been moving downwards since. While the bullish divergences have already played out, technical indicators are bearish. The MACD and RSI are both decreasing. The former is negative while the latter has fallen below 50. In addition to this, the Stochastic oscillator is very close to making a bearish cross (red circle).
The closest support and resistance levels are at $31,300 and $41,500.
Ongoing breakout
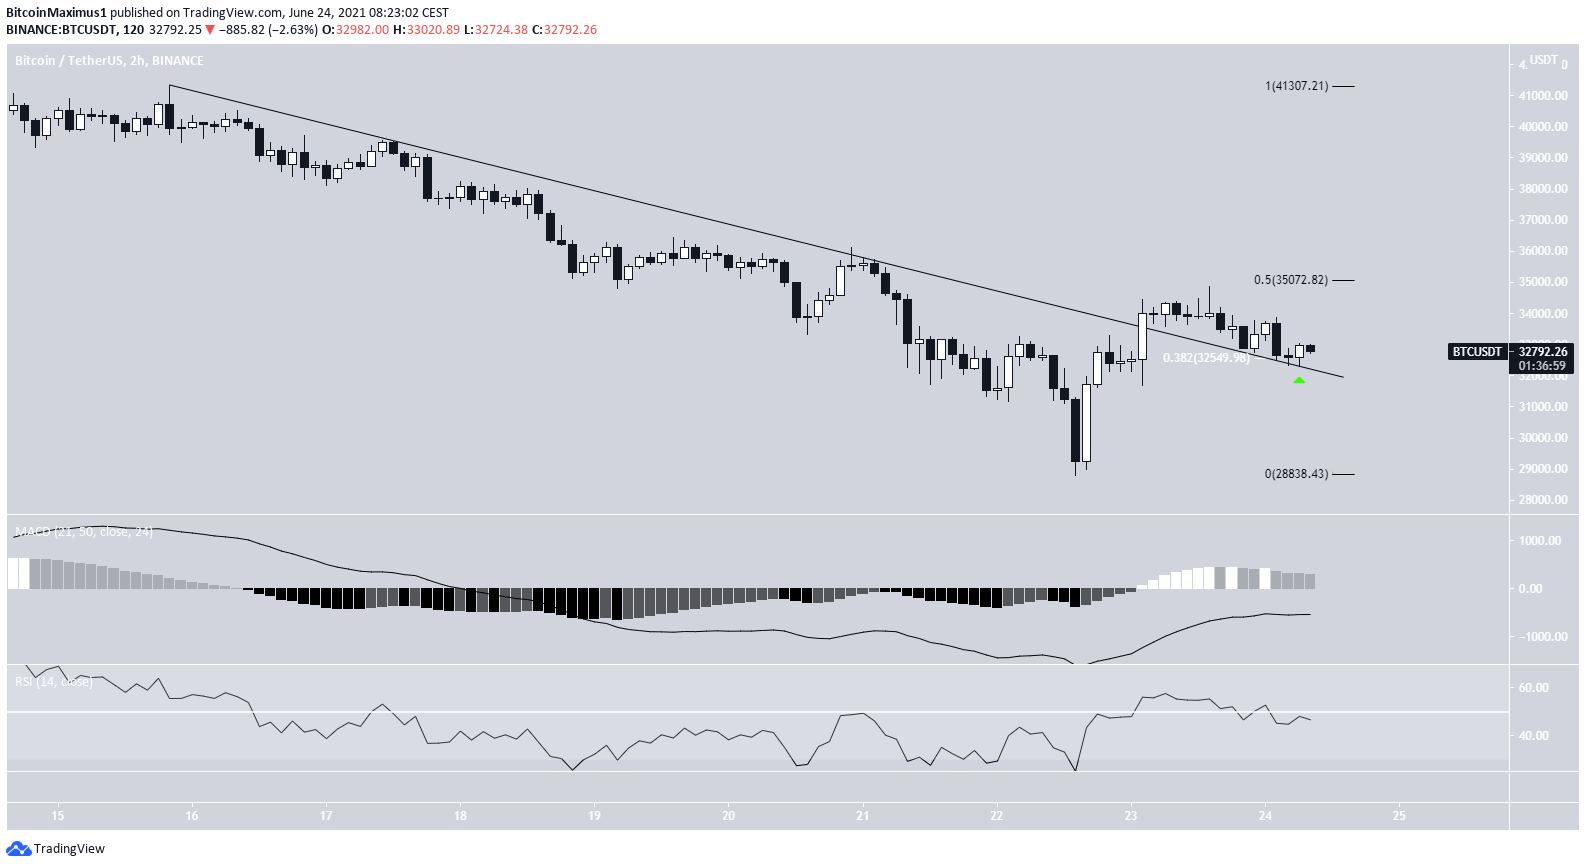
The two-hour chart shows that BTC has already broken out from a descending resistance line, which had previously been in place since June 15.
However, it was rejected by the 0.5 Fib retracement resistance level at $35,070.
Currently, BTC is in the process of validating the line as support (green icon). The line also coincides with the 0.382 Fib retracement support level (white)
Despite this, technical indicators do not show any bullish signs. The RSI has fallen below 50 and the MACD has given a bearish reversal signal.
Bullish or bearish?
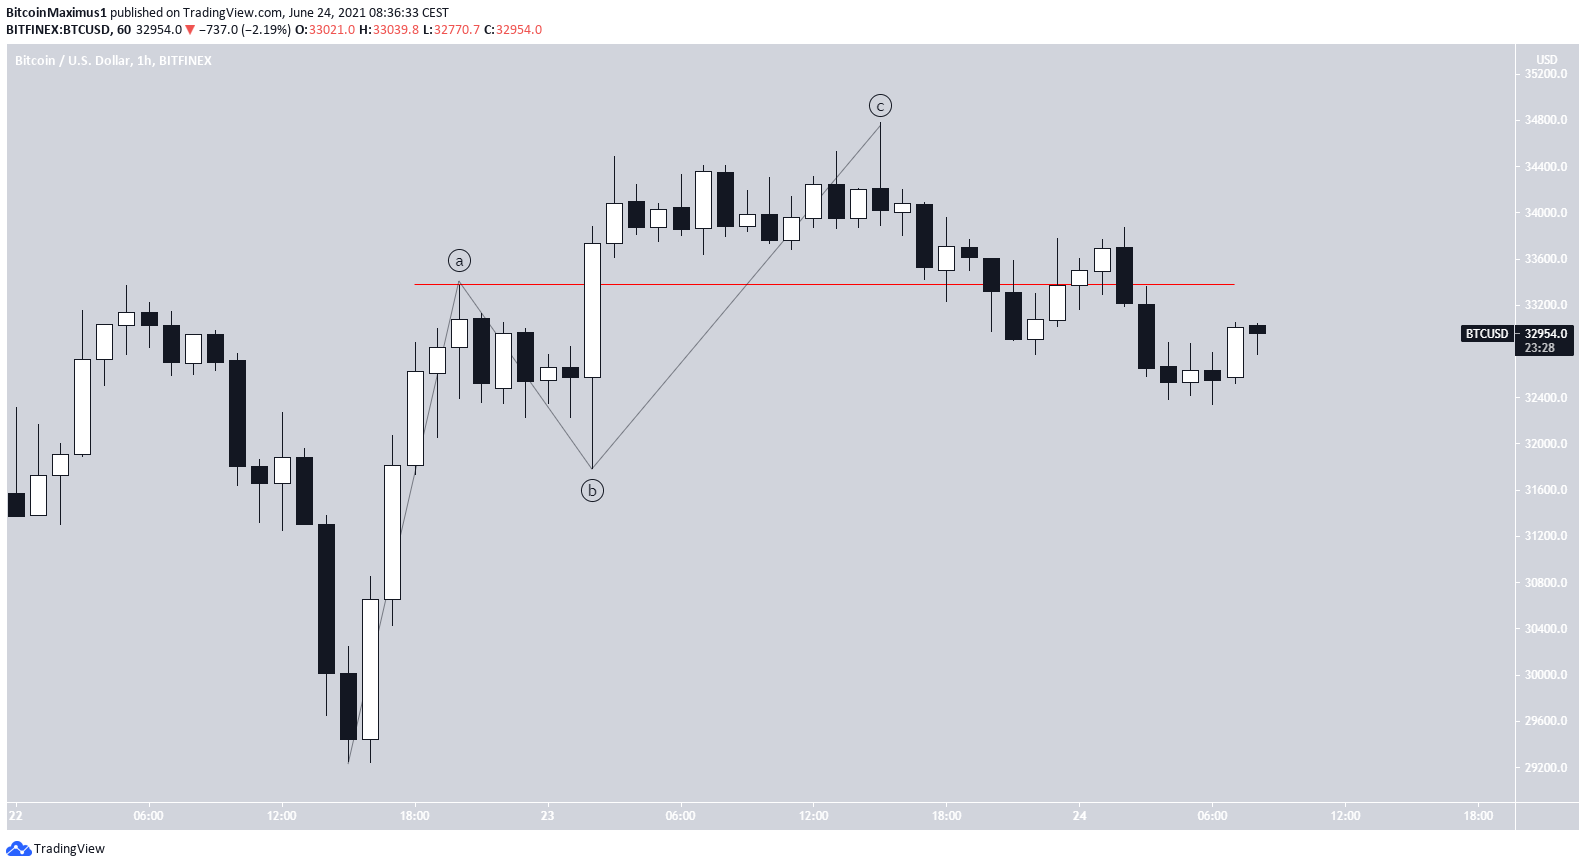
It’s not yet clear if the wave count is bullish or bearish. However, yesterday’s decrease below the $33,367 low (red line) suggests the latter. The increase from the lows looks to be a three-wave structure instead of a bullish impulse.
For that to be true, the ongoing decrease would have to be a 1-2/1-2 wave structure. Therefore, a sharp decrease would follow.
A move above the descending resistance line and the $33,869 high would suggest that this is not the case and the count is bullish instead.
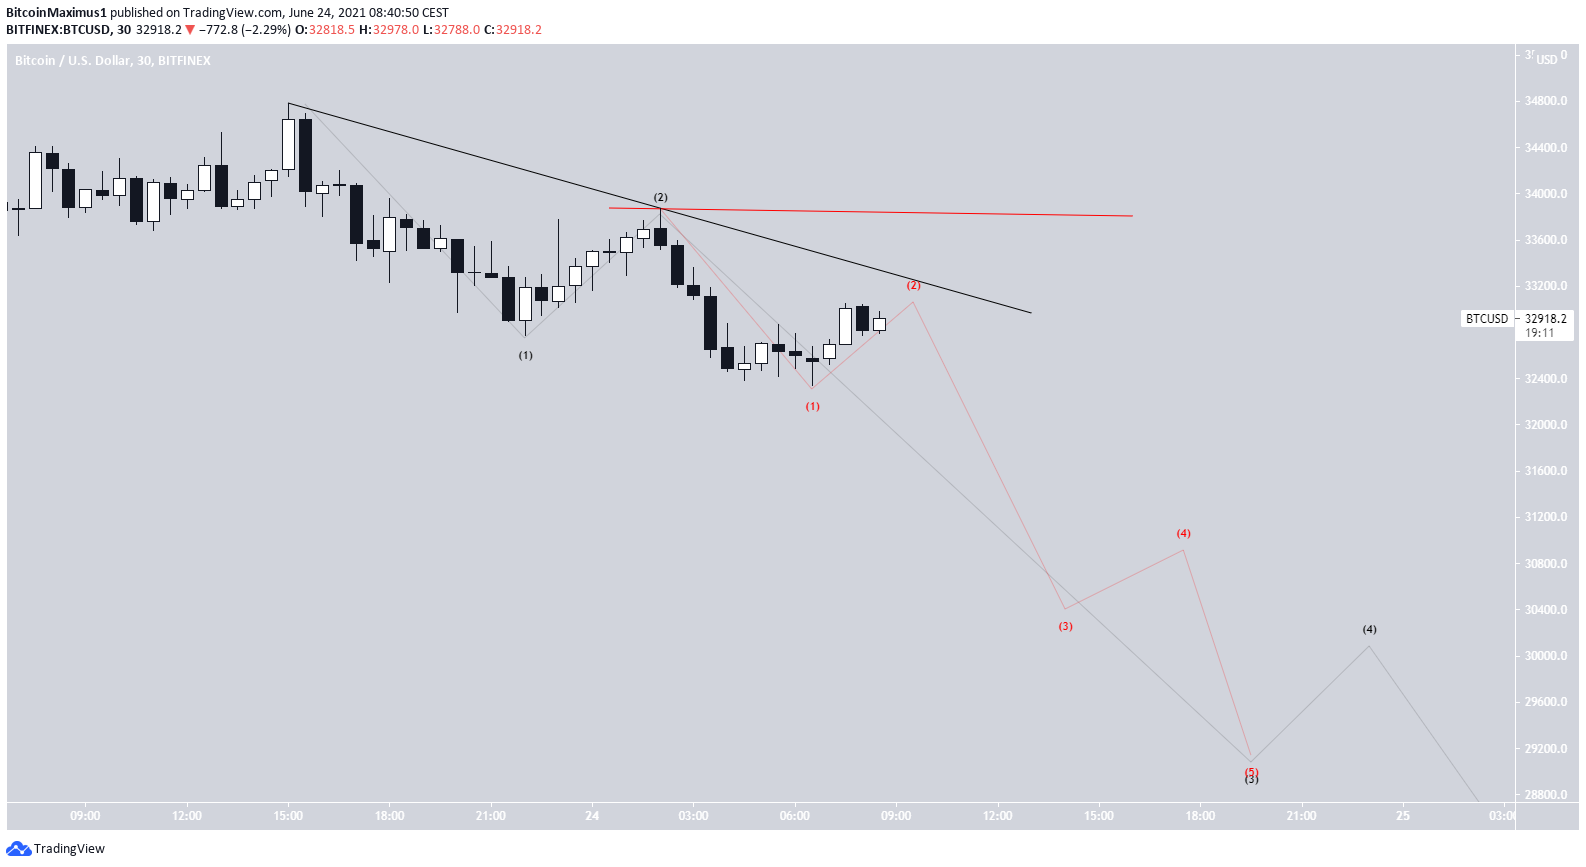
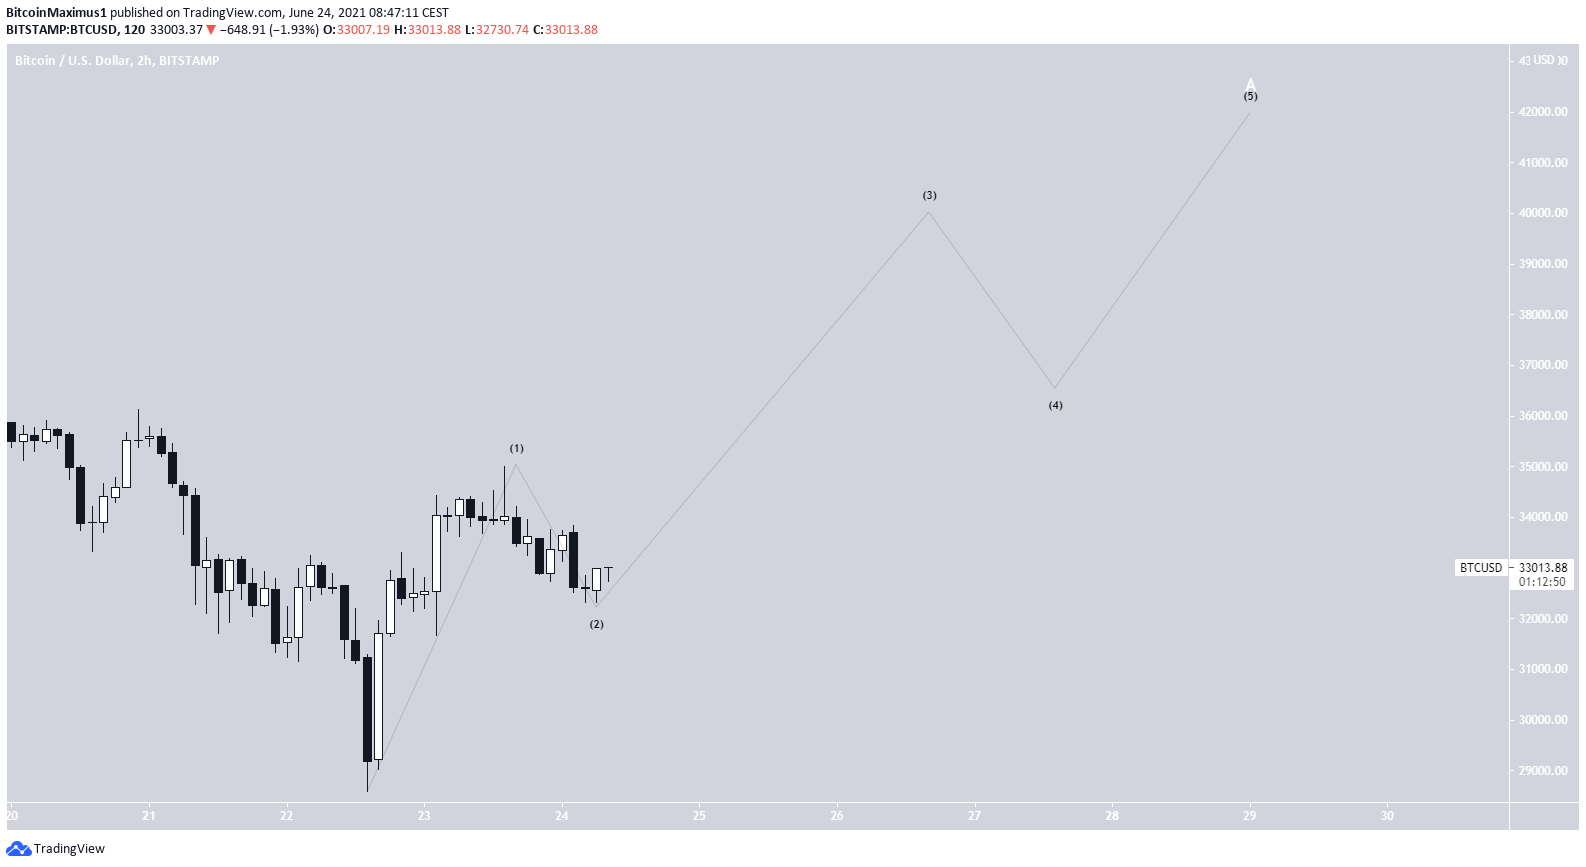
If BTC breaks out, it would likely mean that the current movement made up waves one and two (black) of a bullish impulse, that would complete a longer-term wave A (white).
Therefore, the movement in the next few hours is crucial in determining the direction of the trend.
For BeInCrypto’s latest bitcoin (BTC) analysis, click here.
