


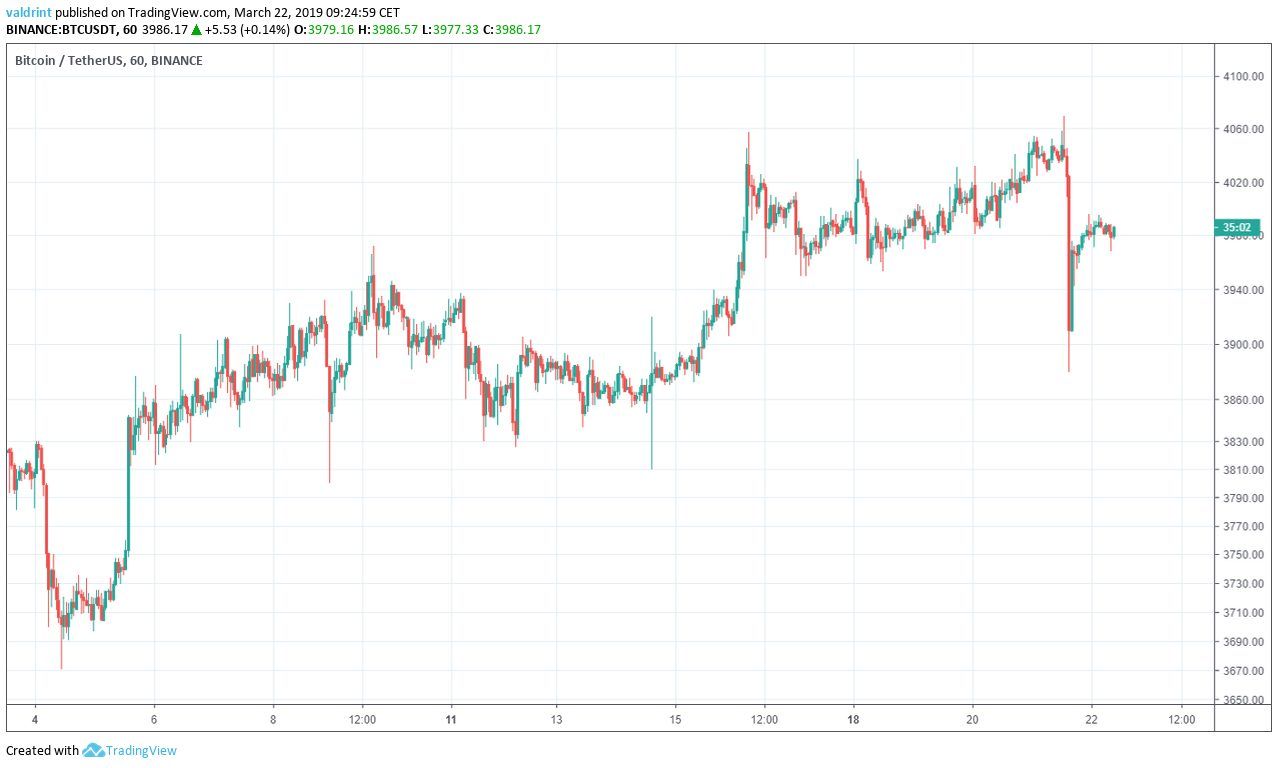
On March 4, 2019, Bitcoin (BTC) made a low of ₮3710. A gradual uptrend followed with volatility experienced along the way. It broke past the ₮4000 barrier several times reaching highs near ₮4060 on Mar 16 and 21 respectively.
On Mar 21, a rapid drop led prices back down to below ₮3900 in a matter of hours. Will the downtrend continue or will price bounce back to over ₮4000?
In our Mar 21 Bitcoin price analysis, we predicted the price losses that happened later in the day. In today’s analysis, we now predict continued decreases that will lead to the emergence of a new trading pattern—despite the minor recovery that is observable at the time of writing.
Bitcoin (BTC): Trends and Highlights For March 22, 2019
- The price of Bitcoin has been on an uptrend since Mar 4.
- BTC had been trading inside an ascending channel before breaking down on Mar 22.
- The breakdown occurred with above-average volume.
- It was preceded by a MACD and SMA sell signal.
- There are support areas near ₮3970, ₮3840 and ₮3720.
- There is resistance near ₮4160.
Previous Breakdown
The price of BTC on Binance is analyzed at 15-minute intervals from Mar 19 to Mar 22.
Bitcoin reached a high of ₮4031 on Mar 20. A sharp drop ensued followed by a gradual increase. Every high has been higher than the previous one. Tracing these highs gives us an ascending resistance line.
A low of ₮3985.50 was also reached on Mar 20. Gradual upward movement followed with each Every low has been higher than the previous one. Tracing these lows gives us an ascending support line.
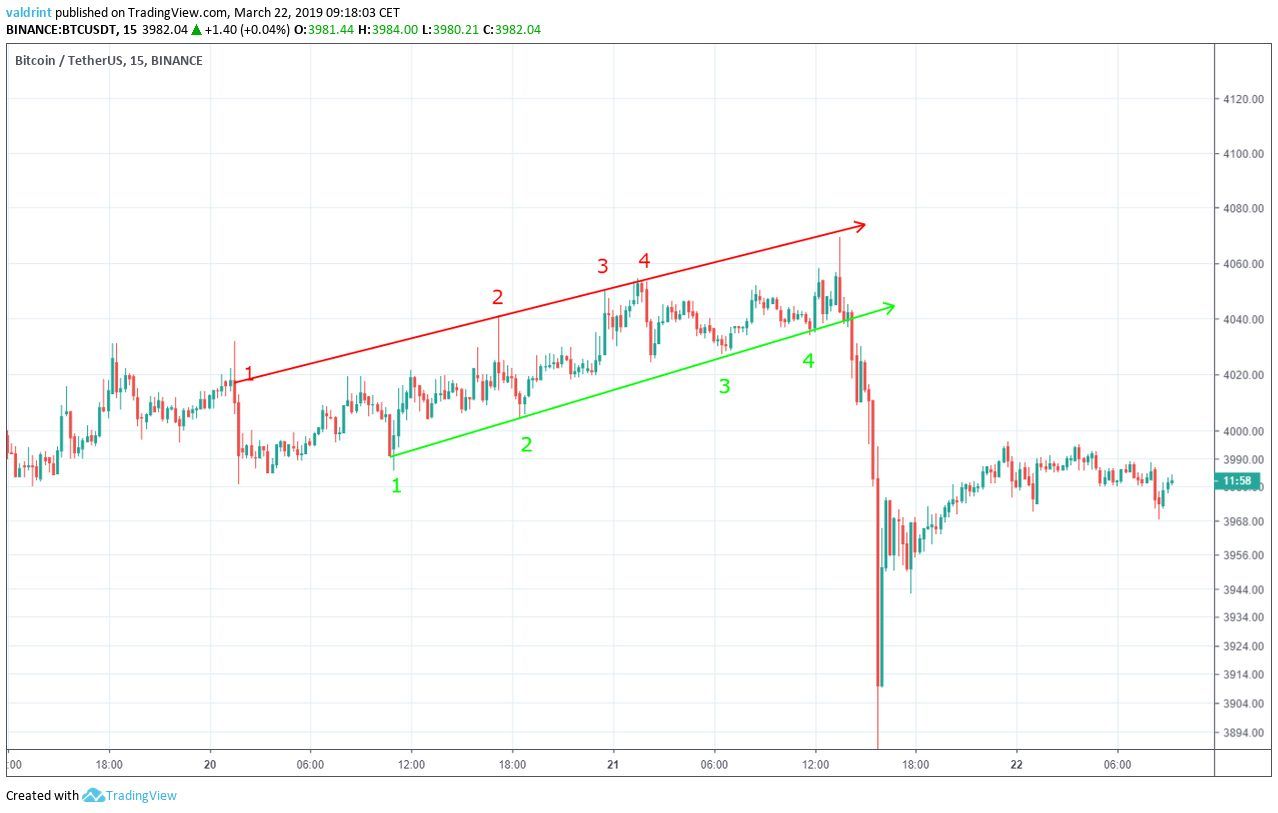
The resistance and support lines combine to create an ascending channel. It theoretically defines the upper and lower limits of price over a period of time. However, breakouts above resistance or breakdowns below support invalidate the accuracy of this pattern.
Bitcoin experienced a significant breakdown on Mar 21 with rapid and significant price drops following. After reaching a bottom, the price has begun to increase. However, the price of BTC at the time of writing is still significantly lower than the support traced.
At this point, this channel has been invalidated. New support and resistance are likely to generate a new trading pattern below the support line traced on the graph above.
Long-Term View
To better predict future price movements, we analyze the price of BTC on Binance on one-hour intervals from Mar 4 to Mar 22.
The price made a low of ₮3710 on Mar 4. A sharp upward move followed with gradual price increases. Several market cycles have been completed since, with each low being higher than the preceding one. Tracing these lows gives us an ascending line.
On Mar 16, the price made a high of ₮3907. Several market cycles have been completed since, with each high being higher than the preceding one. Tracing these highs gives us an ascending resistance line.
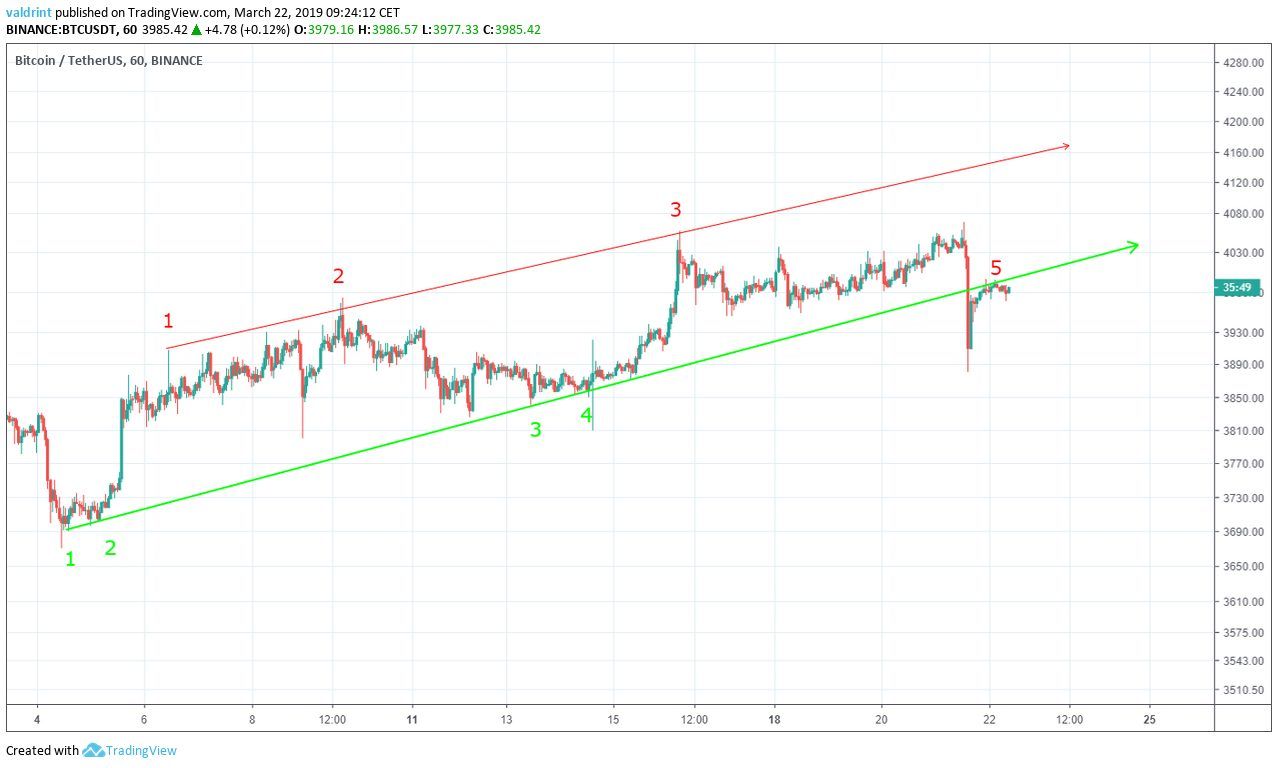
The breakdown on Mar 21 causing prices to sink below the support traced here. This means that both long-term and short-term support has been broken. However, prices are trading much closer to this support than the one defined for the period Mar 19-21.
The price may continue to decrease and create new resistance and support areas. However, if BTC is able to rise above the channel, this might prove to be a false breakdown and price may continue trading along the upward trend suggested by the channel.
Testing The Validity
As illustrated in our previous analysis, both breakouts and breakdowns can be false.
In order to test the validity of the breakdown, we are going to take a closer look at the outlined period from Mar 21 to Mar 22.
Volume is a measure of how much of a certain asset is traded in a certain period of time. Combined with breakouts and breakdowns, it can be used as a confirmation tool for the validity of a movement.
The moving average convergence divergence (MACD) is a trend indicator that shows the relationship between two moving averages (long and short-term) and the price. It is used to measure the strength of a move.
Combined with simple moving averages (SMA), MACD can be used as a trigger for buy and sell signals. Signals are triggered whenever the MACD line is above 0 and the price is above the 21 (red) and 50-period (green) SMAs.
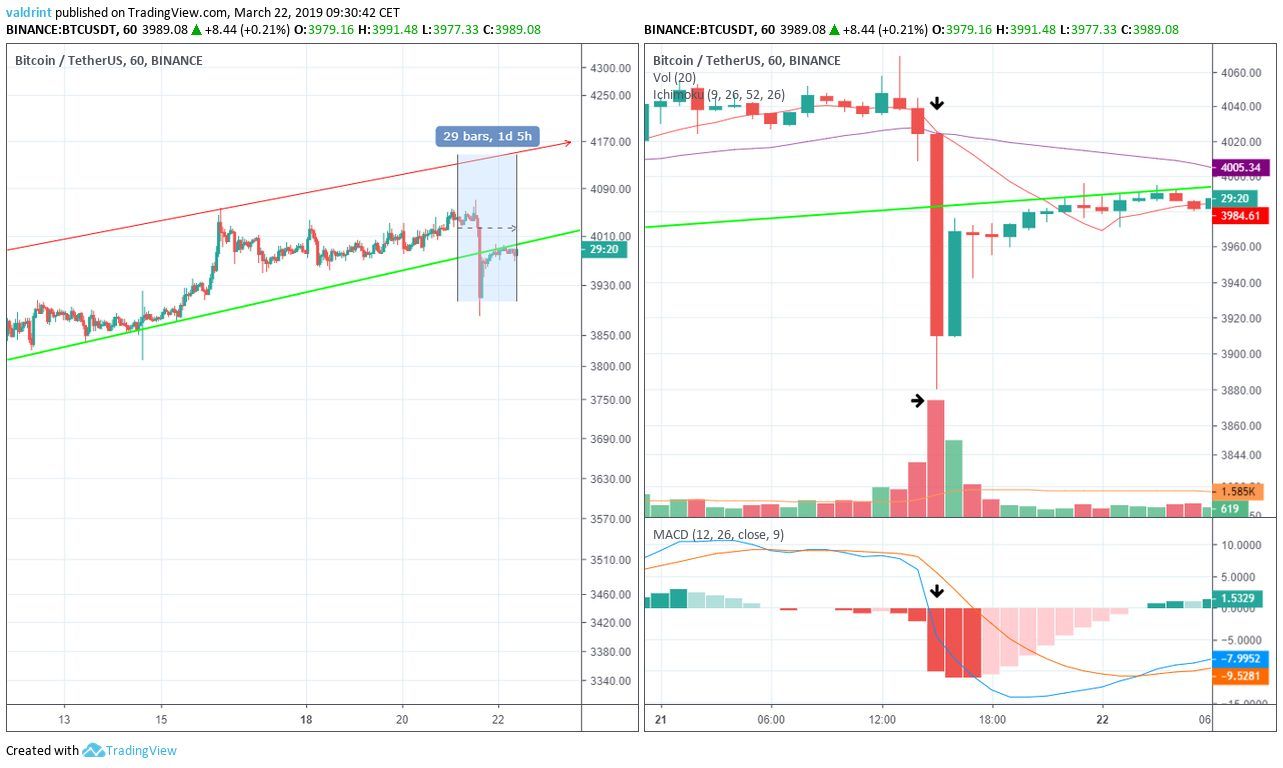
On Mar 21, the price initiated a rapid downward move. In a one hour interval, the price dropped from $4024 to ₮3880, a 3.56% drop.
During the same time, the 10-period MA crossed below the 30-period one. Similarly, the MACD line crossed below 0. This would have triggered a sell signal, indicating that a new downtrend may have begun.
Furthermore, we can see that the breakdown occurred on above-average volume, increasing the likelihood that this was not a false breakdown.
Using these indicators, we can conclude that the breakdown was genuine, and further decreases are in store for the future.
Reversal Areas
In order to better determine possible future levels of resistance and support, the price of BTC on Binance is analyzed at two-hour intervals from Feb 23 to Mar 21.
Resistance and support areas are created when the price visits the same level several times.
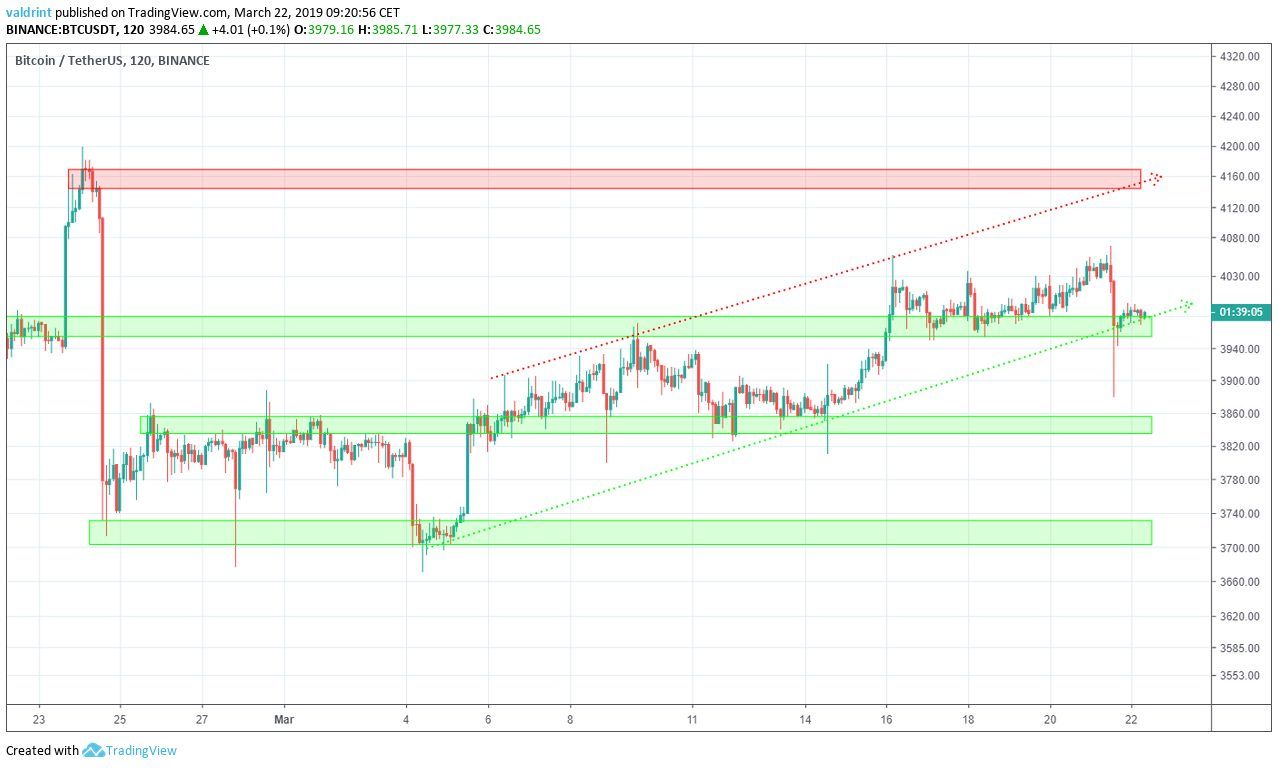
Price is currently trading at the first support area at ₮3970. There are other support areas near ₮3850 and ₮3720. If prices continue to decrease, they are likely to provide reversal areas. Based on our analysis, this is likely to occur.
Conversely, the closest resistance area is found near ₮4160. It coincides with the resistance line of the channel. If the price rebounds and initiates an uptrend, this area will provide a likely reversal. Based on our analysis, this price is not likely to be reached in the near future.
Summary of Analysis
Based on this analysis, the price of BTC is likely to keep decreasing until it creates new resistance and support areas. If the price reaches the second support area, this prediction will be fully validated. Further price increase or a return above support would invalidate the prediction.
Where do you think BTC will make a bottom? Let us know your thoughts in the comments below.
Disclaimer: This article is not trading advice and should not be construed as such. Always consult a trained financial professional before investing in cryptocurrencies, as the market is particularly volatile.


