


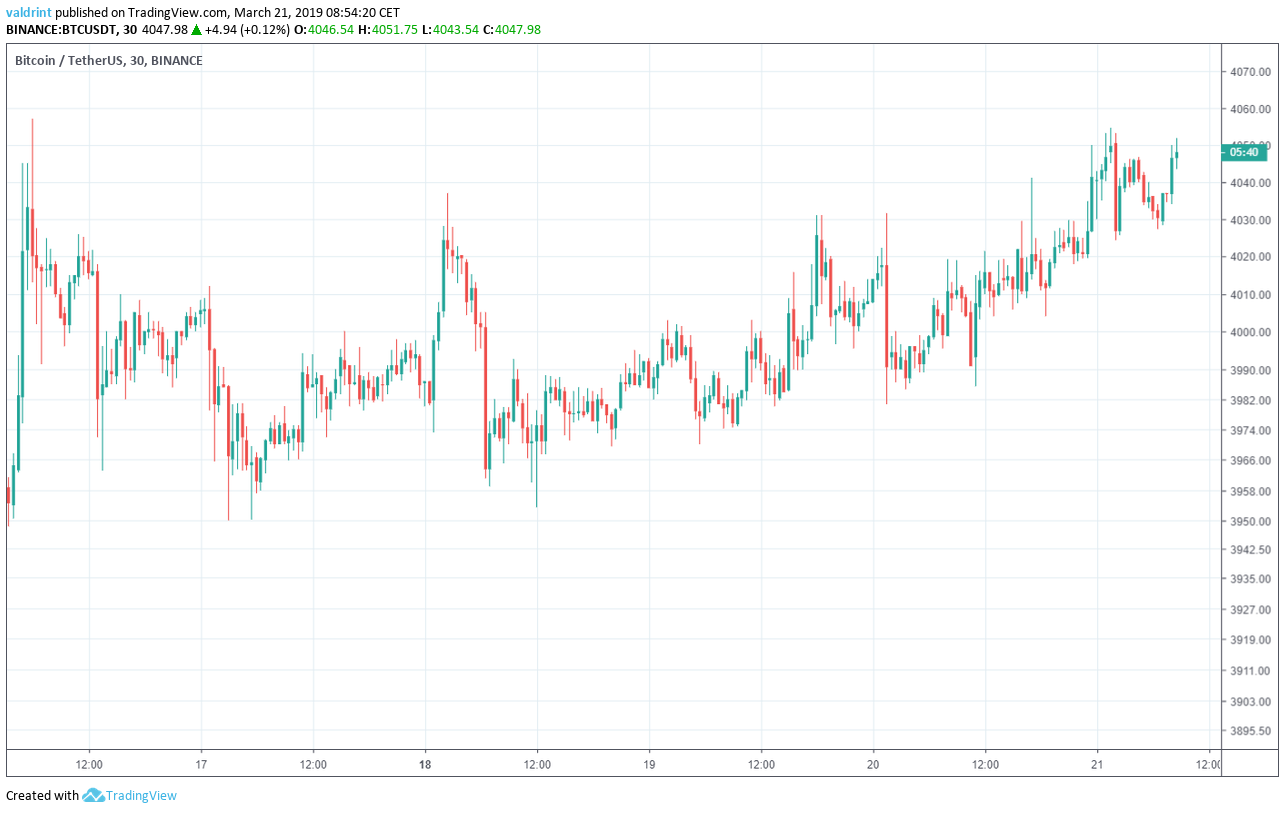
On March 16, 2019, Bitcoin (BTC) rose past the ₮4000 barrier. A gradual downtrend followed bringing BTC below ₮4000 the following day. Subsequent volatility resulted in BTC trading around the ₮4000 range.
On Mar 21, Bitcoin, however, soared past the ₮4000 with highs over ₮4050 made at the time of writing.
Will the price of Bitcoin keep going higher? How much longer before BTC hits ₮5000 again?
In our Mar 20 Bitcoin price analysis, we successfully predicted this upward movement. In today’s analysis, we are predicting that slight price decreases may be expected within the next several days.
Bitcoin (BTC): Trends and Highlights For March 21, 2019
- The price of Bitcoin has been on an uptrend since Mar 17.
- BTC broke out of a short-term ascending triangle.
- The breakout occurred in less than average volume.
- It is trading inside both a short and long-term ascending channel.
- There are support areas near ₮3970, ₮3840 and ₮3720.
- There is resistance near ₮4160.
Previous Breakout
The price of BTC on Binance is analyzed at thirty-minute intervals from Mar 16 to Mar 21.
The price made a low of ₮3950 on Mar 17. A steady upward move followed by a flash crash ensued. The succeeding low was higher than the one on Mar 17. Since then, Bitcoin has consistently created higher lows.
Tracing these lows gives us an ascending support line. The support line acts as a floor to price, preventing further downward movement. It also gauges the general growth trend of an asset.
The price reached a high of ₮4037 on Mar 18. A sharp drop ensued. On Mar 16, BTC reached ₮4024. While the original high was not reached again, the ₮4024 level has been revisited several times since.
Tracing these highs gives us a horizontal resistance line. Similar to the support line, the horizontal resistance line can act as a ceiling to price, preventing further upward movement. It traces the theoretical upper limits of the price.
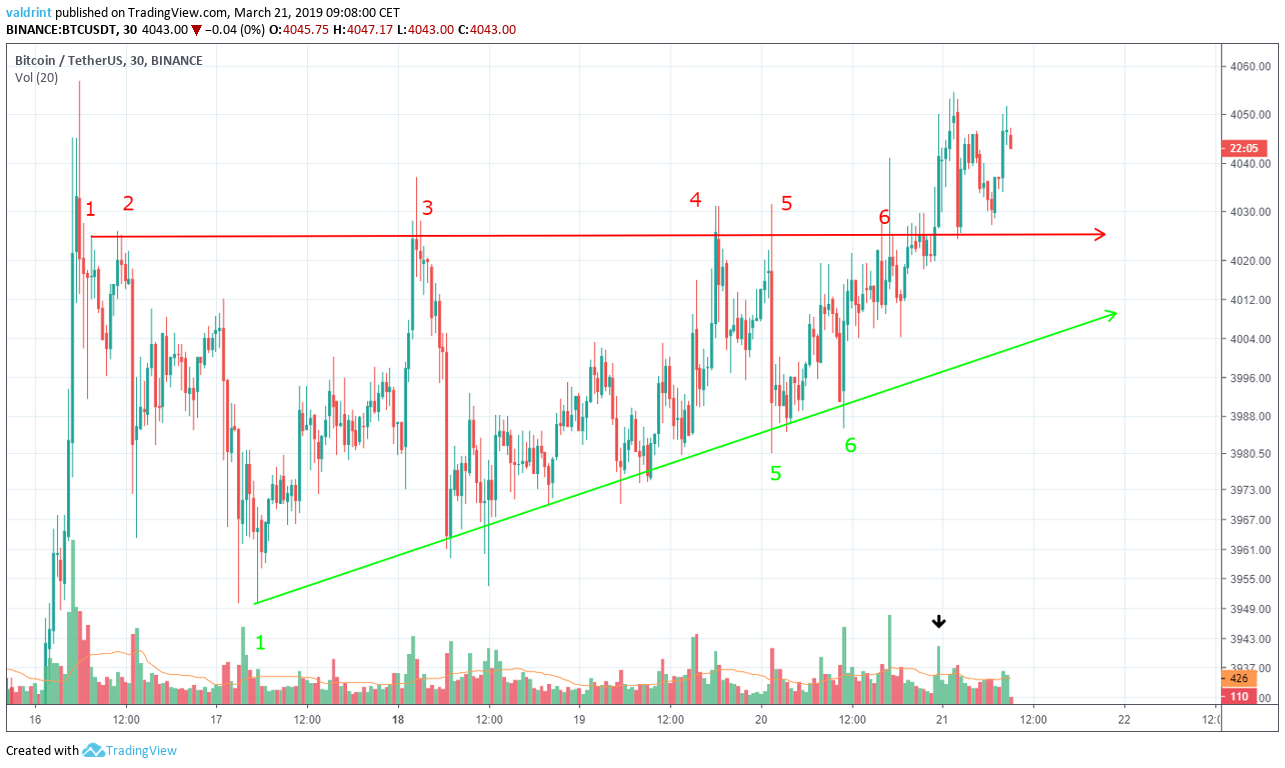
The support and resistance lines combine to create an ascending triangle. This is a bullish pattern. It suggests that price increases are more likely than decrease—which is exactly what we have seen.
The triangle is a better predictor of price fluctuations than resistance and support lines alone. Resistance is currently a bad indicator of future price levels because the price has exceeded the line. Such breakouts often indicate rapid price increases—which we are also seeing.
If growth continues beyond the resistance, a new upward facing resistance may be created. Currently, the support appears valid, which suggests that an upward moving horizontal triangle or parallel channel may be developing. These would define new confines for the price of Bitcoin along this current uptrend.
However, price decreases might bring the price back below resistance. New support and resistance are still likely to be generated based on the deviation from the current trading pattern in either case.
About Volume
Volume is a measure of how much of a certain asset is traded in a certain period of time. Combined with breakouts and breakdowns, it can be used as a confirmation tool for the validity of a movement.
We can see that the breakout occurred on below-average volume. Therefore, it is possible that this was a false breakout and that price may soon decrease below the resistance line.
Ascending Support
To better predict future price fluctuations, we define resistance and support lines at 15 minute intervals between Mar 20 to Mar 21 using Binance. First, we begin by defining support:
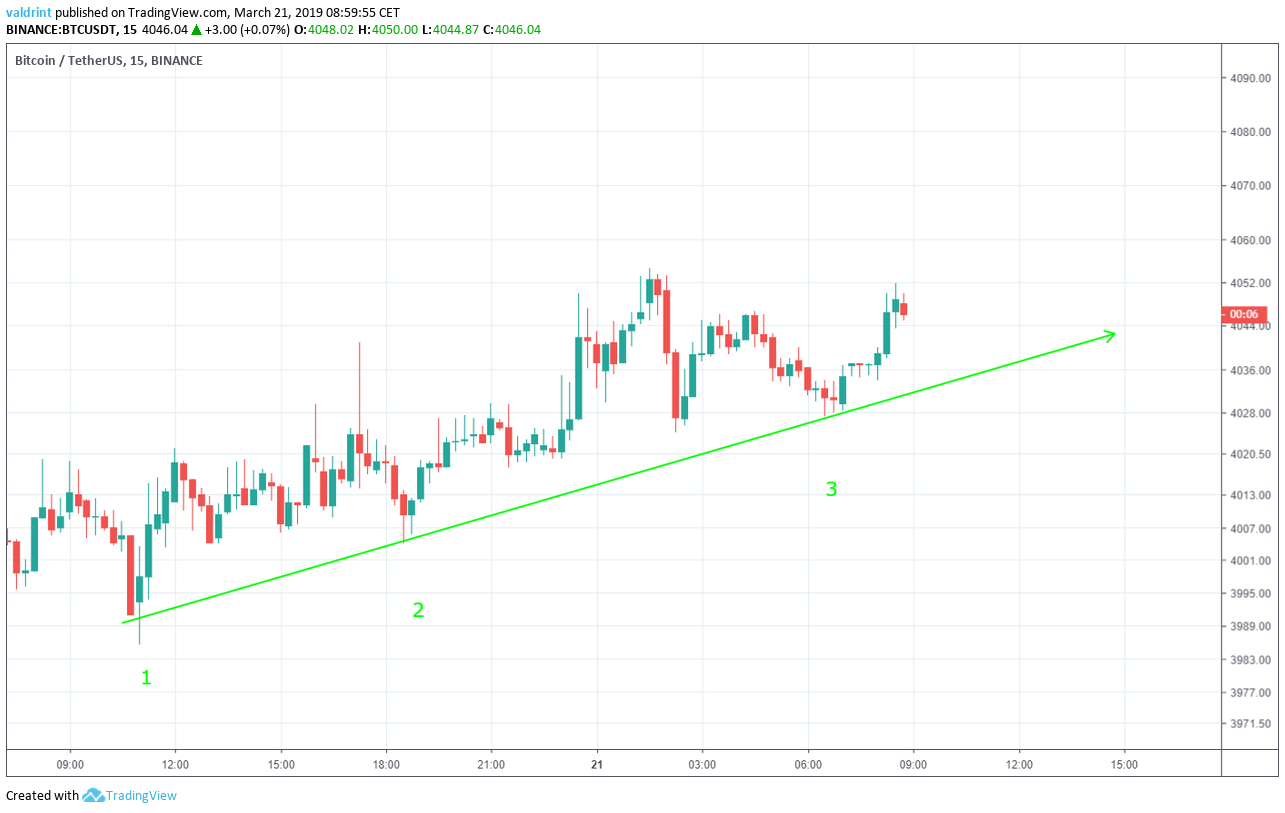
On Mar 20, the price made a low of ₮3985.5. A gradual upward move ensued. Every low has been higher than the preceding one. Tracing these lows gives us an ascending support line.
The support line acts as a floor to price, preventing further downward movement. It also measures the price rate of increase. The price has been increasing at the same rate as predicted by the line.
The price may continue to increase at the rate predicted by the ascending support line. If the current breakout is not false, this support may prove valid. We must wait to see if prices drop in the near future before we can ascertain whether the support is valid.
Ascending Channel
The price made a high of $4019.3 on Mar 20. A sharp drop ensued, followed by a gradual increase. Price made several higher highs since. Tracing these highs gives us an ascending resistance line.
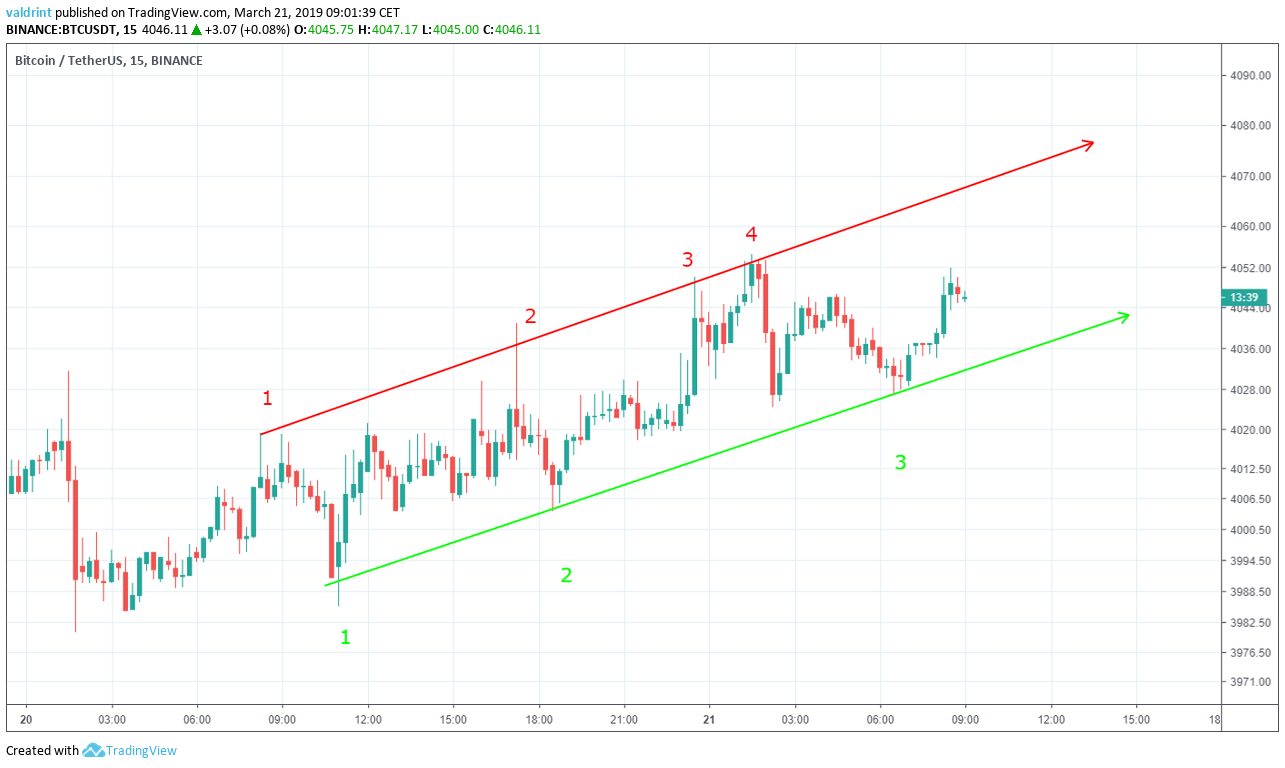
Similar to the support line, the resistance line acts as a ceiling to price, preventing further upward movement. It traces the theoretical upper limits of an asset.
The resistance and support lines combine to create an ascending channel. Price is expected to trade within this channel—meaning that price increases are to be expected.
We cannot determine based on the channel if or when a breakout or breakdown will occur.
A breakdown below support would signify (a) that the breakout on Mar 21 may have been false—especially if the price falls below the resistance defined for Mar 16-21—and (b) price decreases may be expected following the initial decline.
A breakout, however, would signify continued price increases. These increases might even accelerate significantly over a short period.
Reversal Areas
In order to better determine possible future levels of resistance and support, the price of BTC on Binance is analyzed at two-hour intervals from Feb 23 to Mar 21.
Resistance and support areas are created when the price visits the same level several times.
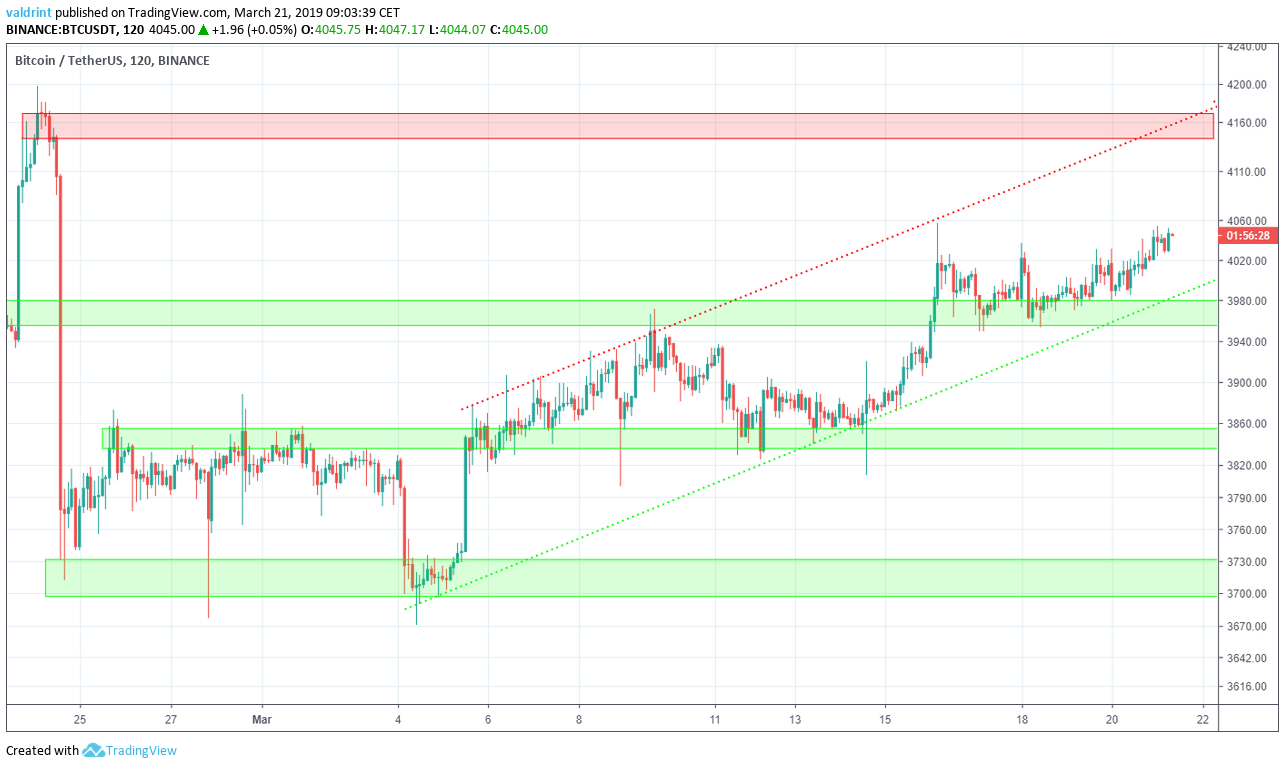
Price is currently trading above the first support area at $3970. The area previously served as resistance, rejecting the price on Mar 9. However, it turned to support after the Mar 16 breakout.
We can also see that the price has been trading inside an ascending channel since Mar 4.
Other support areas are found near $3860 and $3720. If the price breaks down from the channel, these two would provide likely reversal areas. Based on our analysis, it is not likely that the price reaches the 2nd and 3rd support areas. However, it is possible that the price falls down to the support line, which is slightly above the first support area.
Conversely, the closest resistance area is found near $4160. It coincides with the resistance line of the channel. If the price breaks out, this area would provide a likely reversal. Based on our analysis, this price is not likely to be reached in the near future. Price will likely return to around the $4000 range and continue trading there for some time following a decline.
Summary of Analysis
Based on this analysis, the price of BTC is likely to move inside the confines of the short-term ascending channel until a breakdown occurs. If the price breaks down from the short-term channel, this prediction will be partially validated. If it keeps falling to the support line of the long-term channel, it will be fully validated. The prediction would be invalidated by a breakout above the channel.
Do you think BTC will breakdown from the channel? Let us know your thoughts in the comments below.
Disclaimer: This article is not trading advice and should not be construed as such. Always consult a trained financial professional before investing in cryptocurrencies, as the market is particularly volatile.


