


On March 16, 2019, Bitcoin (BTC) pushed past the ₮4000 barrier. It has been on a gradual downtrend since. We predicted these price increases in our March 15 analysis of Bitcoin.
Here is a look at the prices in the period from Mar 16 to Mar 19:
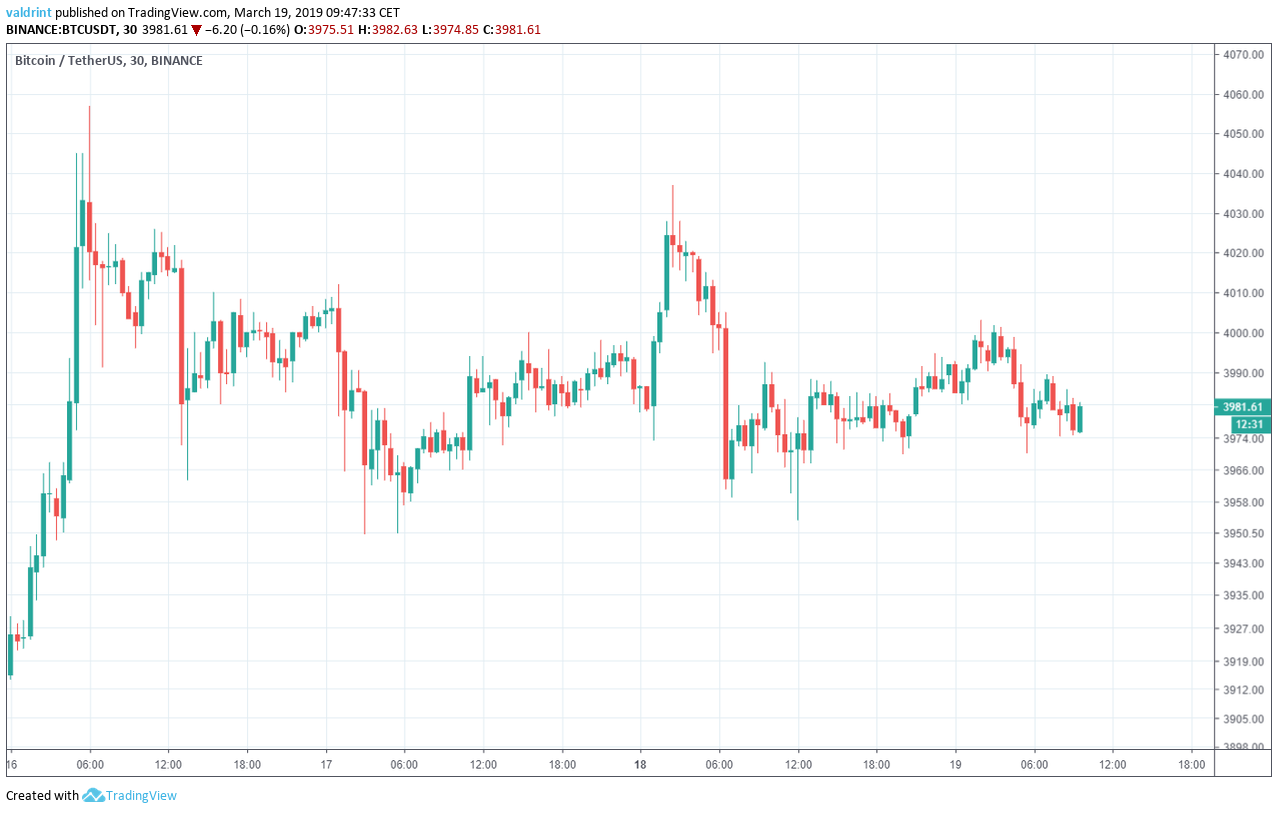
In our Mar 18 analysis, we predicted that there will not be significant fluctuations in price. Since then, it has traded near the same level and has not experienced. These predictions, too, appear validated.
Based on today’s analysis, we again predict that significant fluctuations are still very likely to occur. However, we believe that BTC may soon breakout past ₮4000 again.
Bitcoin: Trends and Highlights For March 19, 2019
- The price of Bitcoin has been on a downtrend since Mar 16.
- BTC is trading inside a short-term symmetrical and long-term ascending channel.
- There are support areas near ₮3970, ₮3840 and ₮3720.
- There is resistance near ₮4160.
Ascending Support
The price of BTC on Binance is analyzed at fifteen-minute intervals from Mar 16 to Mar 19.
The price made a low of ₮3950 on Mar 17. A rapid upward move followed by a flash crash ensued. The succeeding low was higher than the one on Mar 17. Price continued to make higher lows since.
Tracing these lows gives us an ascending support line.
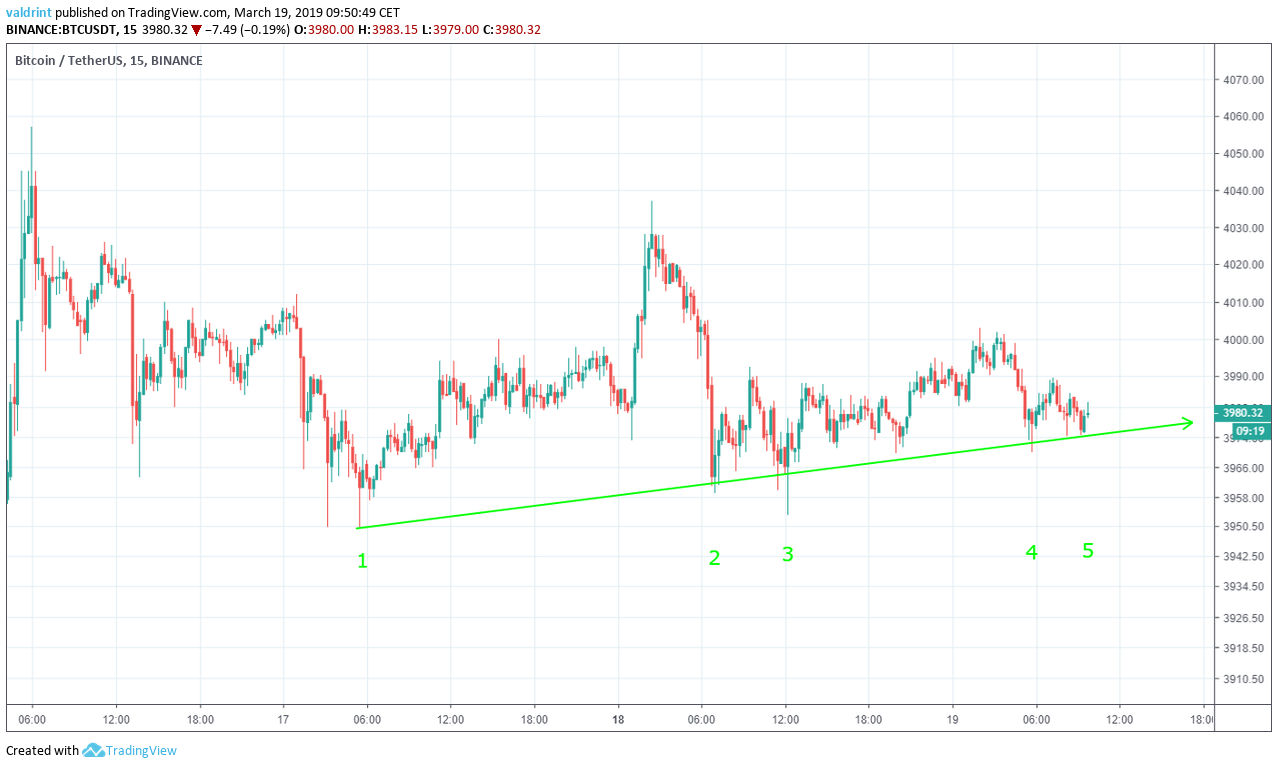
The support line acts as a floor to price, preventing further downward movement.
Wick breakdowns such as the ones on Mar 18 can be considered insignificant if they are not sustained by continuous movement below the line. In the case of BTC, the price immediately rebounded above the support line following these lows. Thus, the lows below support can be considered insignificant.
Movement below this line is not likely unless a break down occurs. The support line alone is not sufficient in estimating if a break down will occur.
Symmetrical Triangle
The price reached a high of ₮4037 on Mar 18. A sharp drop ensued. Afterward, the price made consecutively lower highs. Tracing these highs gives us a descending resistance line.
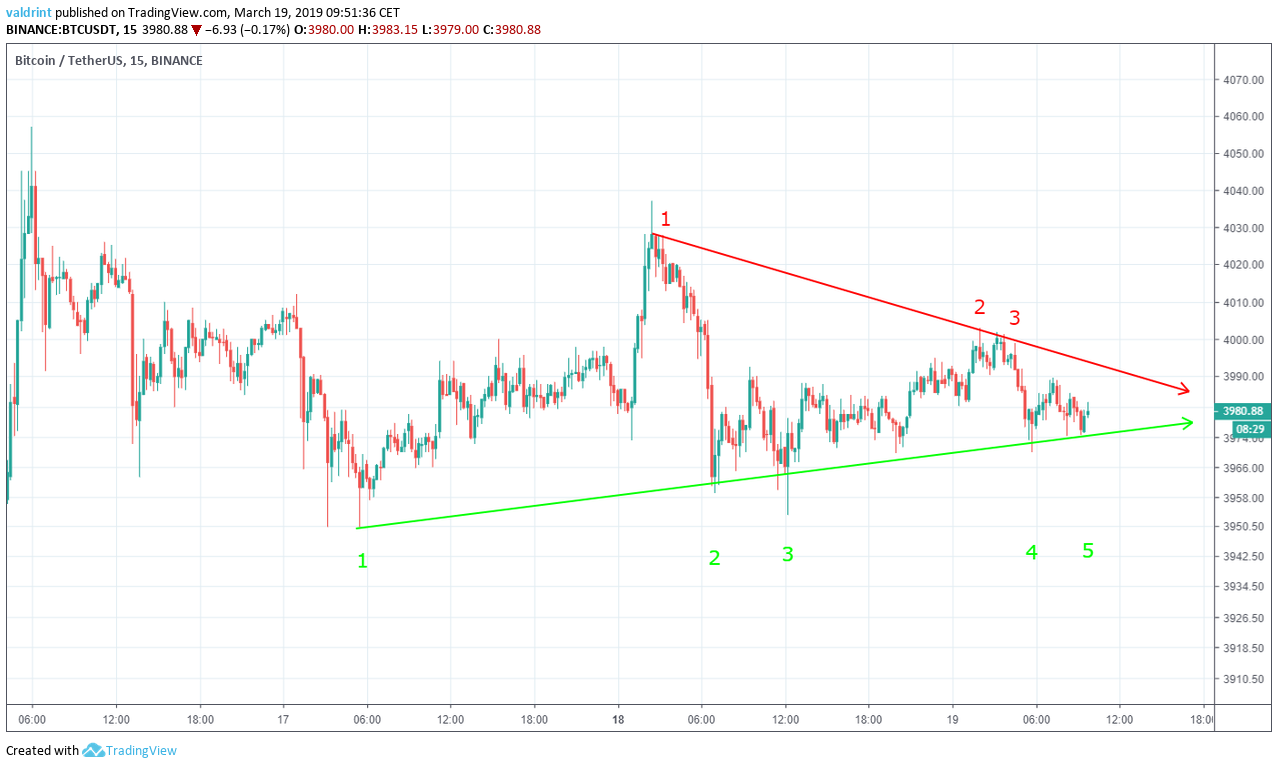
Similar to the support line, the horizontal resistance line can act as a ceiling to price, preventing further upward movement. It traces the theoretical upper limits of the price.
The support and resistance lines combine to create a symmetrical triangle, which is a neutral pattern, making price increases and decreases equally likely. It is a better predictor of price fluctuations than resistance and support lines alone.
It is unlikely that the price will move outside the confines of the triangle for at least the short term. A breakout or breakdown may occur at some point.
This triangle, however, does not indicate if either will occur nor can it tell us when. Even though the channel can predict price fluctuations, it is not sufficient in predicting when a decisive upward or downward movement will occur.
Ascending Triangle
Combining MACD and RSI bullish/bearish divergence with support/resistance essentially predicts price fluctuations.
The moving average convergence divergence (MACD) is a trend indicator that shows the relationship between two moving averages (long and short-term) and the price. It is used to measure the strength of a move. The relative strength index (RSI) is an indicator which calculates the size of the changes in price in order to determine oversold or overbought conditions in the market.
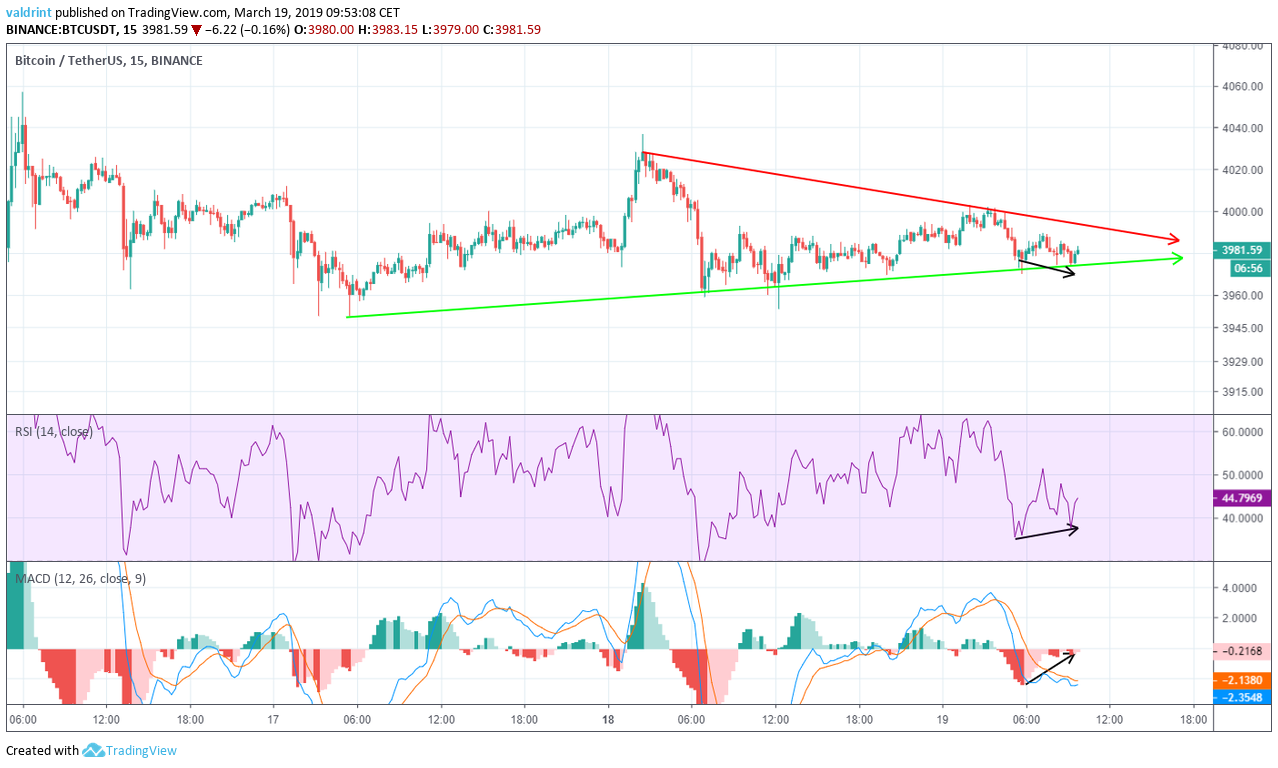
On Mar 19, the price made a low of ₮3970. During the same day, it proceeded to make a lower low.
Similarly, the RSI and the MACD made the first low on Mar 19. However, they proceeded to make higher lows during the day.
This is known as bullish divergence and often precedes price increases. It is especially effective if both indicators are in agreement, which is the case in BTC.
Based on these indicators, it is likely that the price moves toward the resistance line of the triangle and eventually breaks out.
Reversal Areas
In order to better determine possible future levels of resistance and support, the price of BTC on Binance is analyzed at two-hour intervals from Feb 22 to Mar 18.
Resistance and support areas are created when the price visits the same level several times.
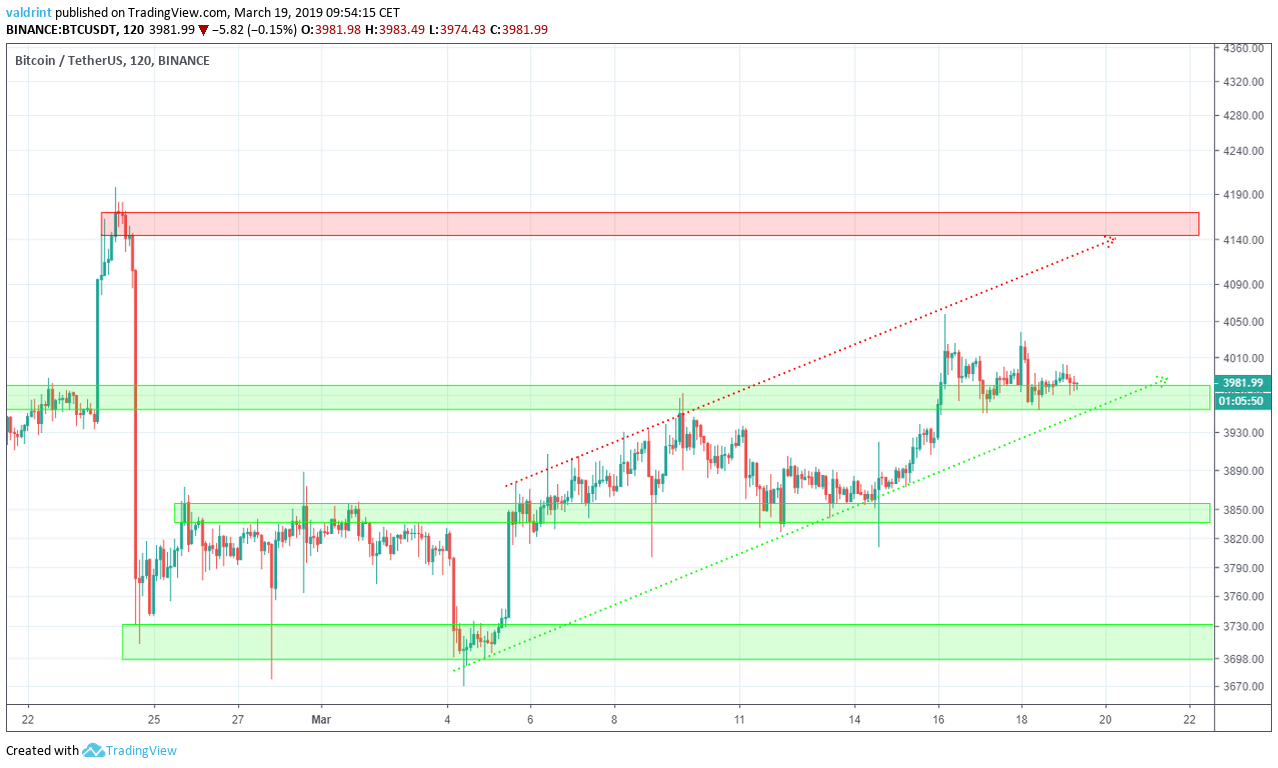
Price is currently trading inside the first support area at ₮3970. This area previously served as resistance, rejecting the price on Mar 9. However, it turned to support after the Mar 16 breakout.
We can also see that the price has been trading inside an ascending channel since Mar 4. The support line of the channel coincides with the first support area.
Other support areas are found near ₮3860 and ₮3720. If the price breaks down from the channel, these two would provide likely reversal areas. Based on our analysis, it is not likely that the price reaches the 2nd and 3rd support areas.
Conversely, the closest resistance area is found near ₮4160. It coincides with the resistance line of the channel. If the price breaks out, this area would provide a likely reversal. Based on our analysis, the price may eventually reach this area. However, a rapid increase is not expected.
Summary of Analysis
Based on this analysis, the price of BTC is likely to move inside the confines of the short-term symmetrical triangle until a breakout occurs. If the price moves up to the resistance line of the triangle, this prediction will be partially validated. If it eventually breaks out, it will be fully validated. The prediction would be invalidated by a break down below the support line.
Do you think BTC will breakout from the triangle or will price continue to consolidate? Let us know your thoughts in the comments below.
Disclaimer: This article is not trading advice and should not be construed as such. Always consult a trained financial professional before investing in cryptocurrencies, as the market is particularly volatile.


