


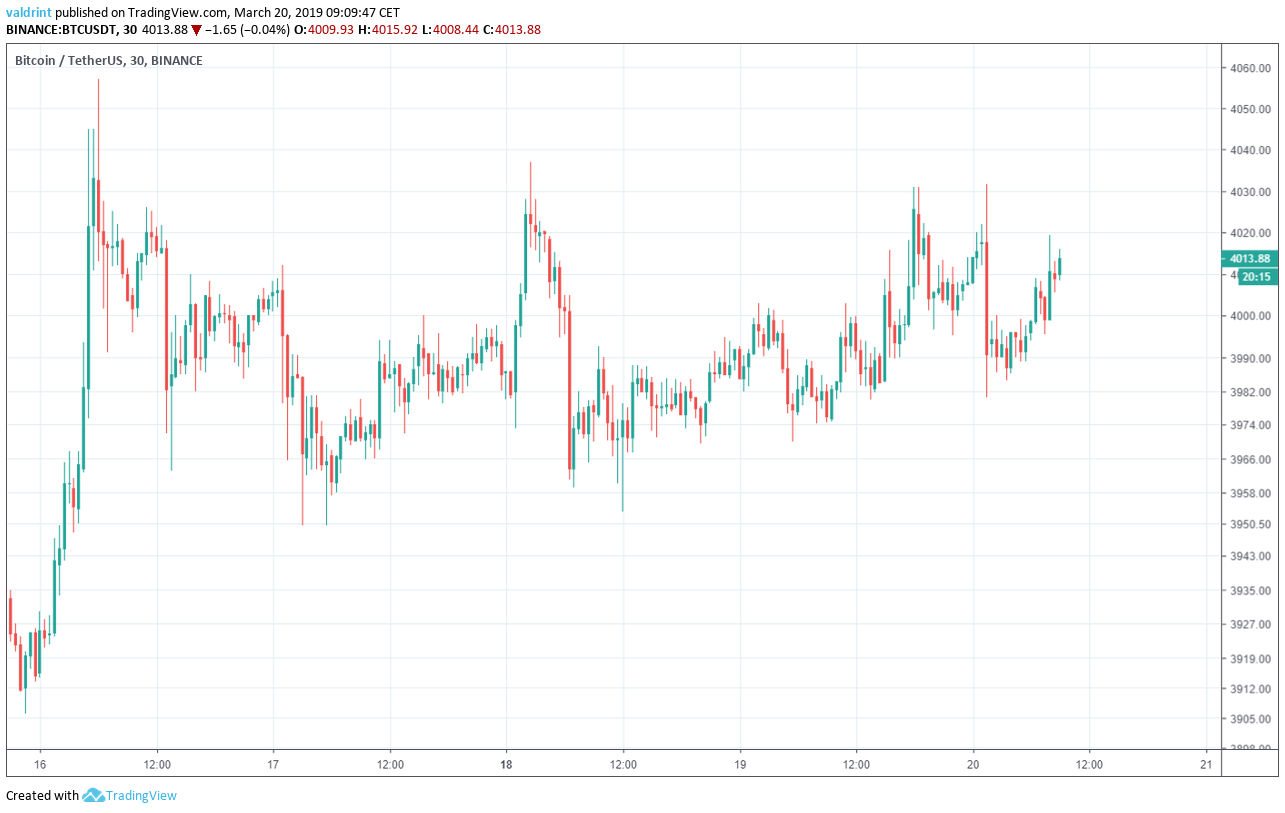
On March 16, 2019, Bitcoin (BTC) pushed past the ₮4000 barrier. A gradual downtrend followed. However, Bitcoin is showing signs of strength, and price increases may be coming soon!
Here is a look at the prices in the period from Mar 16 to Mar 20 :
In our Mar 19 analysis, we predicted that BTC may soon breakout past ₮4000 again. It did so later that day.
Based on today’s analysis, we predict that BTC may soon initiate a rapid upward move and breakout above resistance once again.
Bitcoin: Trends and Highlights For March 20, 2019
- The price of Bitcoin has been on a downtrend since Mar 16.
- BTC is trading inside a short-term ascending triangle
- It is trading inside a long-term ascending channel.
- There are support areas near ₮3970, ₮3840 and ₮3720.
- There is resistance near ₮4160.
Ascending Support
The price of BTC on Binance is analyzed at thirty-minute intervals from Mar 16 to Mar 20.
The price made a low of ₮3950 on Mar 17. A steady upward move followed by a flash crash ensued. The succeeding low was higher than the one on Mar 17. Since then, Bitcoin has reached consecutively higher lows.
Tracing these lows gives us an ascending support line. The support line acts as a floor to price, preventing further downward movement. It also gauges the general growth trend of an asset.
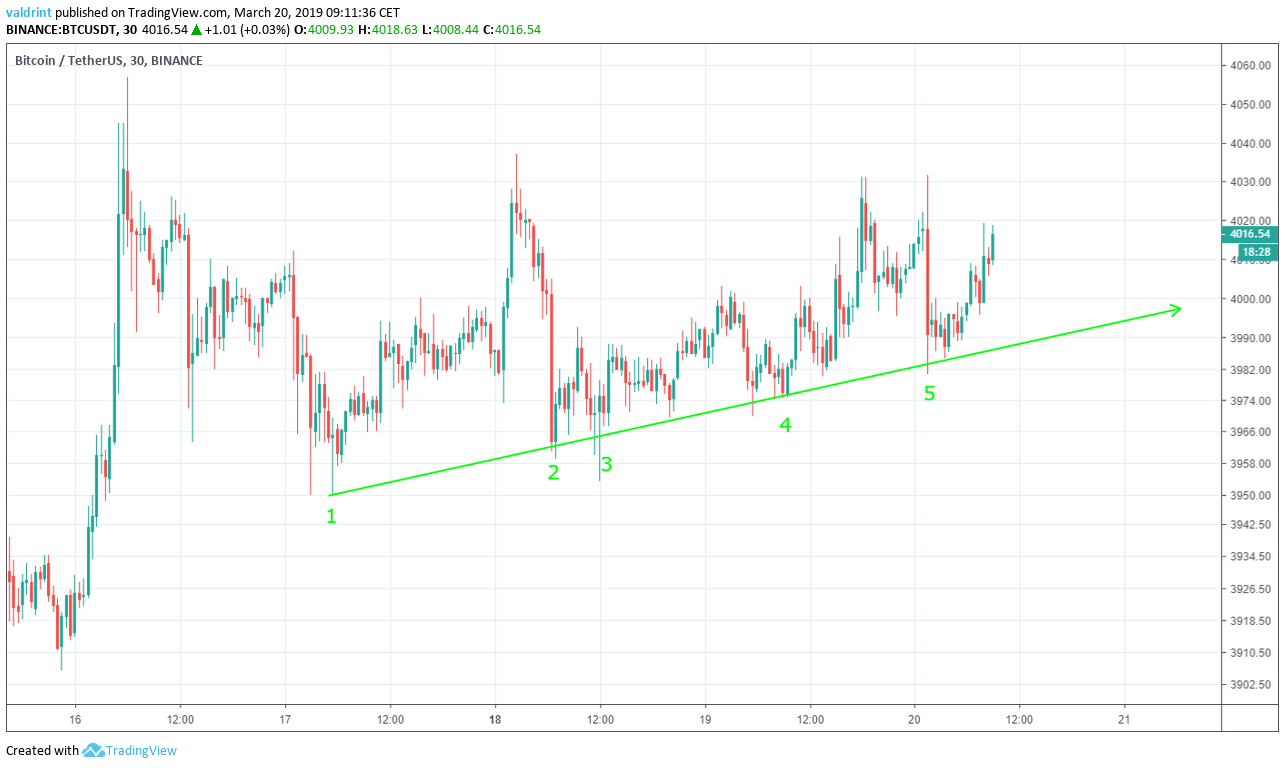
Wick breakdowns such as the ones on Mar 18 can be considered insignificant if they are not sustained by continuous movement below the line. In the case of BTC, the price immediately rebounded and closed above the support line. Therefore, these lows below support can be considered insignificant.
Movement below this line is not likely unless a break down occurs. The support line alone is not sufficient in estimating if a break down will occur.
Ascending Triangle
The price reached a high of ₮4037 on Mar 18. A sharp drop ensued. On Mar 16, BTC reached ₮4024. While the original high was not reached again, the ₮4024 level has been revisited several times since.
Tracing these highs gives us a horizontal resistance line. Similar to the support line, the horizontal resistance line can act as a ceiling to price, preventing further upward movement. It traces the theoretical upper limits of the price.
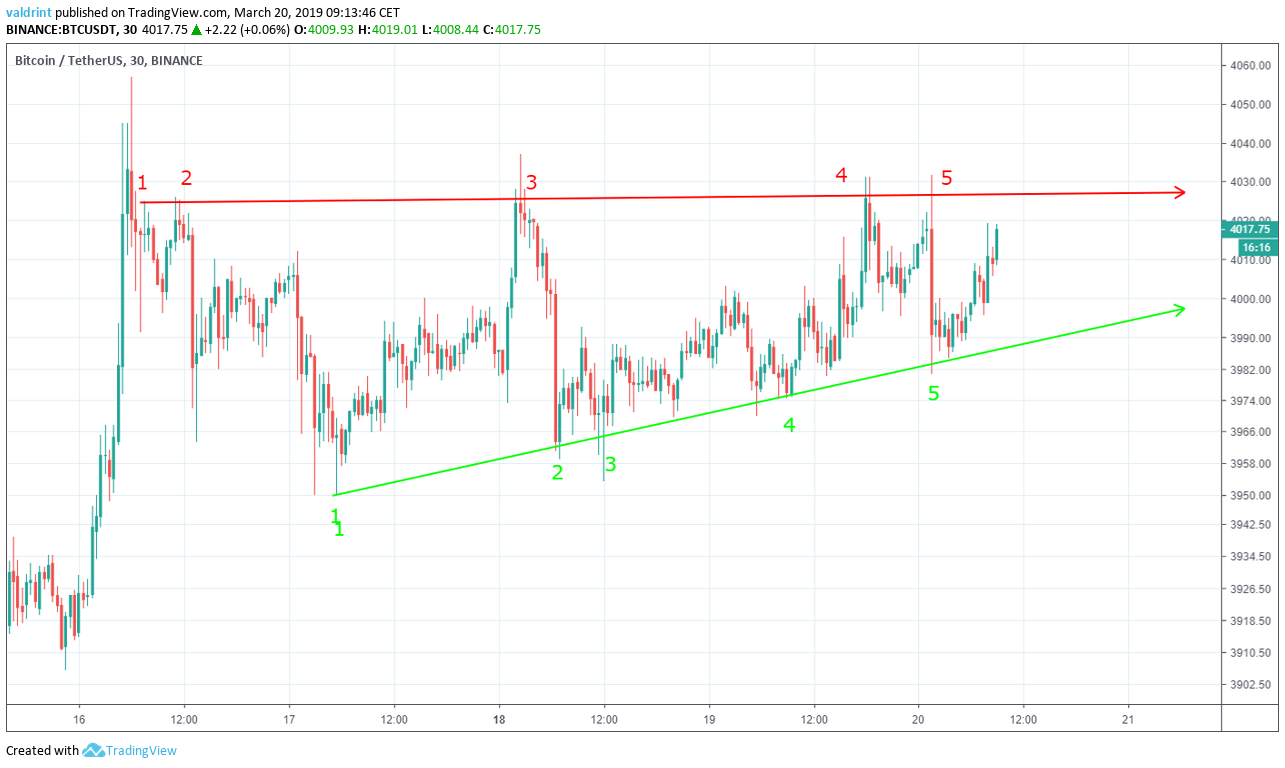
The support and resistance lines combine to create an ascending triangle, which is a bullish pattern, making price increases more likely. The triangle is a better predictor of price fluctuations than resistance and support lines alone.
The price may move inside the confines of the triangle until a point of convergence occurs. At that time, a breakout is more likely to occur.
A New Uptrend
The moving average convergence divergence (MACD) is a trend indicator that shows the relationship between two moving averages (long and short-term) and the price. It is used to measure the strength of a move.
Combined with simple moving averages (SMA), MACD can be used as a trigger for buy and sell signals. Signals are triggered whenever the MACD line is above 0 and the price is above the 21 (red) and 50-period (green) SMAs.
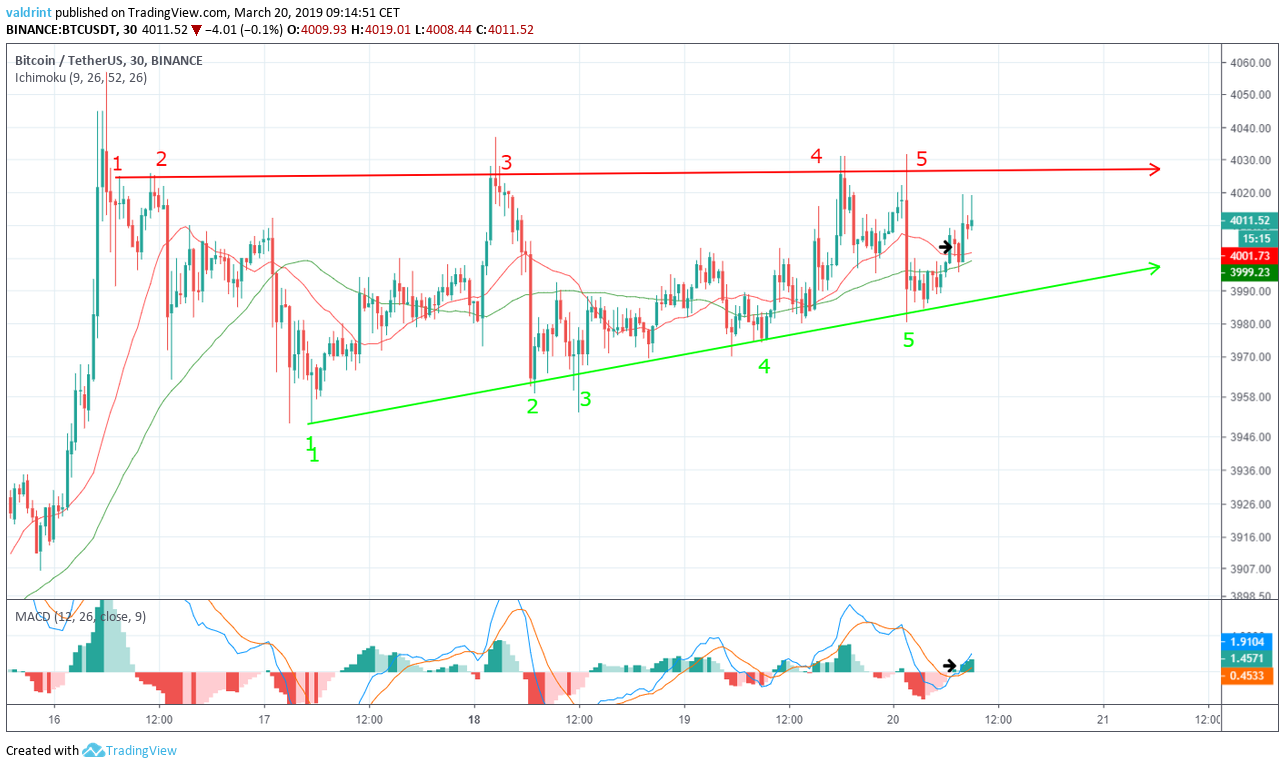
On Mar 20, the price made a low of ₮3980. Afterward, an upward move was initiated, which took price above the 21 and 50-period SMAs.
During the same interval, the MACD line crossed above 0. This would have triggered a buy signal, indicating that an uptrend may be beginning.
Based on these indicators, it is likely that the price moves toward the resistance line of the triangle and eventually breaks out. The date of a breakout cannot be determined by this pattern alone, however.
Reversal Areas
In order to better determine possible future levels of resistance and support, the price of BTC on Binance is analyzed at two-hour intervals from Feb 23 to Mar 20.
Resistance and support areas are created when the price visits the same level several times.
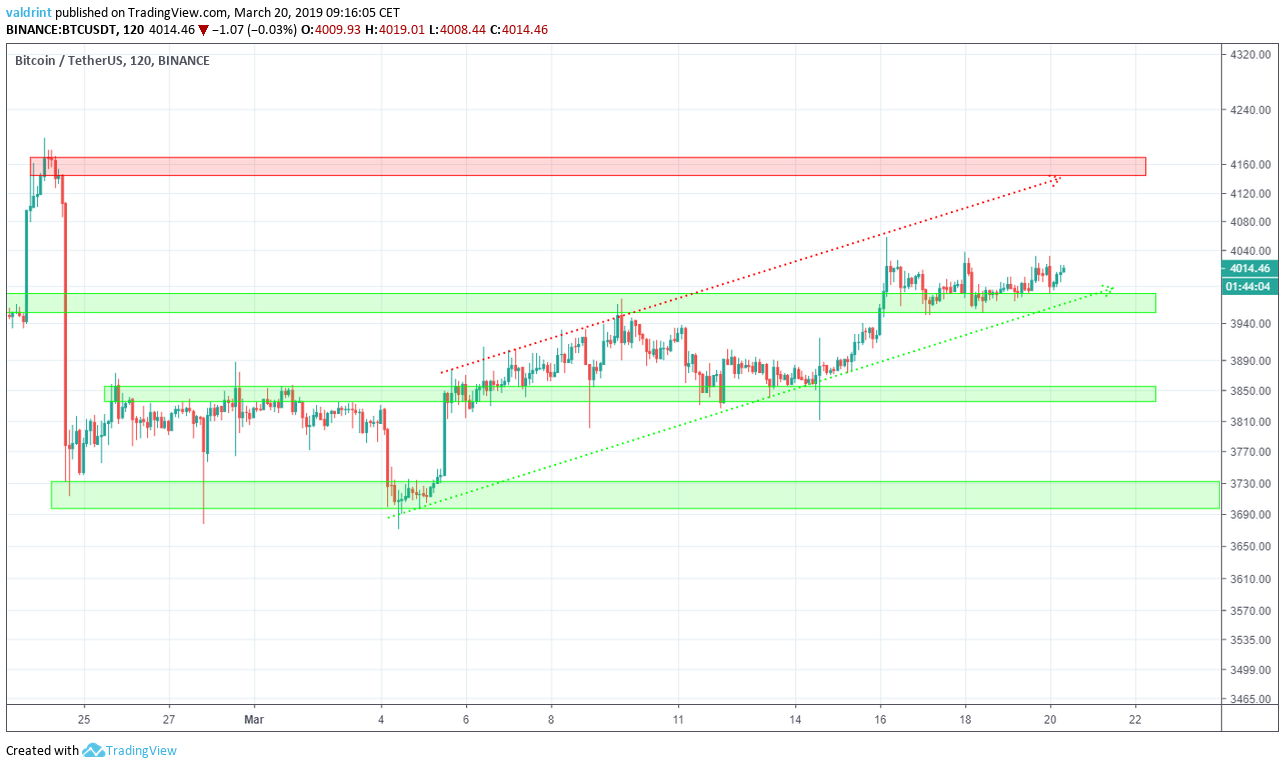
Price is currently trading slightly above the first support area at ₮3970. The area previously served as resistance, rejecting the price on Mar 9. However, it turned to support after the Mar 16 breakout.
We can also see that the price has been trading inside an ascending channel since Mar 4. The support line of the channel coincides with the first support area.
Other support areas are found near ₮3860 and ₮3720. If the price breaks down from the channel, these two would provide likely reversal areas. Based on our analysis, it is not likely that the price reaches the 2nd and 3rd support areas.
Conversely, the closest resistance area is found near ₮4160. It coincides with the resistance line of the channel. If the price breaks out, this area would provide a likely reversal. Based on our analysis, the price may eventually reach this area.
Summary of Analysis
Based on this analysis, the price of BTC is likely to move inside the confines of the short-term ascending triangle until a breakout occurs. If the price moves up to the resistance line of the triangle, this prediction will be partially validated. If it eventually breaks out, it will be fully validated. The prediction would be invalidated by a break down below the support line.
Do you think BTC will breakout from the triangle and initiate a rapid upward move? Let us know your thoughts in the comments below.
Disclaimer: This article is not trading advice and should not be construed as such. Always consult a trained financial professional before investing in cryptocurrencies, as the market is particularly volatile.


