


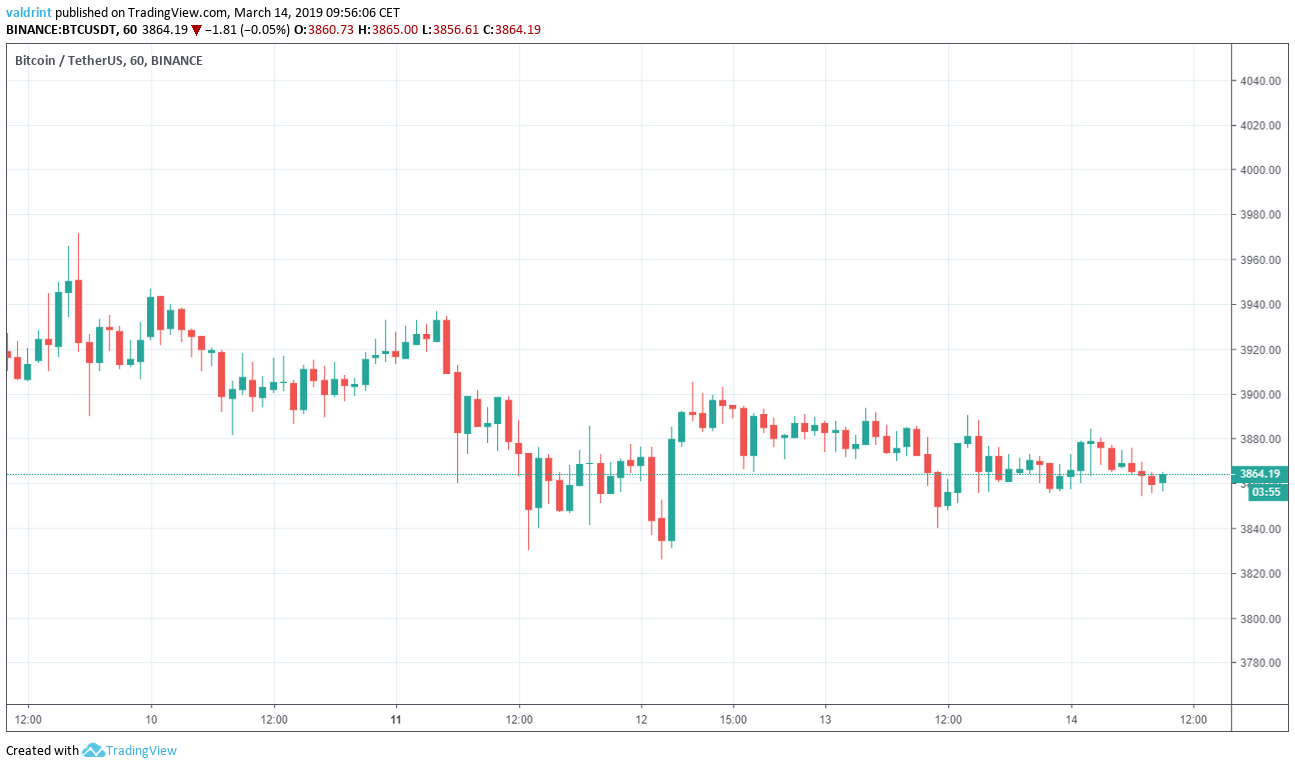
On Mar 9, 2019 Bitcoin (BTC) reached a high of nearly $4,000. A gradual downward trend has since followed.
Here’s a look at prices between Mar 9 and Mar 14:
In our March 13 analysis of Bitcoin, we predicted that the price will continue decreasing slowly until it initiates an upward move. Prices have continued decreasing, and we are still awaiting a forthcoming reversal. Based on today’s analysis, we predict that the price will trade near the same level without significant movement until a price increase occurs.
Key Highlights For Mar 14
- The price of Bitcoin has been on a downtrend since Mar 9.
- It is trading inside a medium-term descending channel and a short-term symmetrical triangle.
- There is some bullish divergence developing in the RSI.
- The price is trading inside the support area near $3840.
- A second support area can be found near $3720.
- There are resistance areas near $4160 and $3970.
Descending Support
The price of BTC on Binance is analyzed at one-hour intervals from Mar 9 to Mar 14.
After the Mar 9 high, the price dropped to a low of $3890 for the day. Since then, it has continued to drop—creating lower lows. Tracing these lows gives us a descending support line.
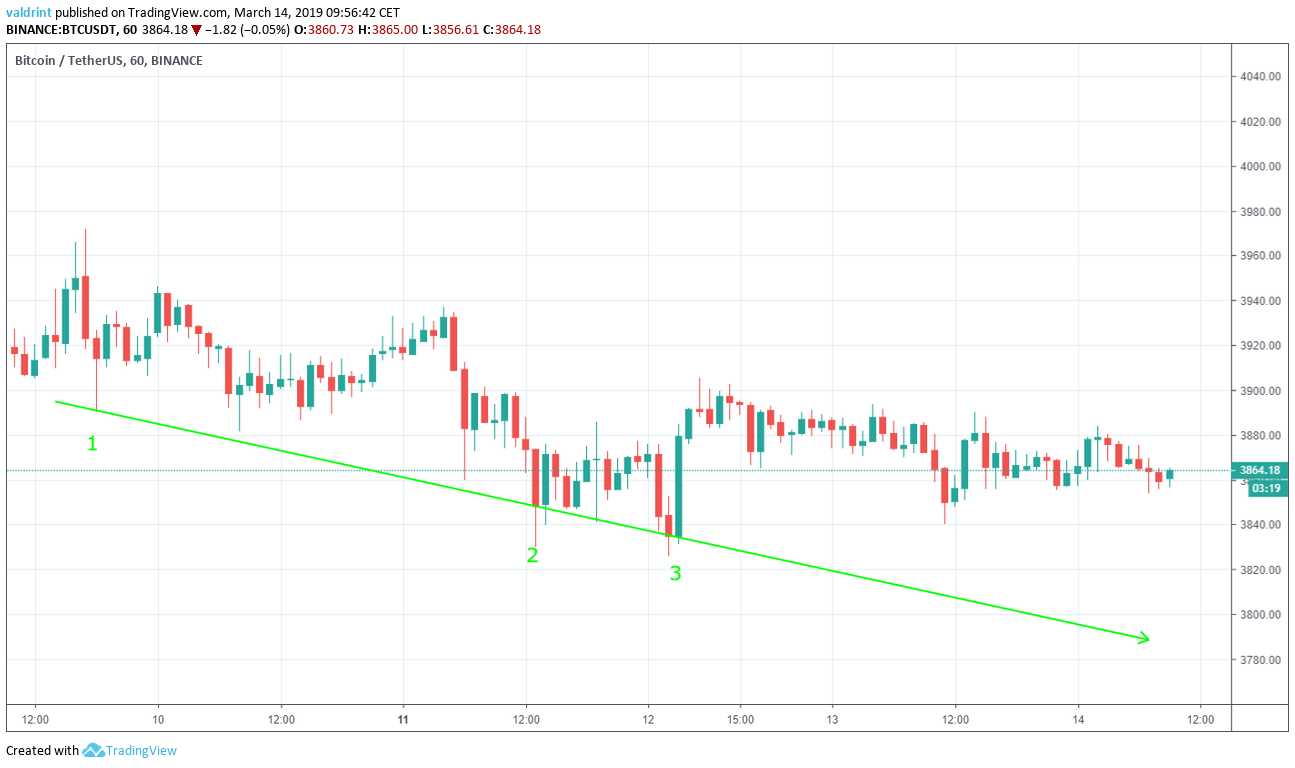
The support line can act as a floor to price, preventing further downward movement. It traces the theoretical upper limits of price over a given period of time.
Initially, BTC had been decreasing at the rate predicted by the line, however, the price decrease appears to have halted on Mar 13. Based on the current support, prices should continue to decrease, but if BTC continues trading well above the support, price increases may be forthcoming.
Descending Channel
The price reached a high of $3971.75 on Mar 9. It has made successively lower highs since. Tracing these highs gives us a descending resistance line.
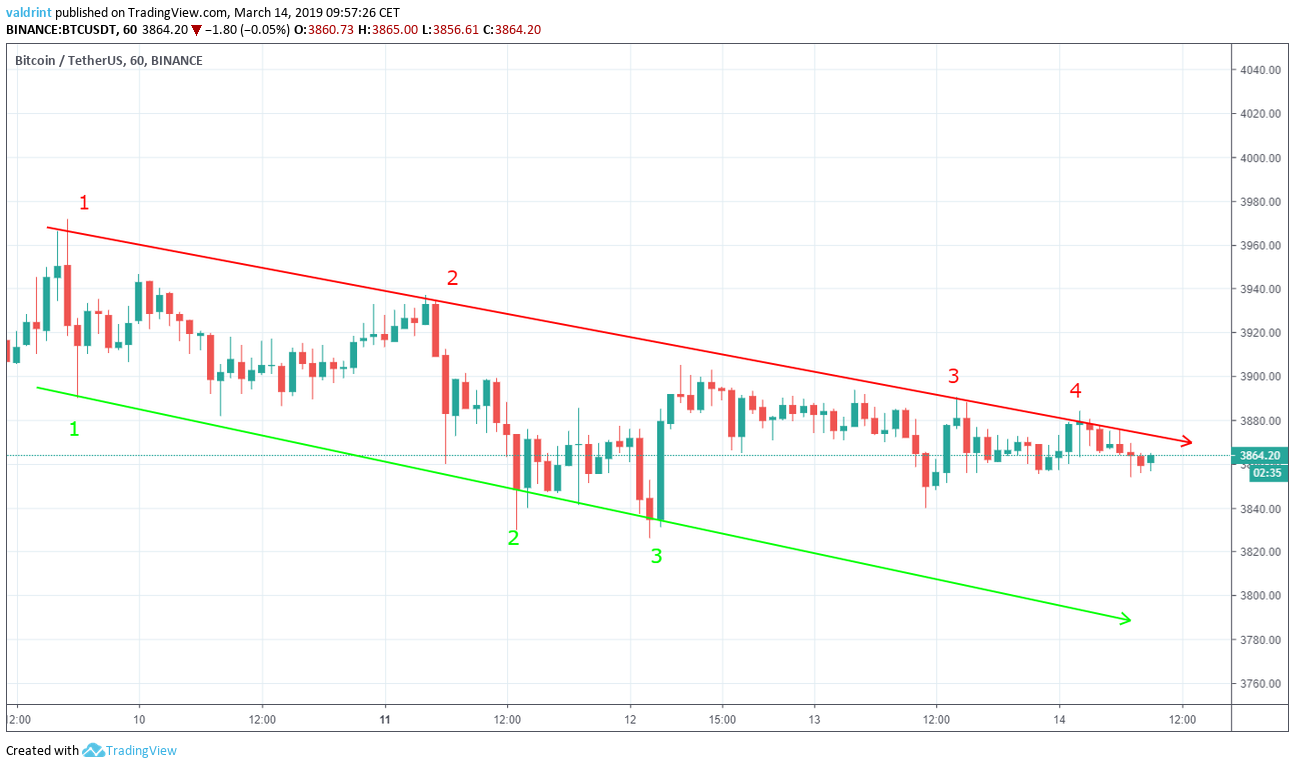
The descending resistance line can act as a ceiling to price, preventing further upward movement.
The resistance and support lines combine to create a descending parallel channel, which is a neutral pattern as long as price remains within it.
The channel is a better predictor of price fluctuations than resistance or support alone. Because the channel is moving downward, price decreases will likely continue into the future at the rate specified by the channel.
With prices trading near the resistance, a breakdown is possible; however, based on this channel alone, prices may just as likely return to the support and continue trading within the channel for the foreseeable future.
Predicting Future Movements
In order to find out whether a breakout is likely to occur, a close analysis of shorter time-frames with technical indicators is required. Thus, the price of BTC on Binance is analyzed at ten-minute intervals from Mar 12 to Mar 14 using the realitve strength index (RSI).
The RSI is an indicator which calculates the size of the changes in price in order to determine oversold or overbought conditions in the market. Combining the relative strength index (RSI) bullish/bearish divergence with support/resistance essentially predicts price fluctuations.
On Mar 12, the price made a low of $3826.06. It has been on an upward trend since, creating higher lows. Tracing these lows gives us the ascending support line.
During the same day, it reached a high of $3905.2. It has made lower highs since. Tracing these highs gives us a descending resistance line.
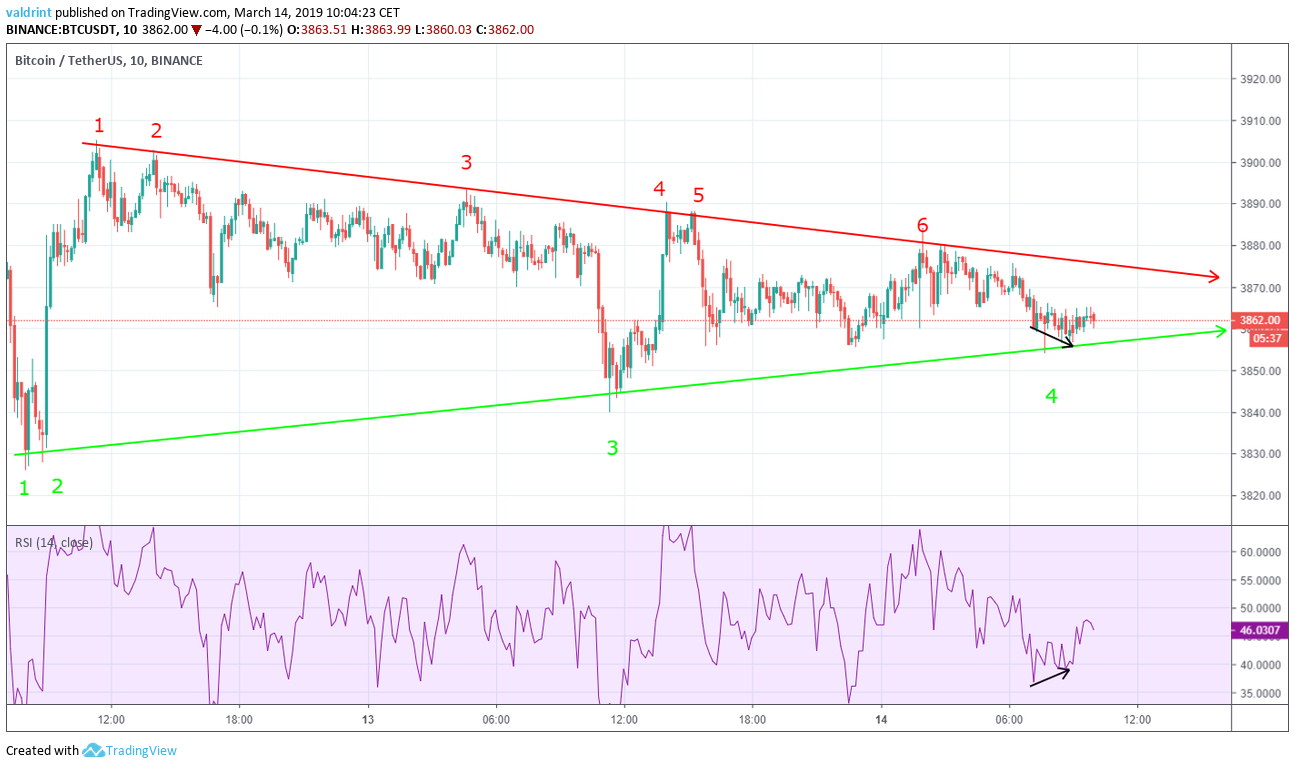
The resistance and support lines combine to create a symmetrical triangle, which is a neutral pattern, making price increases and decreases equally likely. As the triangle converges, a breakout above support or breakdown below resistance will become inevitable.
On Mar 14, the price has made successive lower lows. On the same day, the RSI has created higher lows. This is known as bullish divergence and often predicts price increases. Based on this analysis, price will likely continue trading within this triangle until convergence forces a likely breakout—which could precipitate price increases. A breakdown, however, should not be excluded as a possibility.
Using these indicators, it is suggested that Bitcoin’s price may start an upward move toward the resistance of the triangle. However, the level of divergence is not significant enough to confidently predict a breakout above the triangle and eventually above the descending channel.
Reversal Areas
In order to better determine possible future levels of resistance and support, the price of BTC on Binance is analyzed at four-hour intervals from Feb 23 to Mar 14.
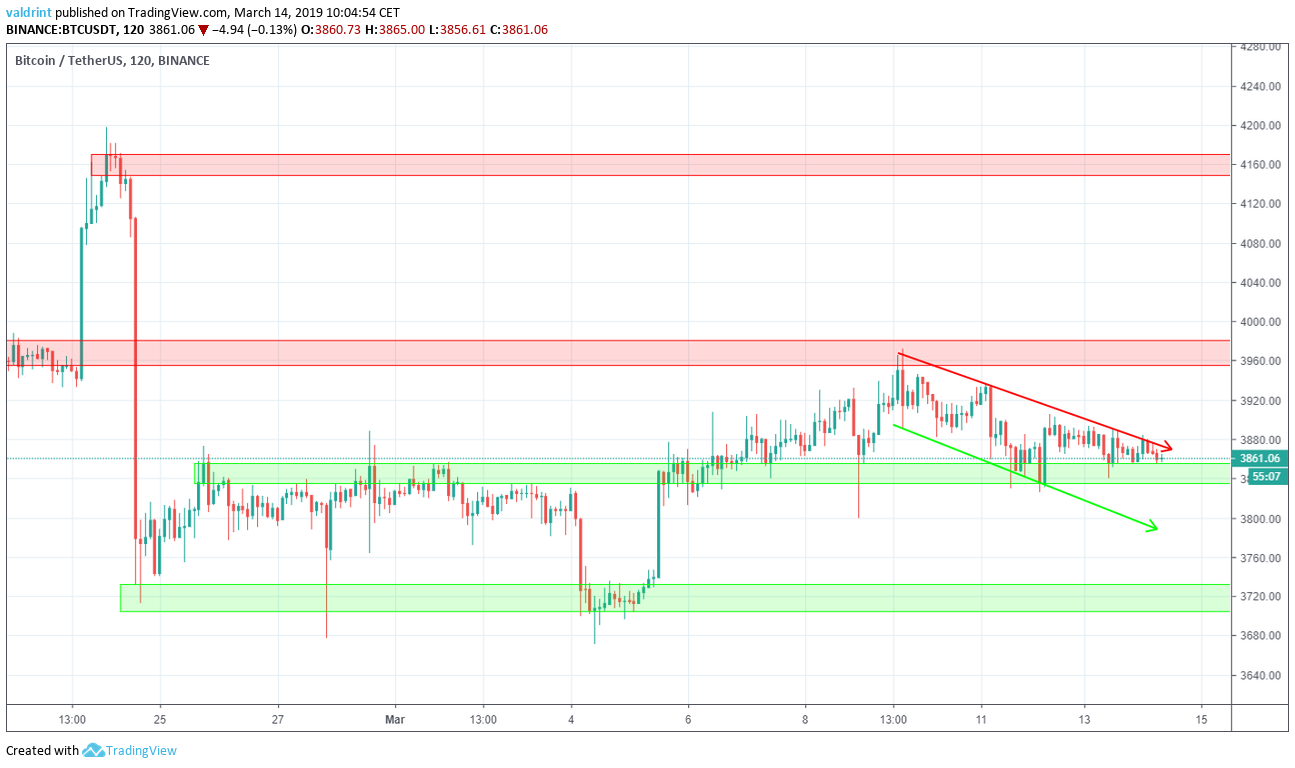
The first support area is found near $3840 and the second near $3720. We can see that price found support inside the first area on Mar 11. A breakdown below the second support area could lead to rapid price decreases.
Though the price may not reach the second support area, gradual decreases are possible in the future. We are not currently predicting rapid price decreases to or below $3720.
Conversely, the closest resistance area is found near $3960. The second one is found near $4160. In case of a breakout above the resistance line of the channel, a price of $3960 might be reached. A break above this level could lead to prices as high as $4160. We believe that this scenario is unlikely in the near future.
Summary of Analysis
Based on this analysis, the price of BTC is likely to move inside the confines of the symmetrical triangle until a point of convergence occurs. Afterward, it is more likely that a breakout will occur. If the price trades inside the symmetrical triangle, the prediction will be partially validated. If it eventually breaks out, it will be fully validated.
Do you think BTC will breakout above the triangle or will price continue decreasing? Let us know your thoughts in the comments below.
Disclaimer: This article is not trading advice and should not be construed as such. Always consult a trained financial professional before investing in cryptocurrencies, as the market is particularly volatile.


