


On Mar 9, 2019, Bitcoin (BTC) reached a high of nearly ₮4,000. Subsequently, gradual price drops began without significant fluctuations.
In our March 12 analysis of Bitcoin, we successfully predicted this continued decline. We also predicted that new resistance and support lines would emerge as a result. This appears to be the case with BTC now trading inside a descending channel.
At the time of writing, BTC’s price was trading near the resistance line—suggesting a possible breakout in the near future. This would confirm another prediction made in our Mar 12 analysis—namely that a reversal would follow price drops.
Based on today’s analysis, we predict that the price will continue decreasing at the same rate as predicted by the channel until a breakout leads to a reversal.
Key Highlights For Mar 13, 2019.
- The price of Bitcoin (BTC) has been on a downtrend since Mar 9.
- It is trading inside a descending channel.
- There is some bullish divergence developing in the RSI and the MACD.
- The price is trading inside the support area near ₮3840.
- A second support area can be found near ₮3720.
- There are resistance areas near ₮4160 and ₮3970.
Downward Trend
The price of BTC on Binance is analyzed at 30-minute intervals from Mar 9 to Mar 13.
The price reached a high of ₮3971.75 on Mar 9. Prices subsequently emerged on a downward trend with lower highs being made until the current time. Tracing these highs gives us a descending resistance line—which also highlights the general rate of BTC’s current downward movement.
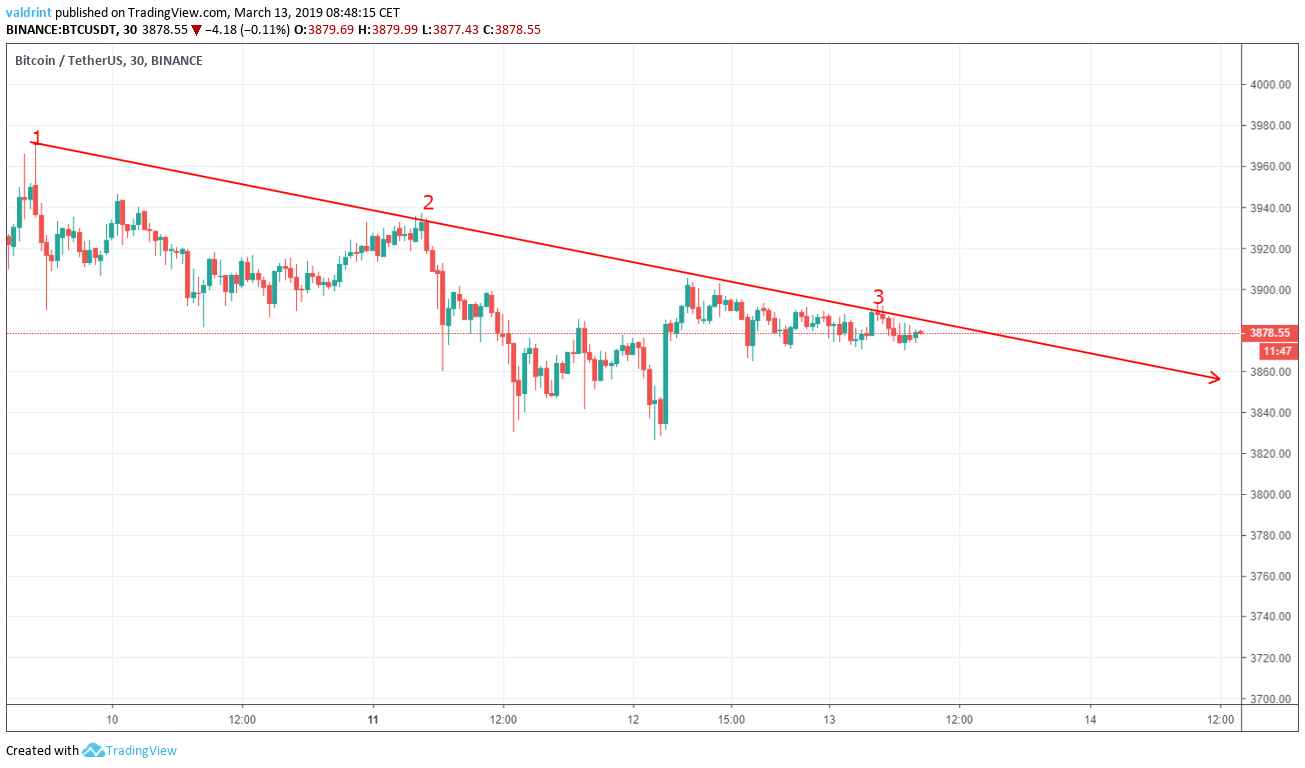
The resistance line can act as a ceiling to price. It traces the theoretical upper limits of price over a given period of time. BTC has been trading at the rate of the resistance with decreasing prices that are expected to continue into the near future.
Descending Support
After the Mar 9 high, the price dropped to a low of ₮3890 for the day. Since then, it has continued to drop. Just creating lower lows. Just as tracing the higher highs gives us a descending resistance line, tracing the lower lows gives us a descending support line.
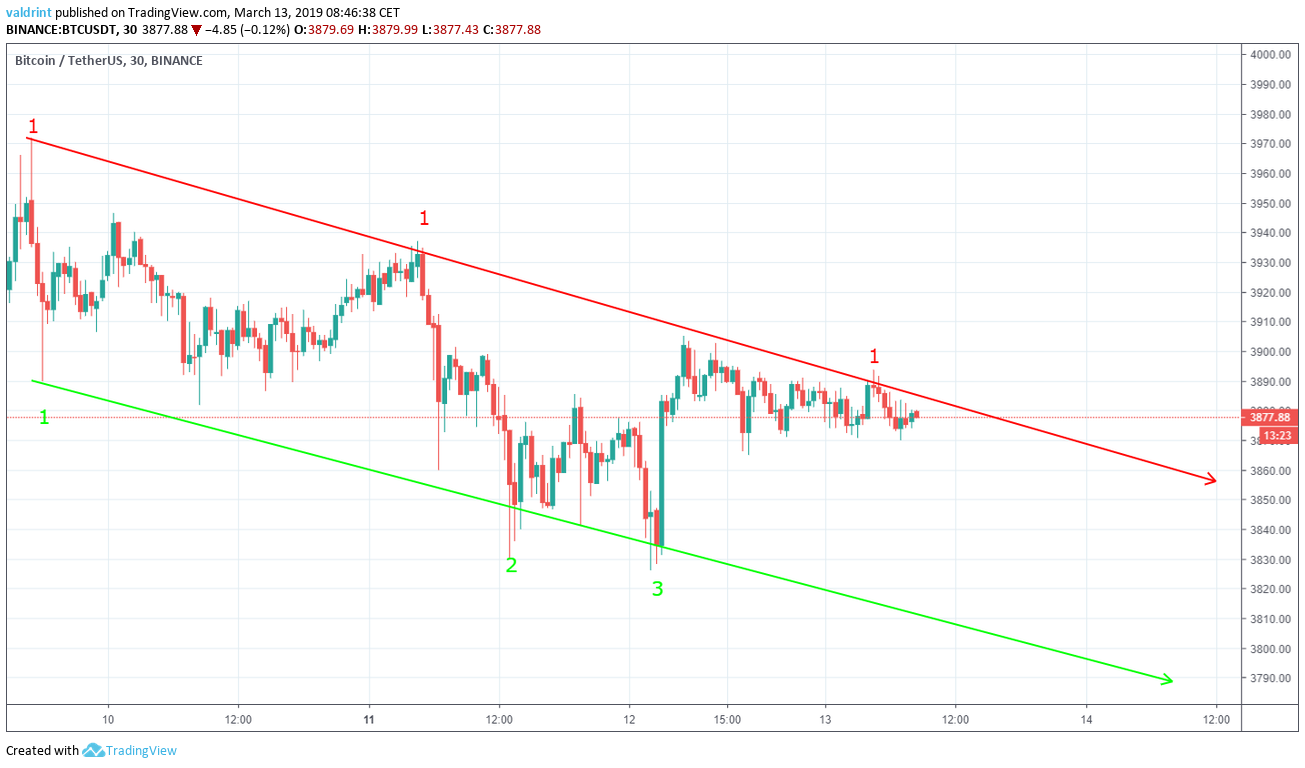
The support line can act as a floor to price, preventing further downward movement.
The resistance and support lines combine to create a descending parallel channel, which is a neutral pattern.
The channel is a better predictor of price fluctuations than resistance or support alone. Because the channel is moving downward, price decreases will likely continue into the future at the rate specified by the channel, unless a breakout occurs.
Based on the creation of this neutral pattern, the prices are likely to trade inside the confines of the channel.
Predicting Future Movements
Combining moving average convergence divergence (MACD) and relative strength index (RSI) bullish/bearish divergence with support/resistance essentially predicts price fluctuations.
The MACD is a trend indicator that shows the relationship between two moving averages (long and short-term) and the price. It is used to measure the strength of a move. The RSI is an indicator which calculates the size of the changes in price in order to determine oversold or overbought conditions in the market.
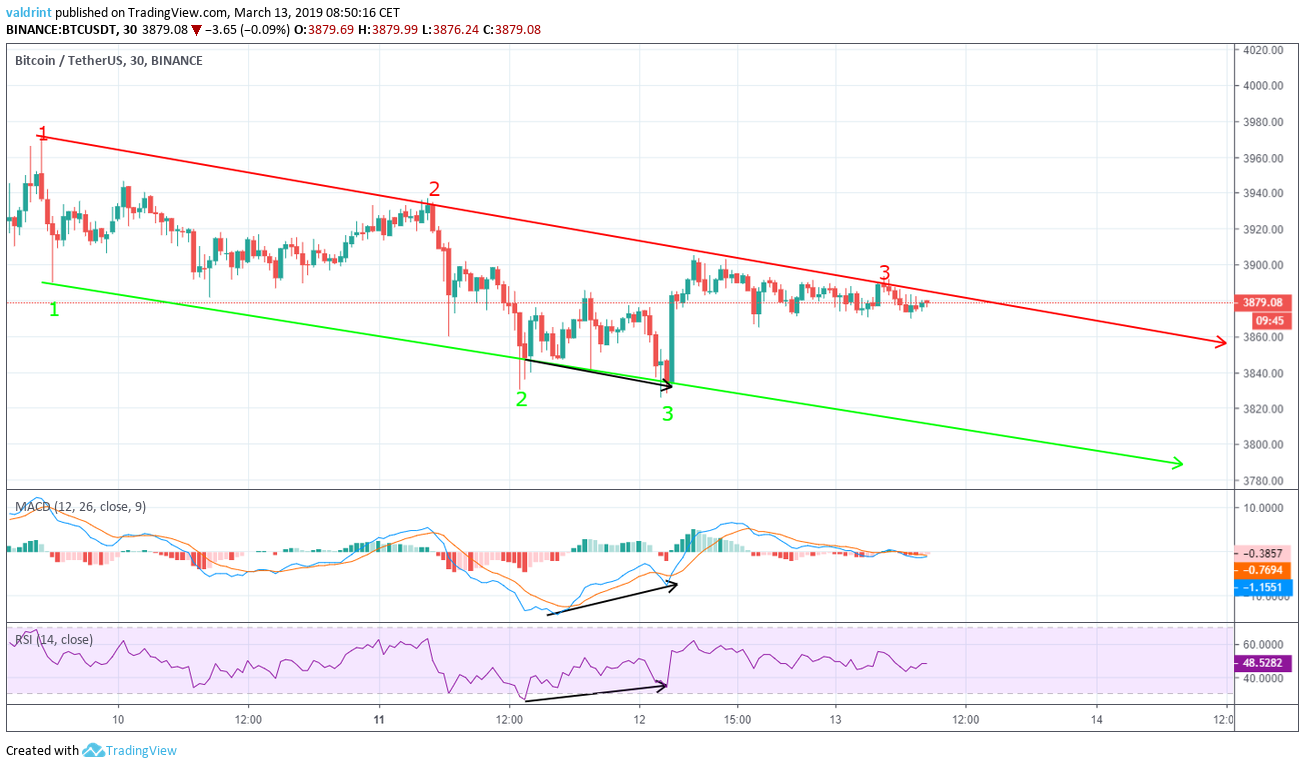
On Mar 11, the price made a low of ₮3830. On Mar 12, it continued to fall making a lower low of ₮3826.06.
Similarly, the MACD and the RSI each made their first low on Mar 11. However, higher lows have since followed. This indicates that bullish divergence has emerged and that future price increases may soon be forthcoming. Such increases could occur as part of a natural market cycle as we earlier predicted.
Using these indicators, it is suggested that Bitcoin’s price may continue decreasing for a short period but that a breakout forthcoming. However, the level of divergence is not very significant, and partial recovery has already occurred. Thus, it is possible that a breakout does not occur as predicted and that price will continue trading within this new channel for the foreseeable future. This would mean gradual but steady price losses over a longitudinal period.
Reversal Areas
In order to better determine possible future levels of resistance and support, the price of BTC on Binance is analyzed at four-hour intervals from Feb 22 to Mar 11.
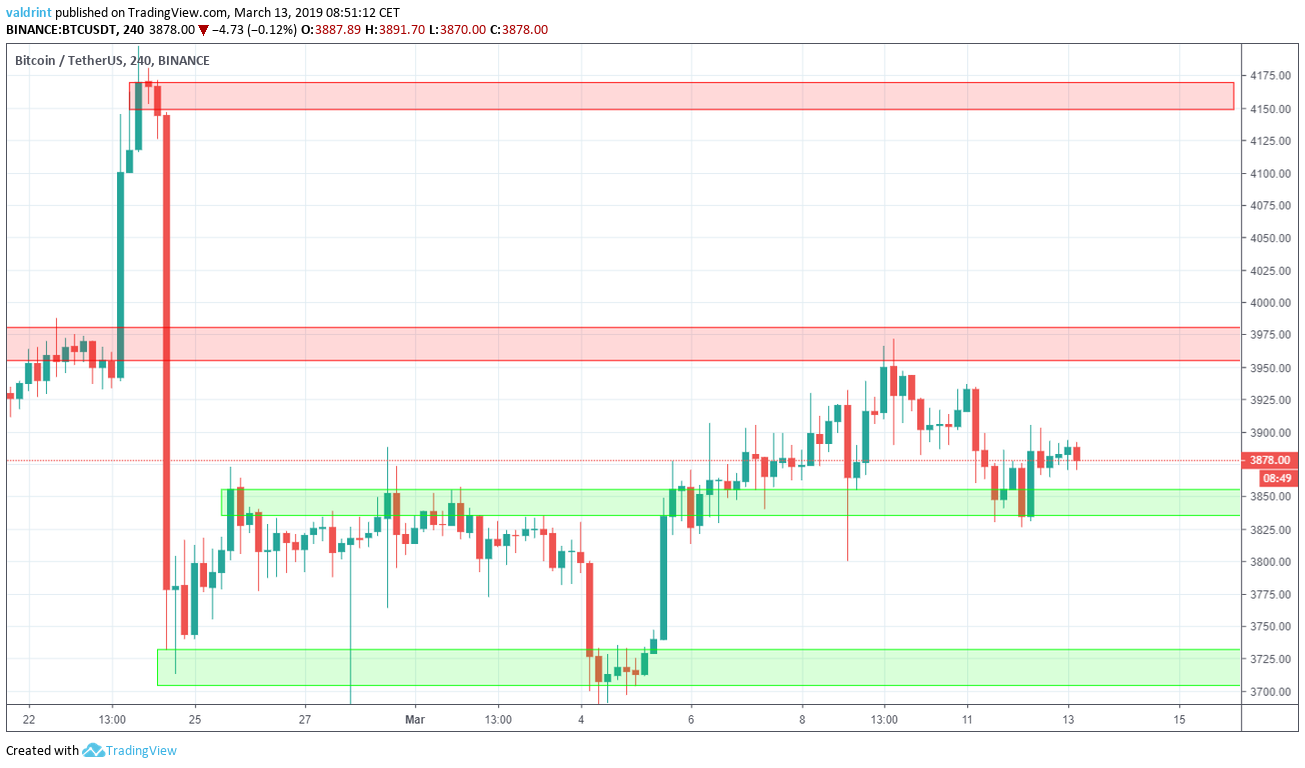
The first support area is found near ₮3840 and the second near ₮3720. We can see that price found support inside the first area on Mar 11. possible that it will head for ₮3720. A breakdown below the second support area could lead to rapid price decreases.
Though the price may not reach these resistance areas, price decreases are considered likely in the future. We are not currently predicting rapid price decreases to or below ₮3720.
Conversely, the closest resistance area is found near ₮3960. The second one is found near ₮4160. In case of a breakout above the resistance line of the channel, a price of ₮3960 might be reached. A break above this level could lead to prices as high as ₮4160. We believe that this scenario is not likely in the near future.
Summary of Analysis
Based on this analysis, the price of BTC is likely to decrease at a gradual rate with the descending channel. A breakdown below the support is less likely than a breakout above resistance. Such a breakout would signify a reversal as part of a possible market cycle.
Do you think BTC will breakout above the resistance or will price continue decreasing? Let us know your thoughts in the comments below.
Disclaimer: This article is not trading advice and should not be construed as such. Always consult a trained financial professional before investing in cryptocurrencies, as the market is particularly volatile.


