


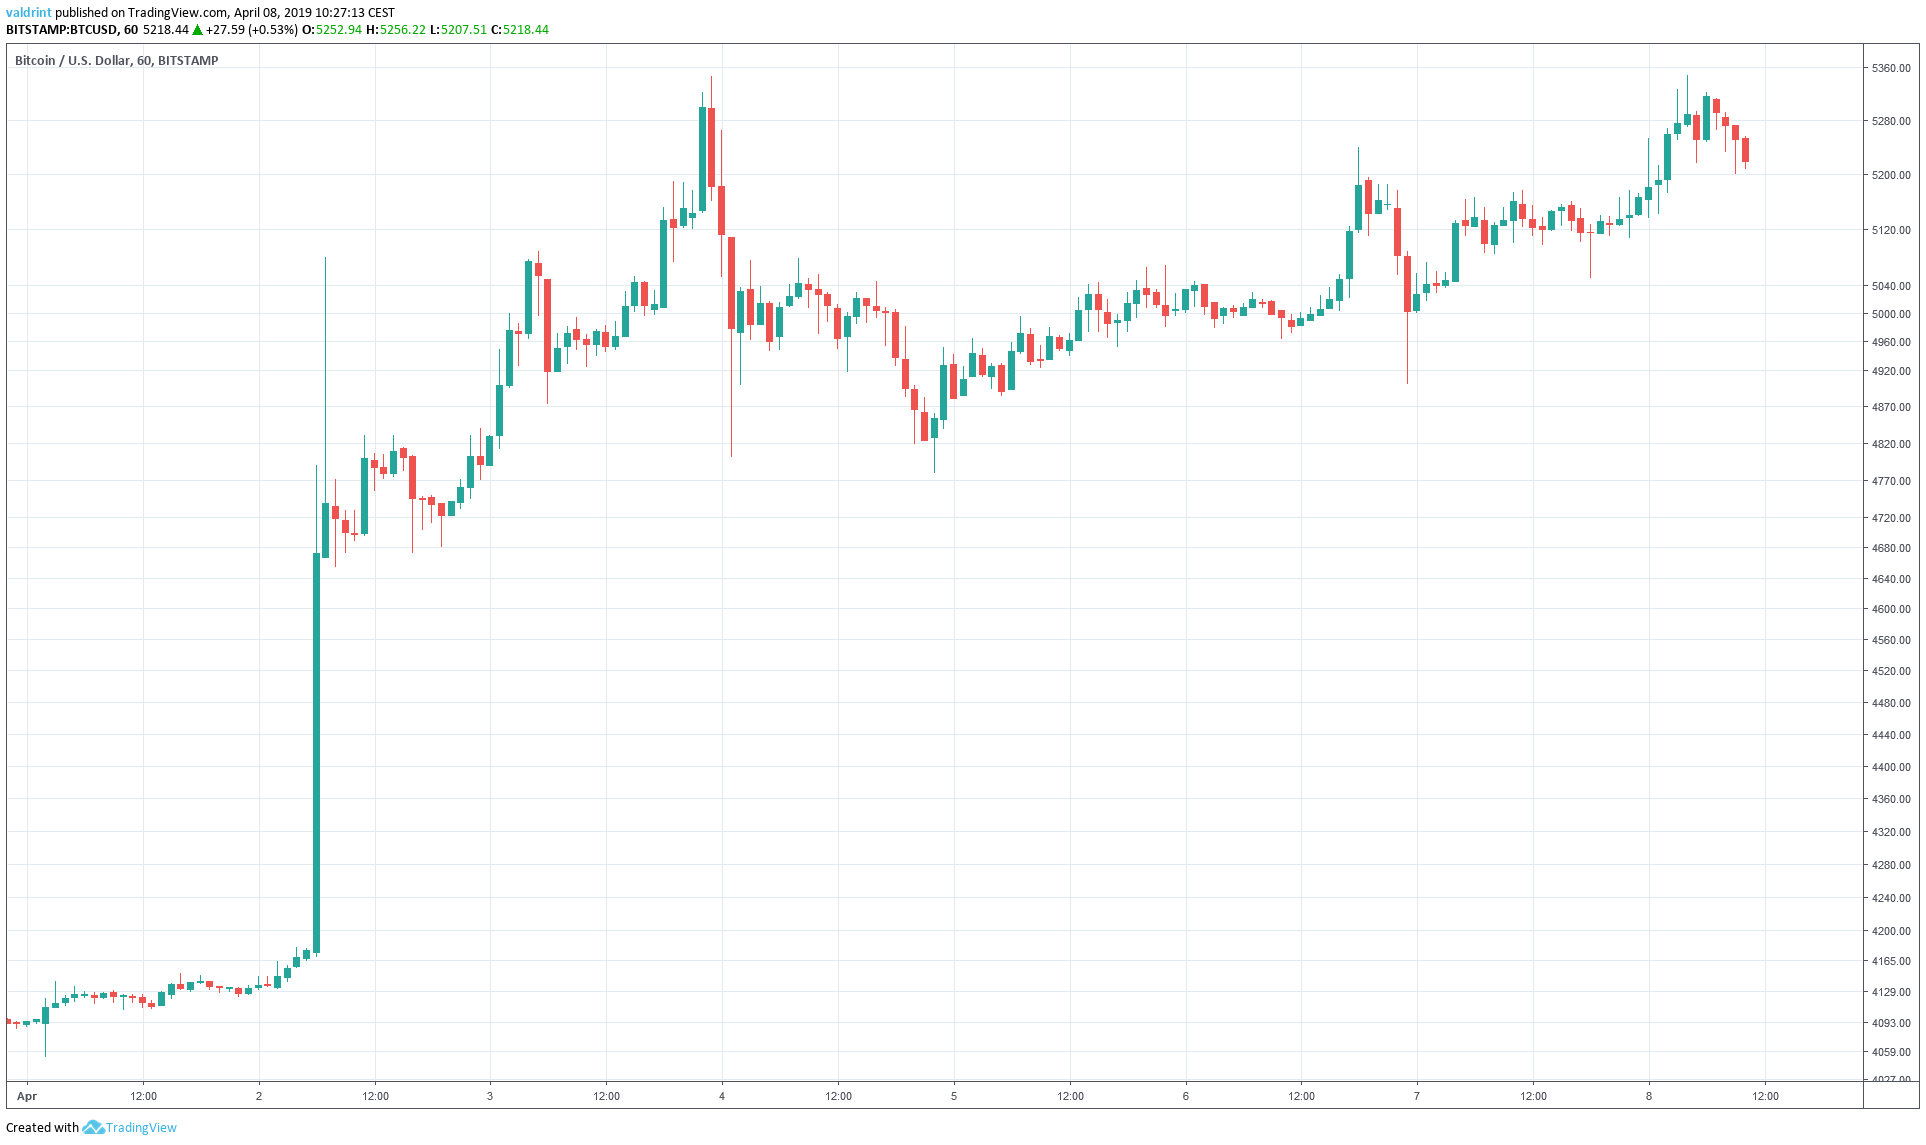
On Apr 2, 2019, the price of Bitcoin (BTC) spiked from $4169.17 to $4790 within an hour. The following day prices reached a high of $5345.
A gradual decrease brought prices back under $5000 before the day was over. Bitcoin has since emerged on an upward trend.
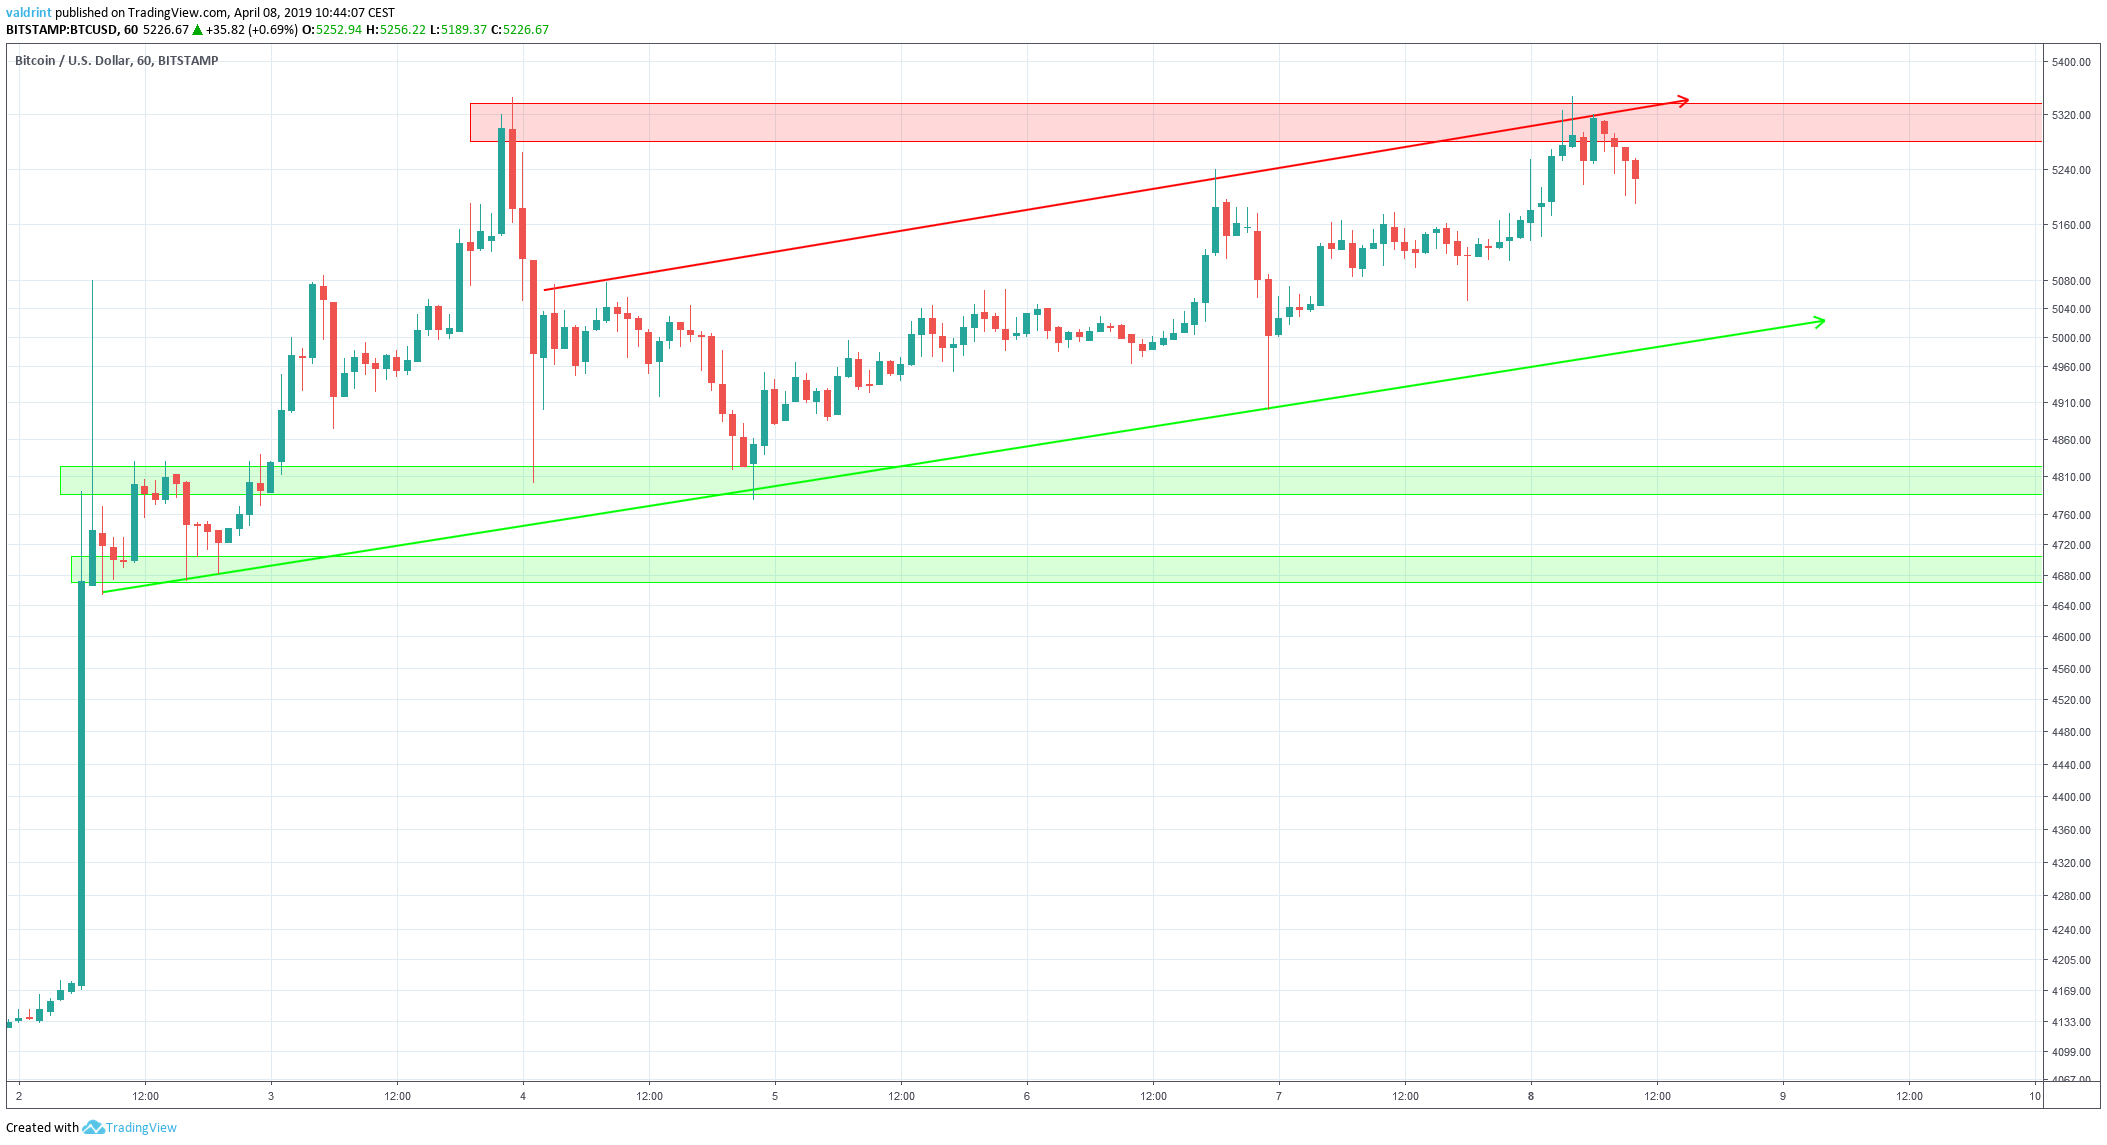
At the time of writing on Apr 8, Bitcoin was trading near the highs of Apr 3:
Bitcoin (BTC): Trends and Highlights For April 8
- BTC/USD has been trading inside an ascending channel since Apr 3.
- Bitcoin is trading very close to the resistance line of the channel.
- Bearish divergence developing in the RSI
- There is resistance near $5320 and support near $4800 and $4680.
Ascending Channel
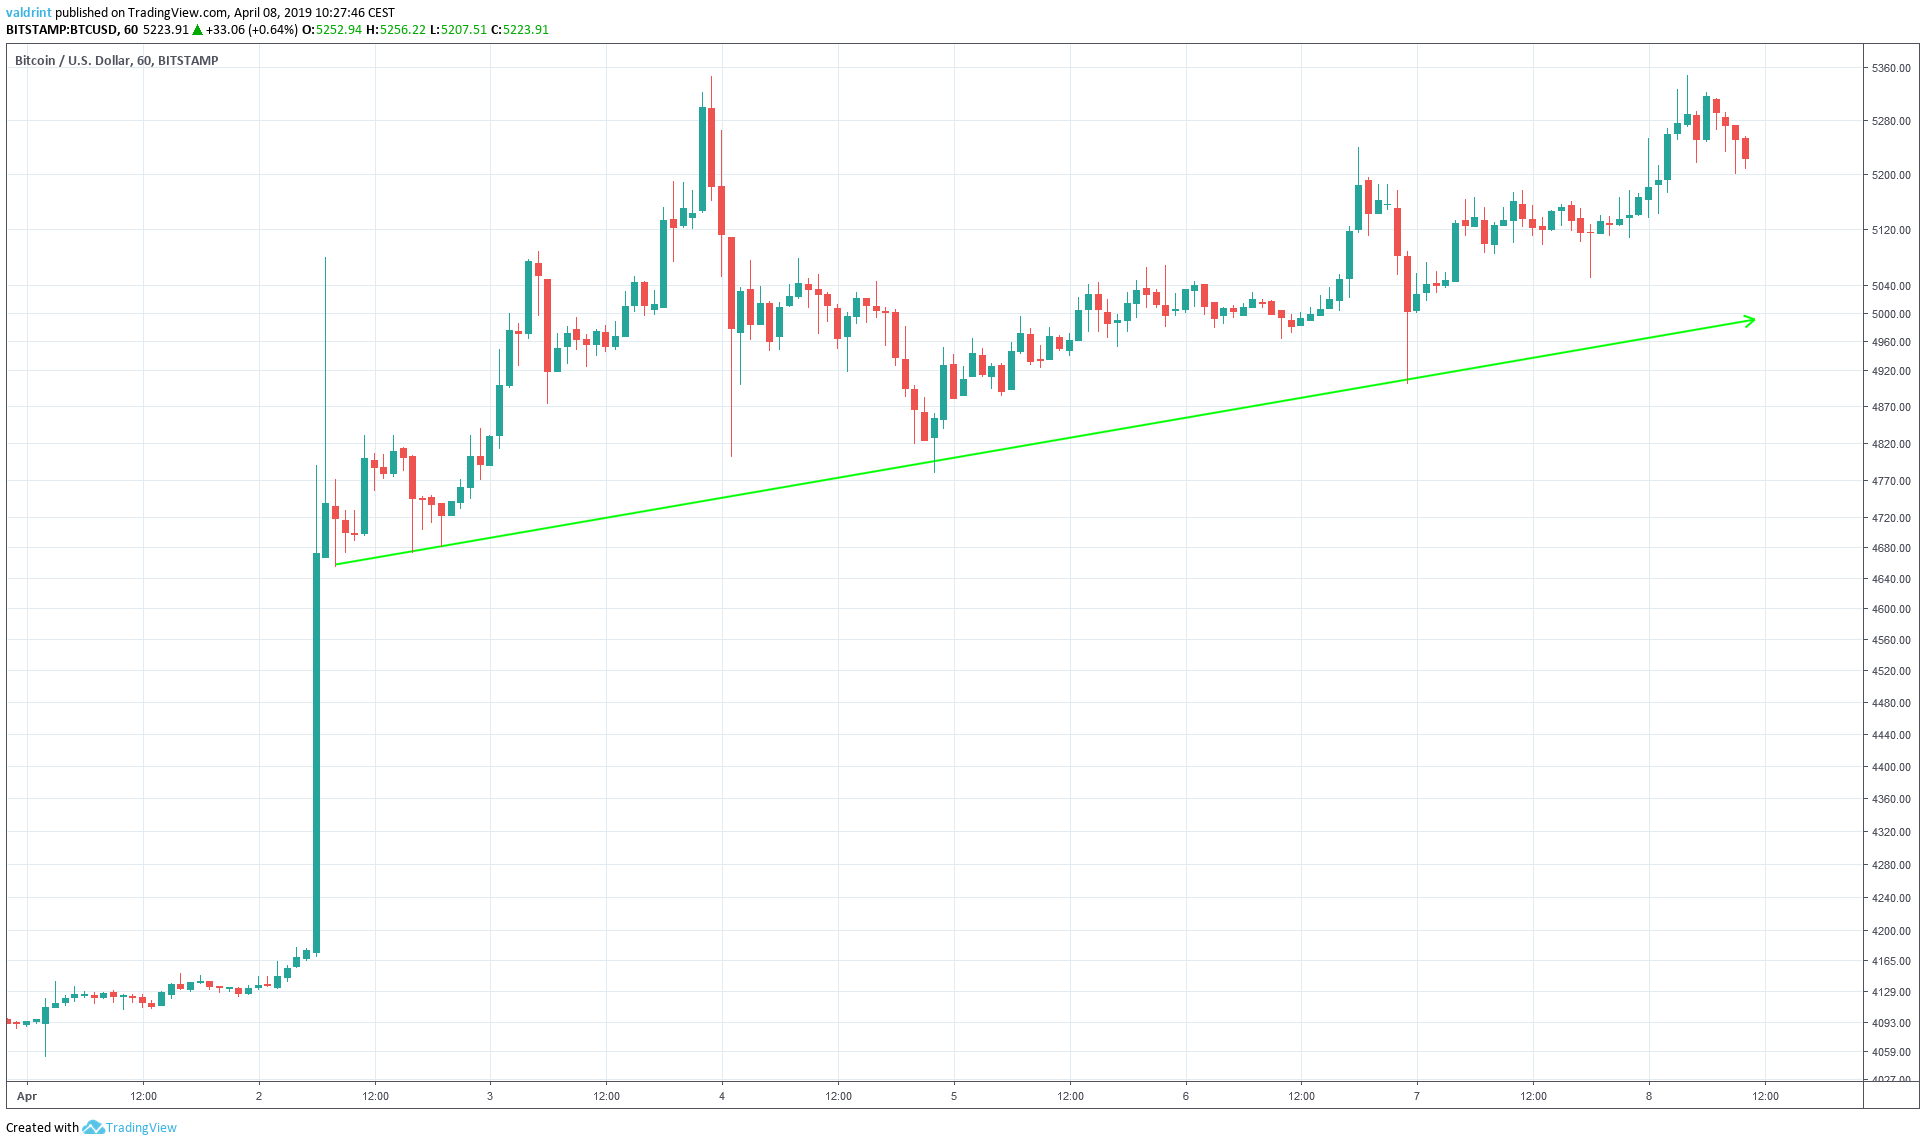
On Apr 2, the price made an hourly low of $4653.93. A sharp increase ensued, followed by a gradual decrease. The price has made several higher lows.
Tracing these lows gives us an ascending support line:
On Apr 4, Bitcoin made an hourly high of $5074.63. It has been increasing since, making several higher highs.
Tracing these highs gives us an ascending resistance line.
The resistance and support lines combine to create an ascending channel:
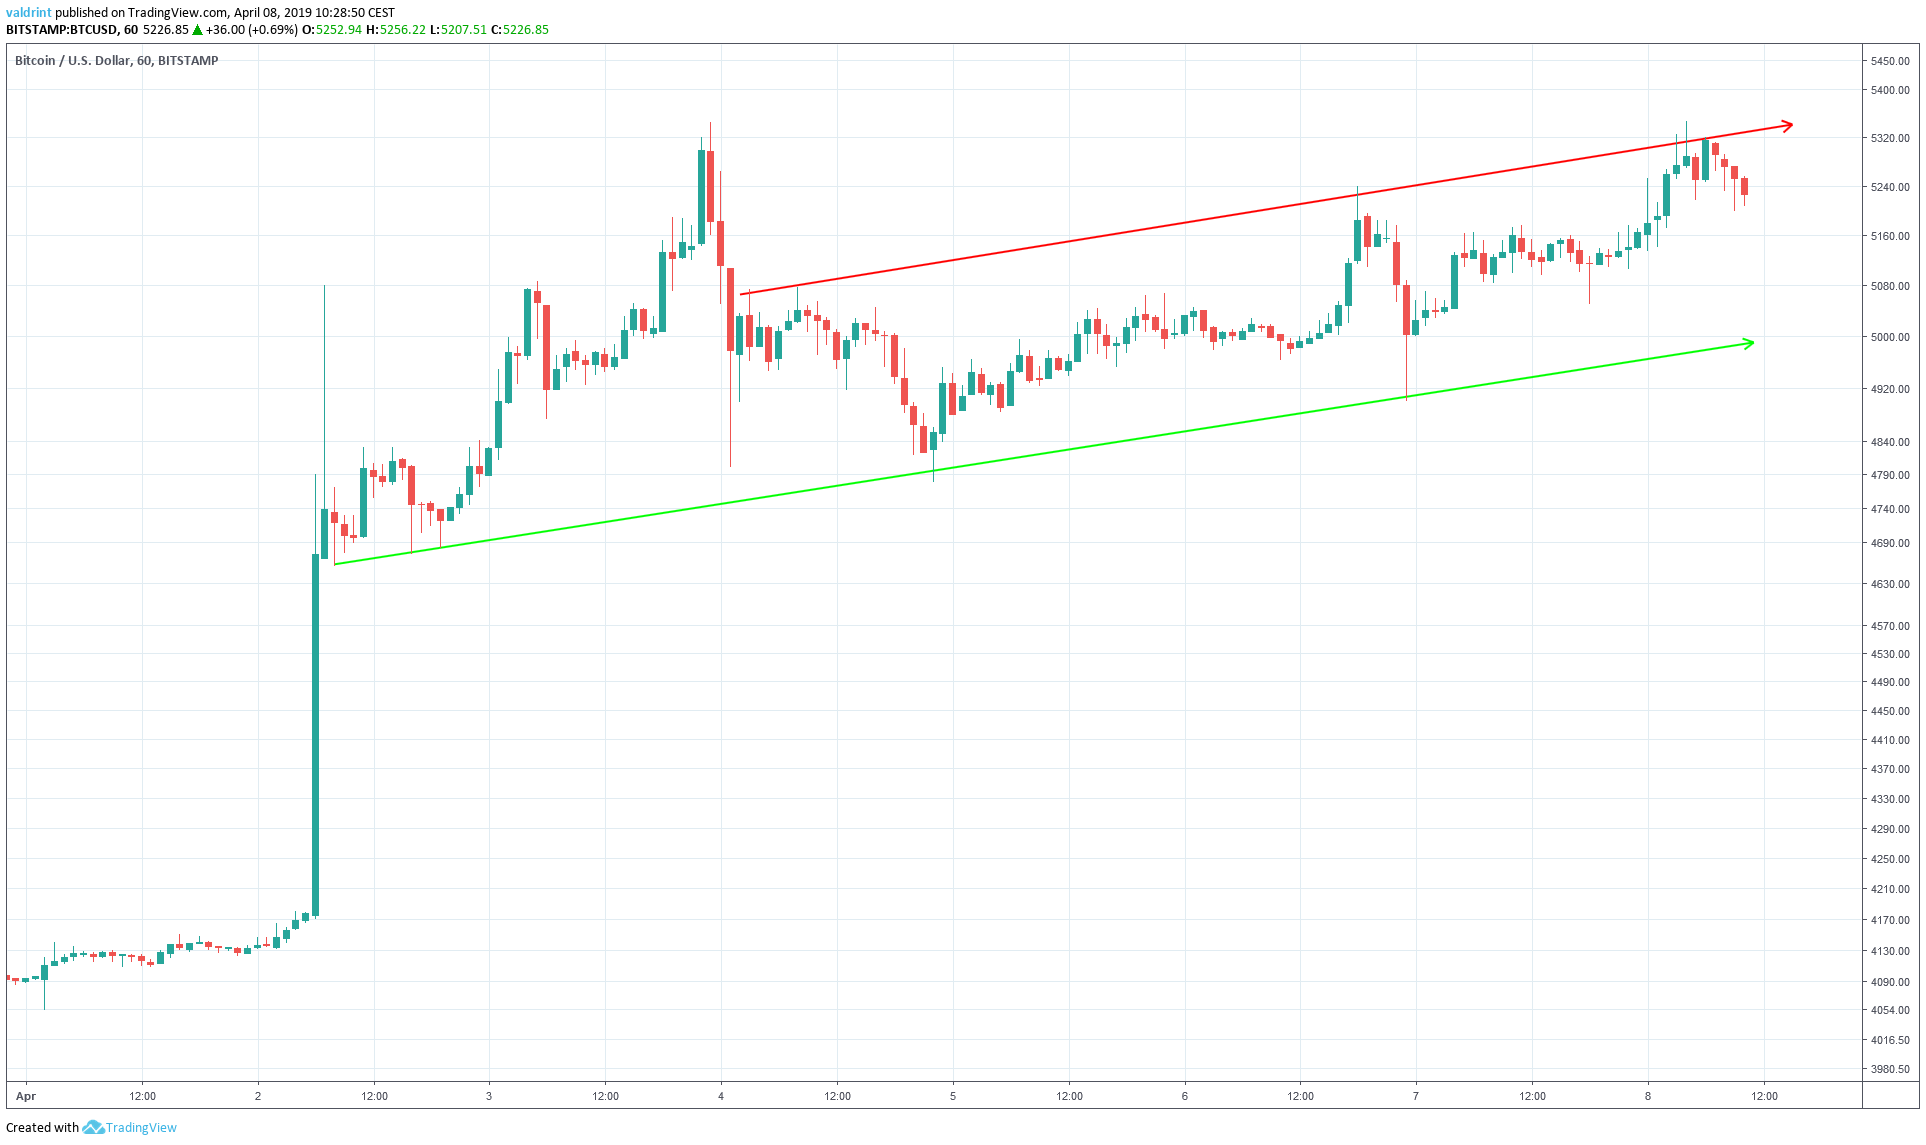
Given the current position of BTC/USD near the resistance line, the price may drop toward the support line. This would generate possible short-term losses.
However, as long as Bitcoin continues trading within this channel, long-term gains should also be expected.
It is also possible that decisive movement could lead to a breakout above resistance or a breakdown below support.
Click for April Bitcoin Predictions!
Relative Strength Inex
To better assess future price fluctuations, we incorporate technical indicators into the analysis. We begin with the relative strength index.
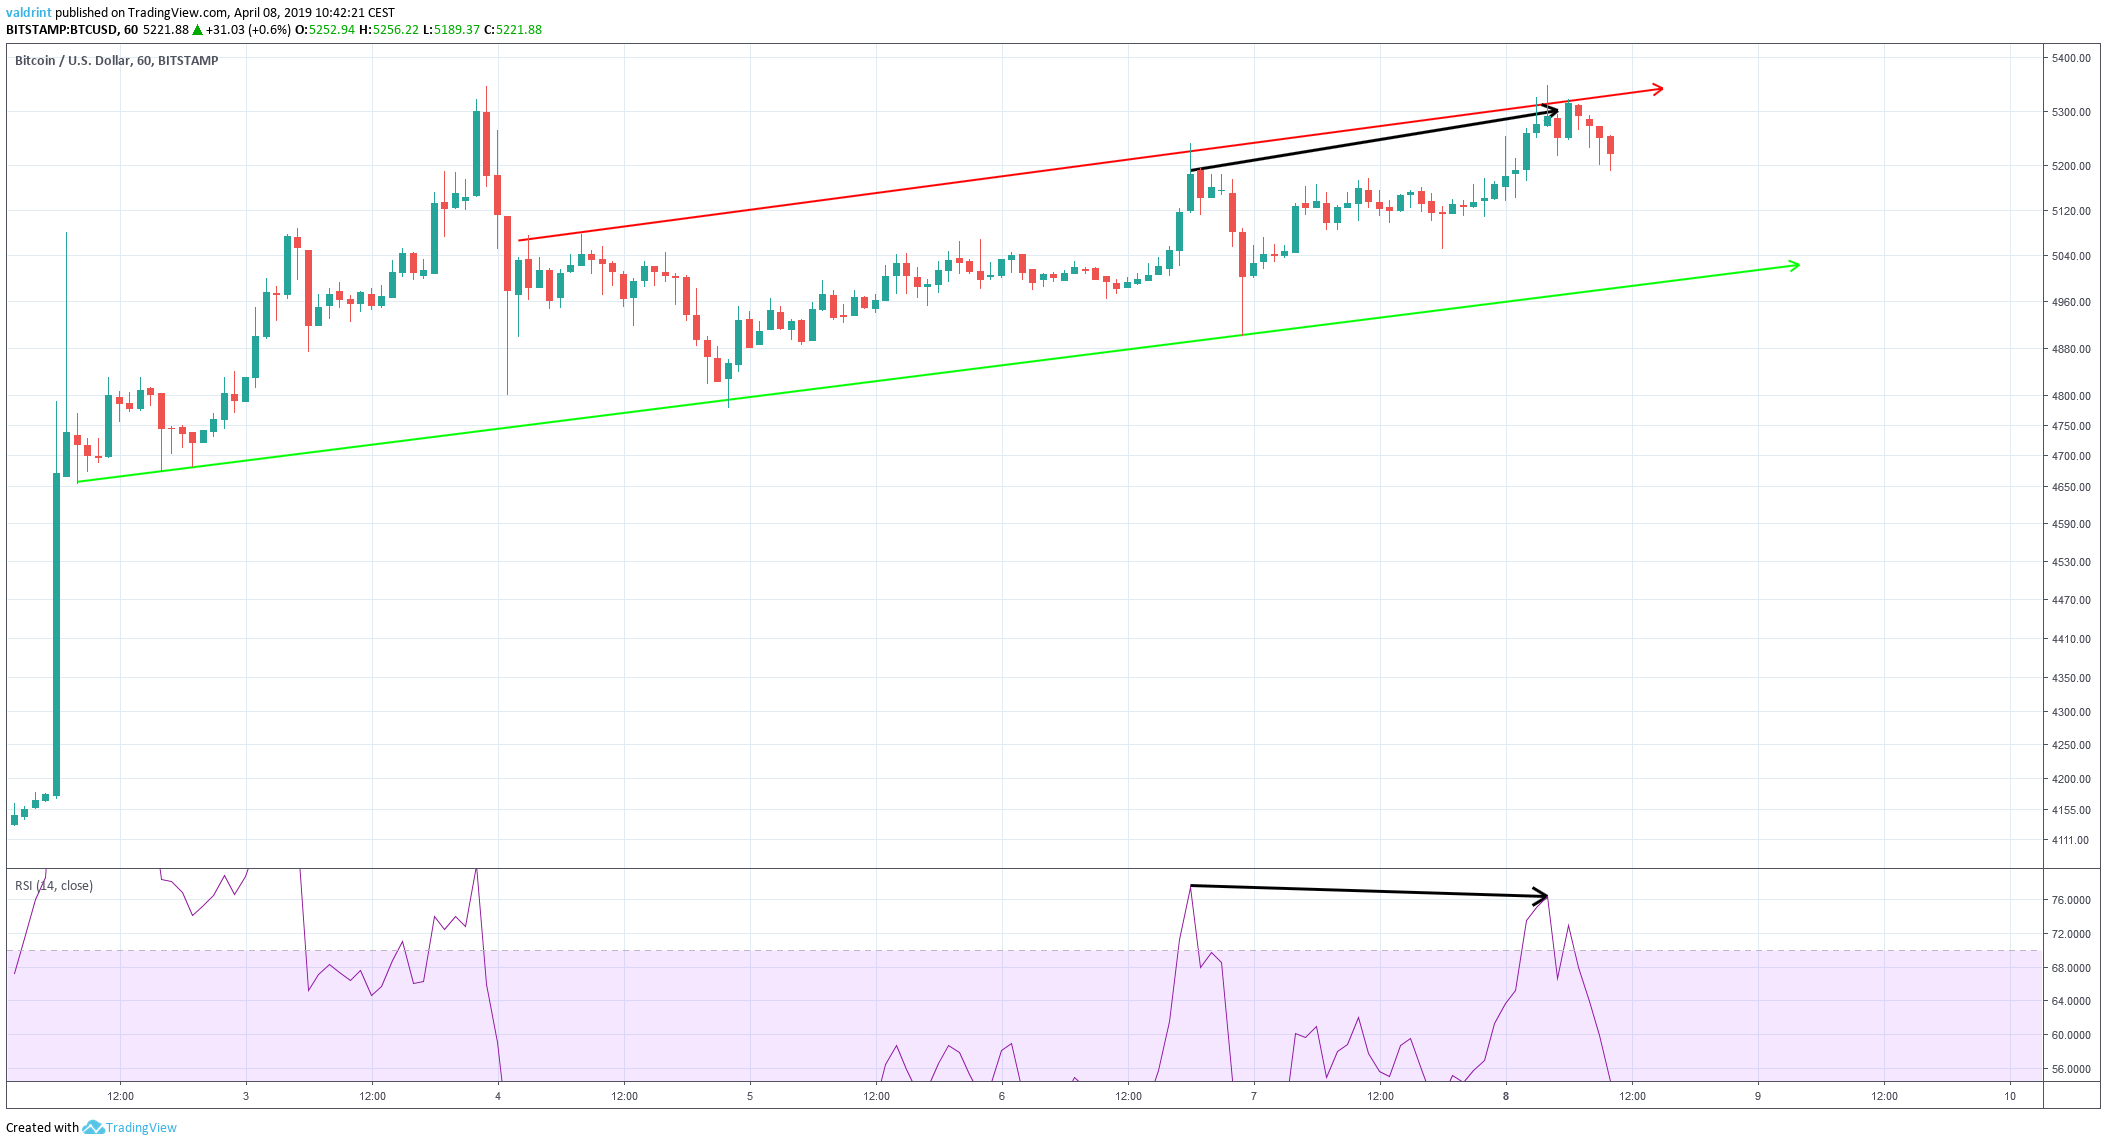
On Apr 6, the price made a high of $5240. It continued to create a higher high on Apr 8.
Similarly, the RSI made the first high on Apr 6. However, it has proceeded to generate lower values since.
This is known as bearish divergence and often precedes price decreases.
Using this indicator, it is likely that the price will drop to the support line of the channel.
Reversal Areas
We now incorporate support and resistance areas to determine actual possible future price levels.
The closest support area is found near $4800. A second support area is found near $4680. Both of these are below the channel and could only be reached in the event of a breakdown. While we do believe a drop to support is likely, we do not necessarily believe a breakdown to be likely.
The closest resistance area is found near $5320. It coincides with the resistance line of the channel. Bitcoin recently traded within this level. However, the price now appears to be dropping from this level.
This level could be reached in the future without a breakout. After losses toward the support line, a reversal may bring prices back toward this resistance area.
Summary of Analysis
Based on this analysis, the price of BTC is likely to drop to the support line of the channel in the short term. It is not necessarily likely that a breakdown will occur.
Following a drop in price, a reversal will likely bring prices back toward the $5320 range in the longer term.
Do you think BTC will keep increasing or breakdown? Let us know your thoughts in the comments below!
Click for 2019 BTC Predictions!
Disclaimer: This article is not trading advice and should not be construed as such. Always consult a trained financial professional before investing in cryptocurrencies, as the market is particularly volatile.


