


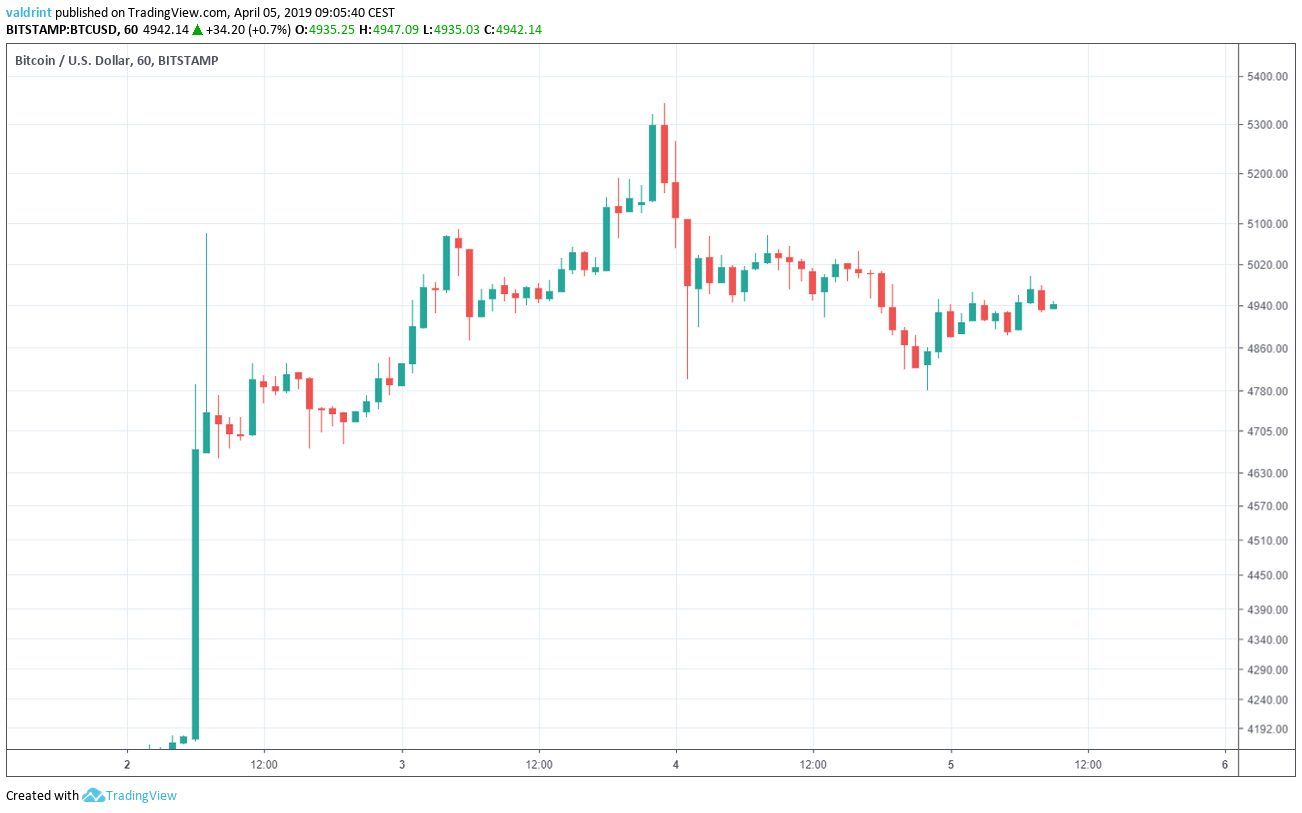
On Apr 2, 2019, Bitcoin (BTC) began an upward move which took it from $4169.17 to $4790 within an hour.
On Apr 3, it made a high of $5345.
The price has been gradually decreasing since. It fell below $5000 on Apr 4. At the time of writing on Apr 5, Bitcoin was struggling to reach the $5000 level.
Bitcoin (BTC): Trends and Highlights For April 5
- BTC/USD has been trading inside a descending channel since Apr 3.
- Also on Apr 3, a bearish cross emerged.
- There is resistance near $5080 and support near $4800 and $4700.
Ascending Channel
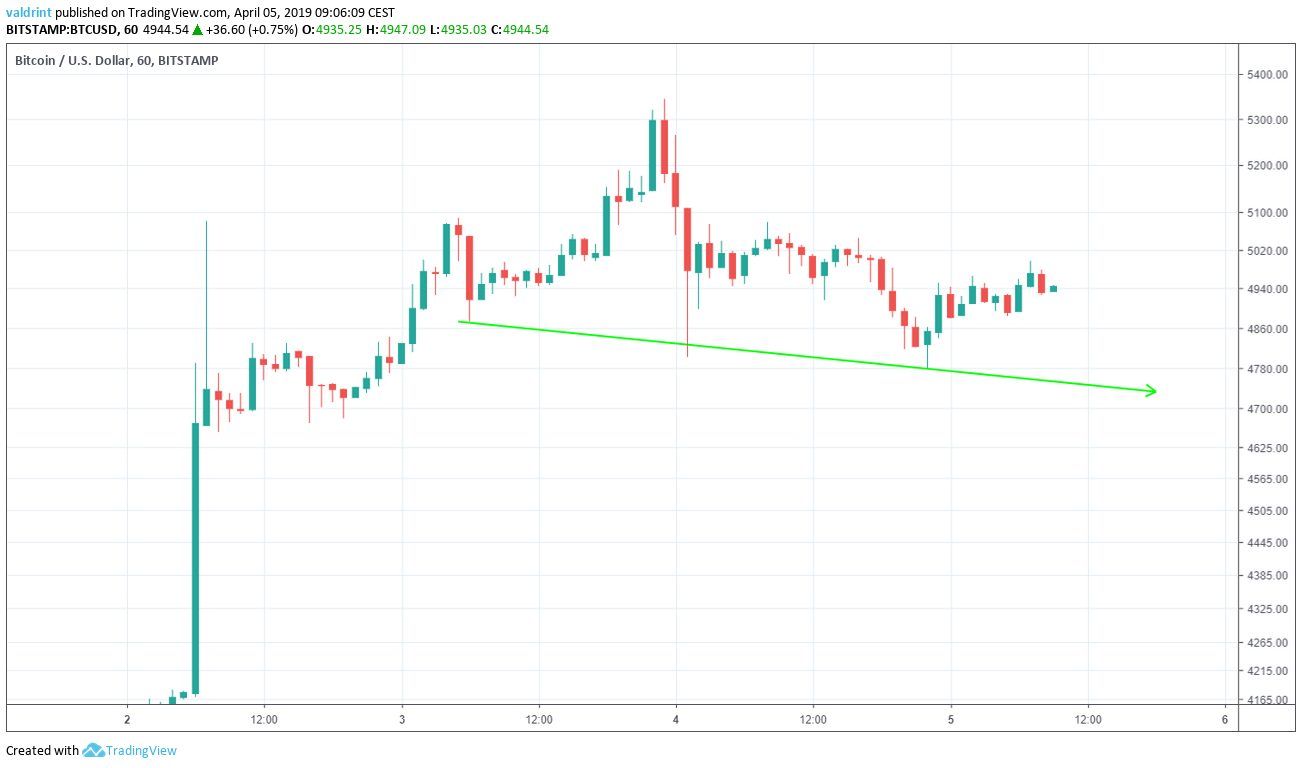
On Apr 3, the price made an hourly low of $4872.96. A sharp increase ensued, followed by a gradual decrease. The price has made several lower lows.
Tracing these lows gives us a descending support line:
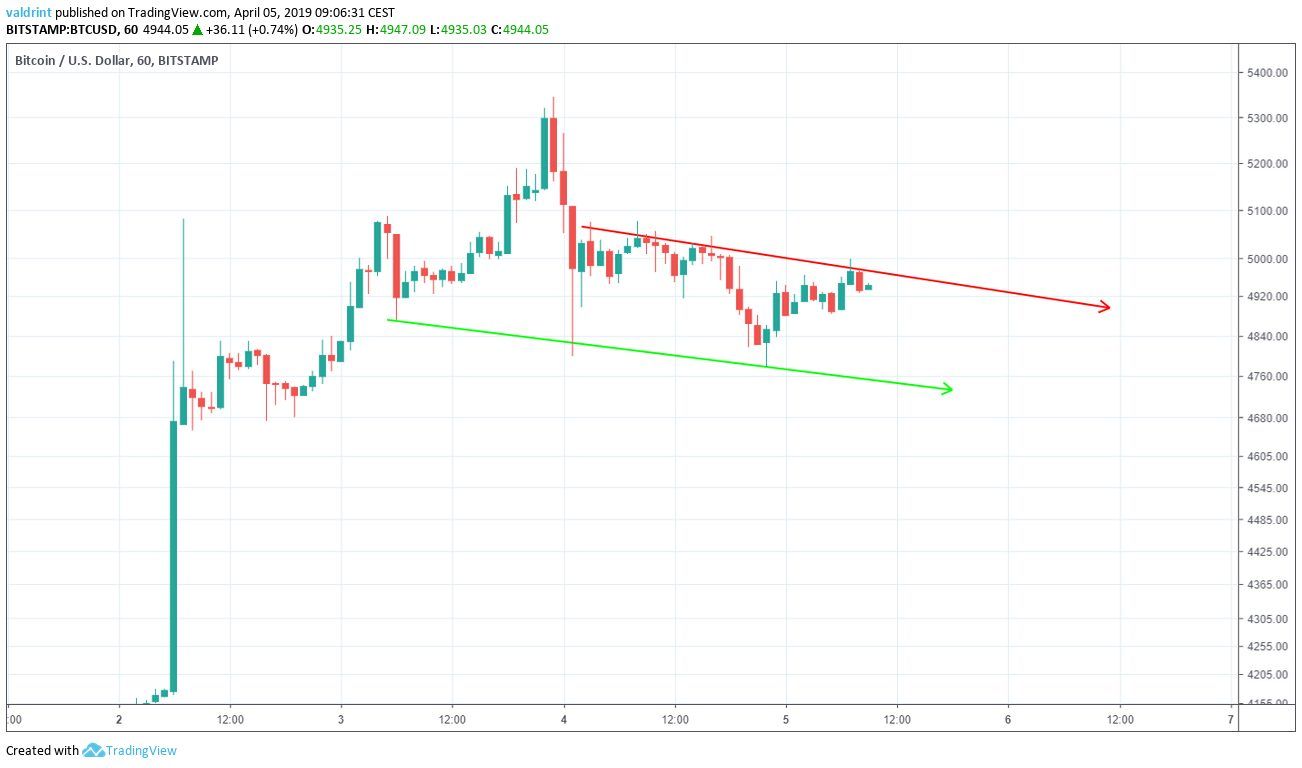
On Apr 3, Bitcoin made a high of $5345. It has been decreasing since, making several lower highs. Tracing these highs gives us a descending resistance line.
The resistance and support lines combine to create a descending channel:
Click for Full BTC April Analysis!
Moving Averages
To better assess future price fluctuations, we incorporate technical indicators into the analysis. We begin with moving averages.
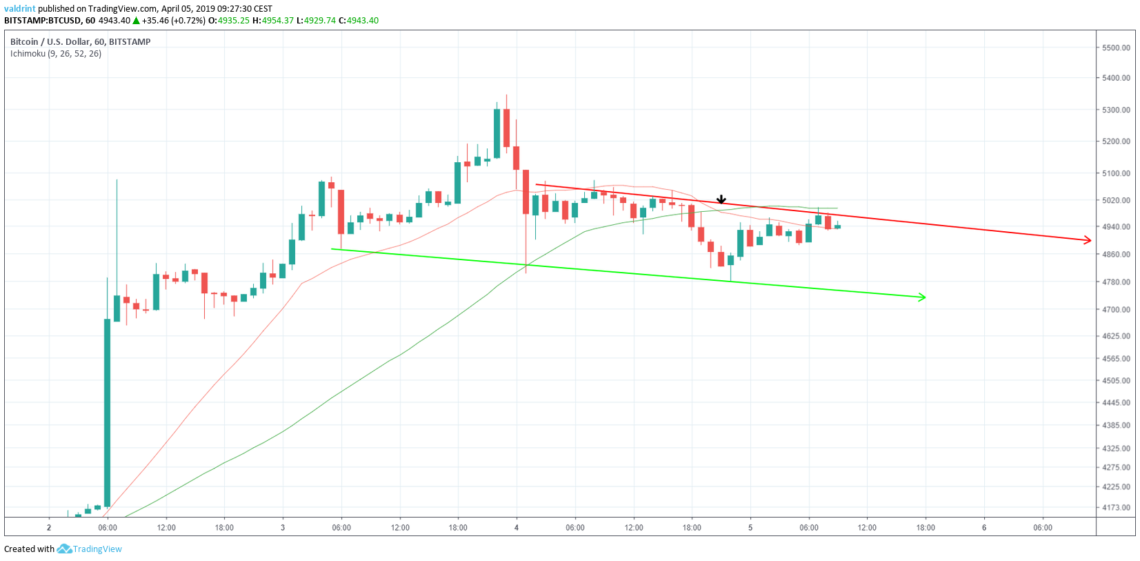
On Apr 4, the 21-period crossed below the 50-period one. This is known as a bearish cross, indicating that the uptrend may be over. It appears as if a new downtrend has begun.
This is the first bearish cross since the upward move on Apr 2.
Using this indicator, it is likely that the price will keep decreasing at the rate predicted by the channel. Because the price of BTC/USD has also recently touched the resistance line, a return to the support is likely. This could signify both short-term and longer term price losses.
Reversal Areas
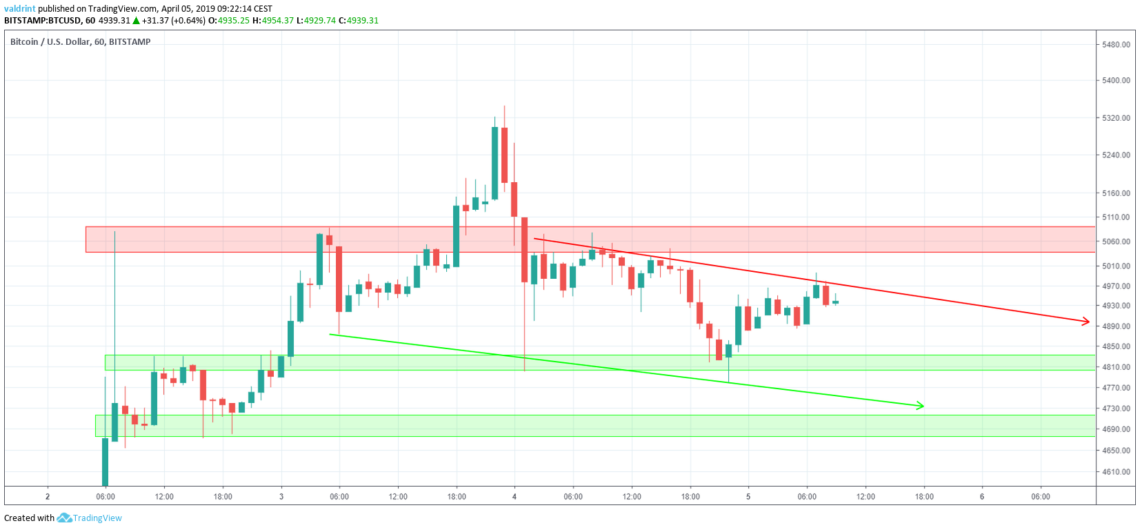
The closest support area is found near $4800. This support is found within the current channel making a price drop to this level likely.
A second support area is found near $4700. If price continues along this downward trend, this level will also soon be reachable within the channel traced above.
It is likely that the price will continue to decrease at the rate predicted by the channel and drop to or below $4800 by next week.
The closest resistance area is found near $5080. If a breakout were to occur, it would provide a likely reversal area. We do not believe this to be a possible scenario but not the most likely.
However, a false breakout to this resistance area may precede a drop toward the support areas.
Summary of Analysis
Based on this analysis, the price of BTC is likely to keep decreasing at a steady rate and reach the support areas outlined above. Prices as low as $4800 or $4700 are possible.
Do you think BTC will drop towards the second support area? Let us know your thoughts in the comments below!
Click for 2019 BTC Predictions!
Disclaimer: This article is not trading advice and should not be construed as such. Always consult a trained financial professional before investing in cryptocurrencies, as the market is particularly volatile.


