


On Apr 2, the price of BTC began a rapid upward move, which took it to a high of $5106 and €4745. Since then, it has been gradually increasing, reaching highs of $5690 and €5069 on Apr 24.
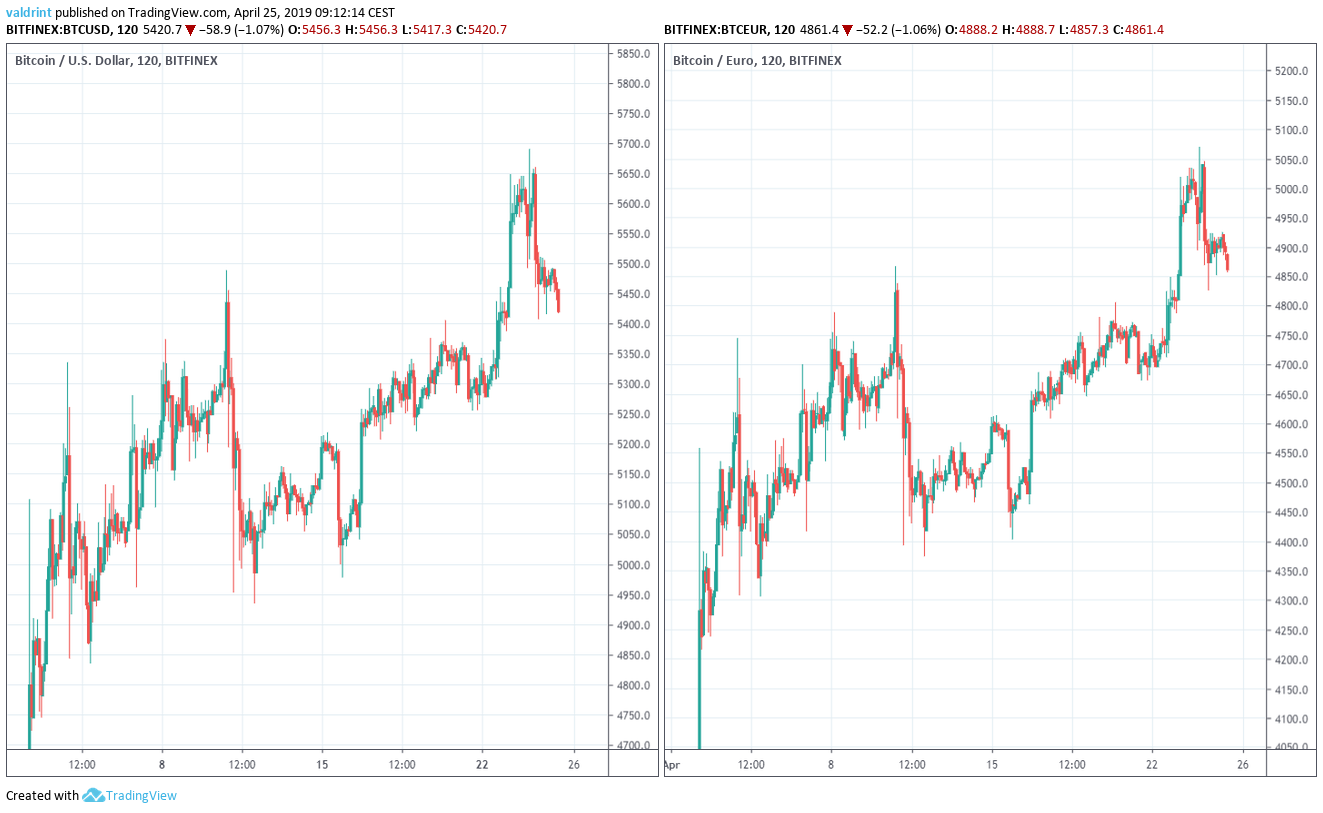
A sharp decrease took it to levels close to $5400 and €4900. Bitcoin is continuing to trade around this level.
Will prices rise even further or continue dropping?
Let’s find out:
Bitcoin (BTC): Trends and Highlights For April 25, 2019
- Both BTC/USD and BTC/EUR began a rapid upward move on Apr 2.
- Bitcoin been trading inside an ascending channel since Apr 4.
- Currently, it is trading very close to the resistance line of the channel.
- Bearish divergence is developing in the RSI.
- There is resistance near $5650/€5000 and $6250/€5350.
A Look at the Current Trading Pattern
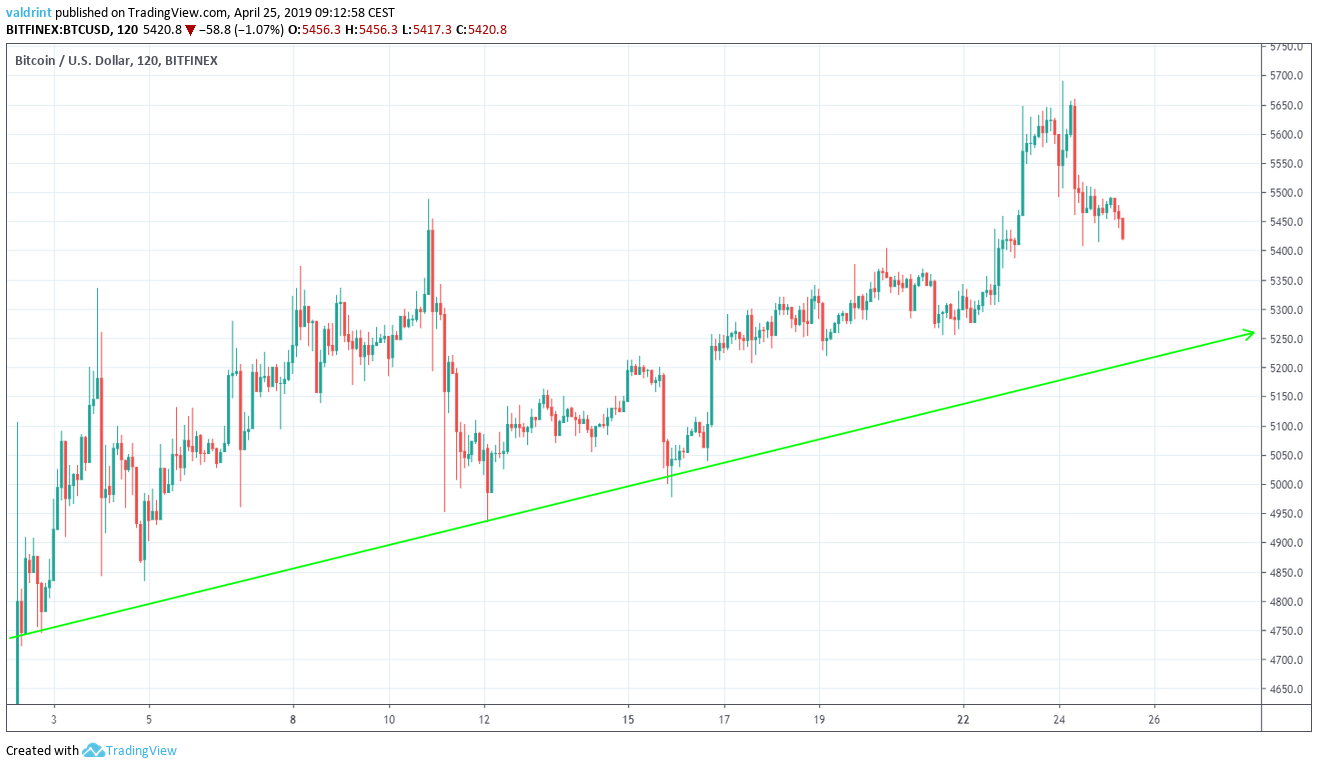
On Apr 11, the price made an hourly low of $4723.10. A gradual increase was followed by a gradual decrease. The price has made several higher lows during this period.
Tracing these lows gives us an ascending support line:
On Apr 3, Bitcoin made a high of $5335.50. Several market cycles have been completed. The price has made successively higher highs in the process.
Tracing these highs gives us an ascending resistance line. The resistance and support lines combine to create an ascending channel:
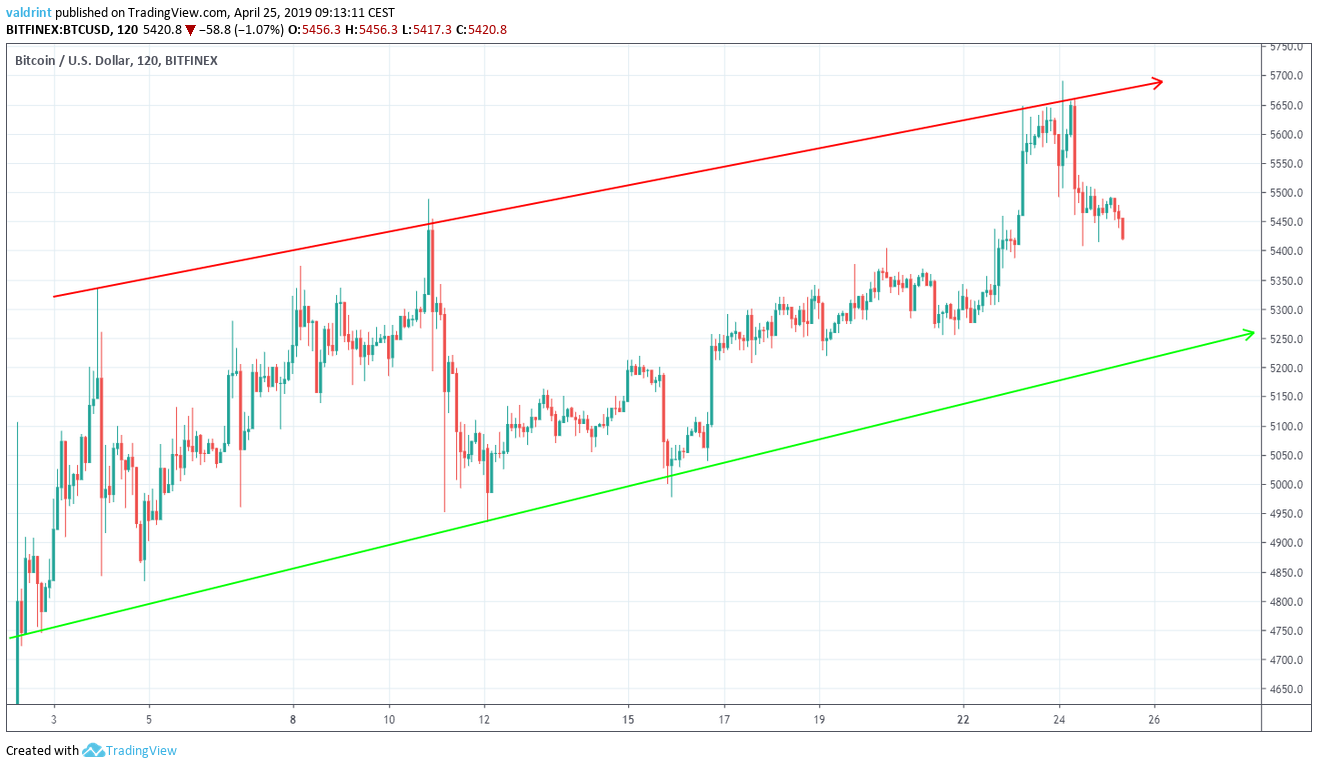
It is likely that the price will increase at the rate predicted by the channel until a decisive move occurs.
In order to predict the direction of the movement, a look at technical indicators and a longer time-frame is required.
APRIL BITCOIN PREDICTIONS!
Technical Indicators
To better assess future price fluctuations, we analyze the price of BTC from Apr 20 to 25 alongside the RSI and the MACD.
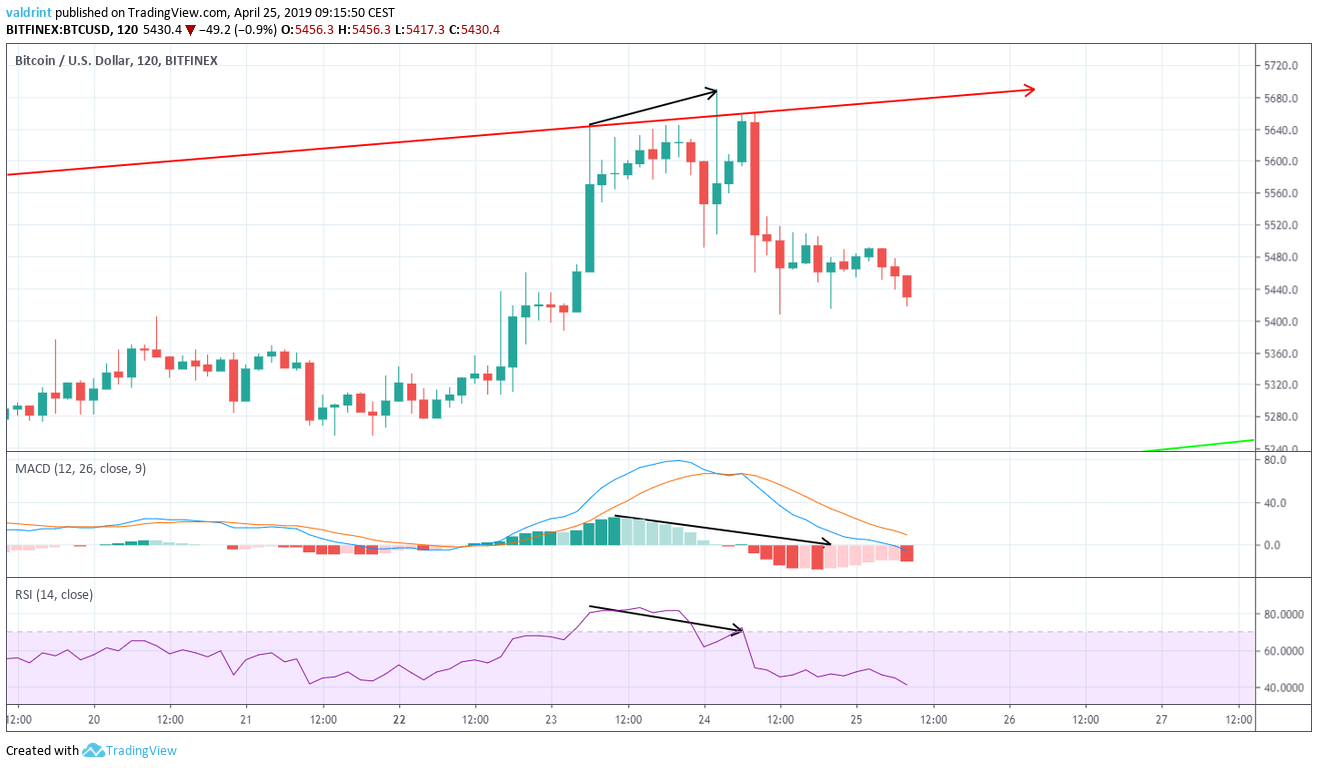 On Apr 23, the price made a high of $5647.4. It continued to increase and on Apr 24 it made a high of $5690.
Similarly, the RSI and the MACD made the first high on Apr 23. However, they have proceeded to generate lower values. This is known as bearish divergence and often precedes price decreases.
Using these indicators, it is likely that the price will decrease towards the support line of the channel.
Reversal Areas
To better determine reversal levels in the event that the price does not drop all the way to the support line, we incorporate support area into this part of the analysis.
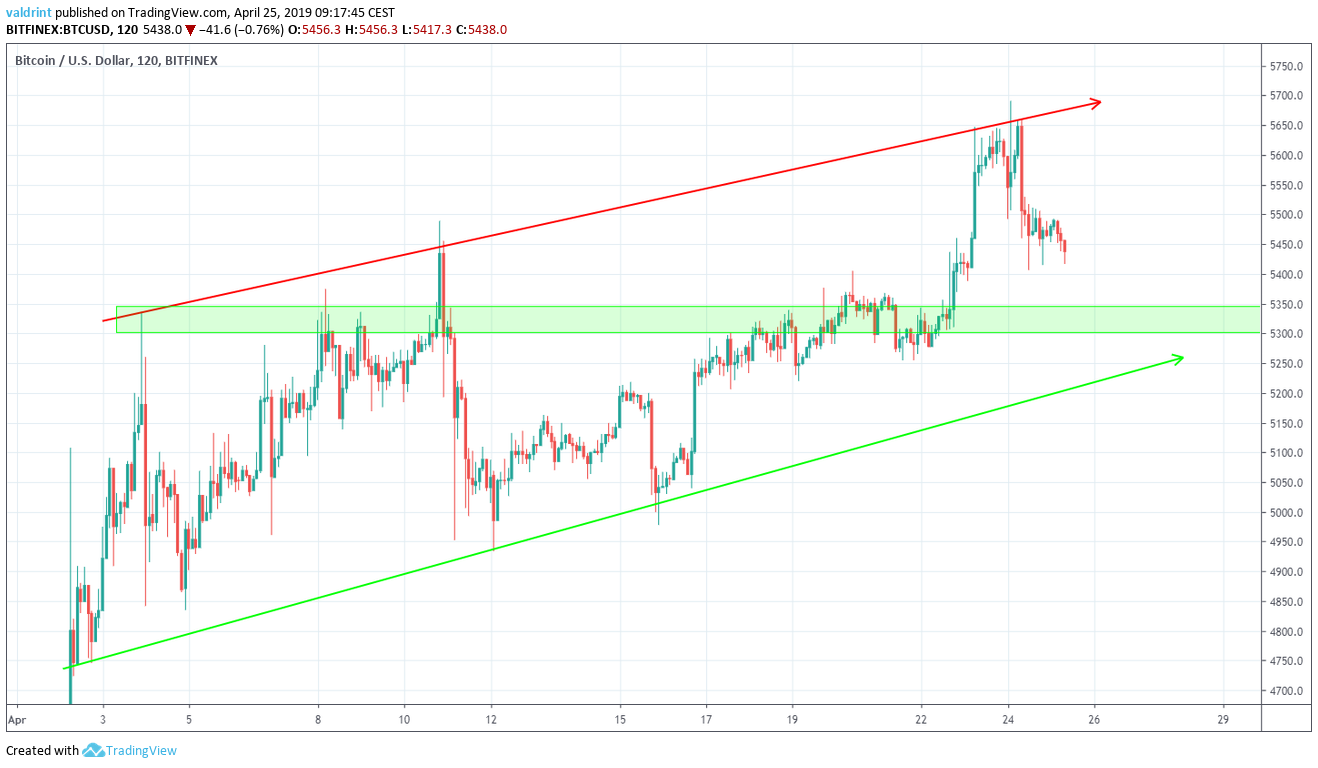
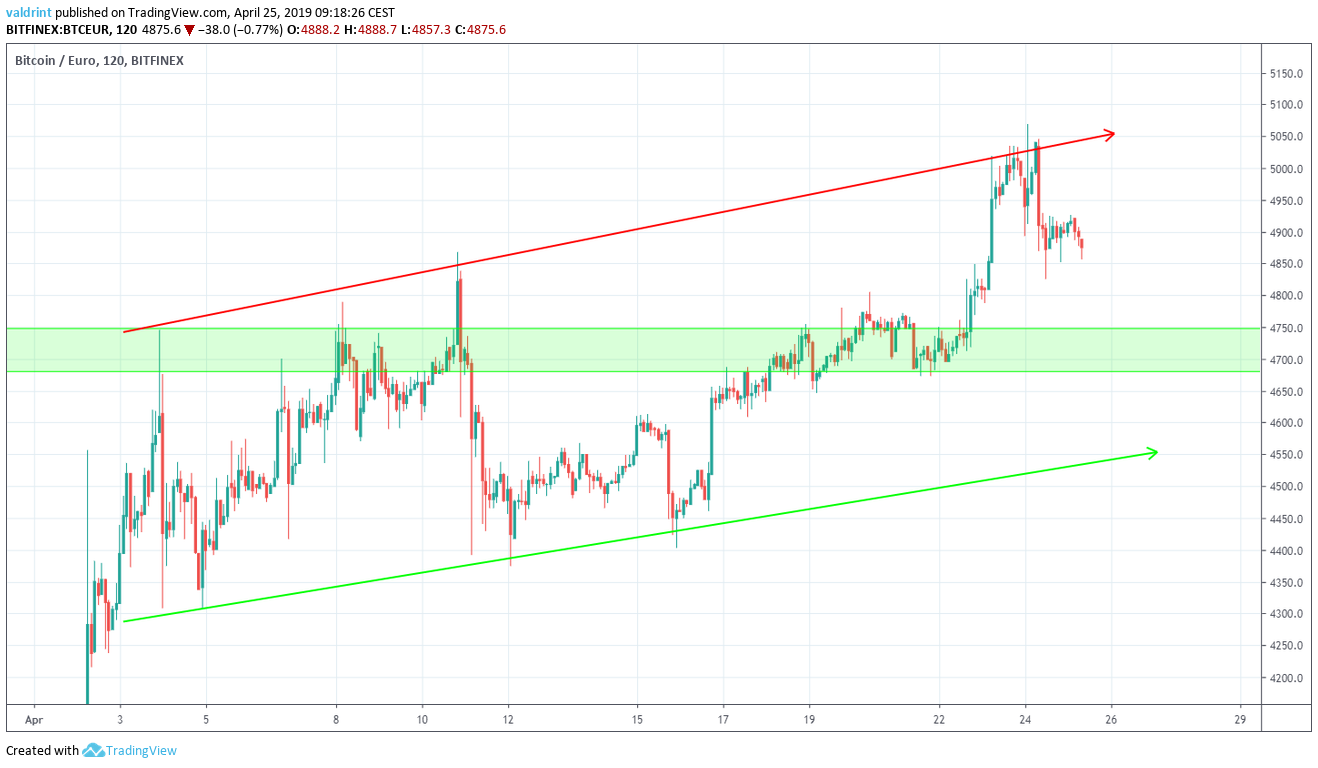
This support area is near $5300 and €4700. We believe the price will soon reach this area.
Conclusion and Summary
Bitcoin is currently trading within an upward facing channel. While this suggests long-term price gains, Bitcoin is also trading near the resistance line of the trading pattern. This suggests that short-term losses could lead to prices around $5300/€4700.
Interested in 2019, 2020, and 5 year Bitcoin price predictions? Click on the green button below:
Do you think BTC will keep trading inside the channel? Let us know your thoughts in the comments below!
Disclaimer: This article is not trading advice and should not be construed as such. Always consult a trained financial professional before investing in cryptocurrencies, as the market is particularly volatile.


