


On Feb 6, 2019, Bitcoin (BTC) made a low of $3328. It has been on an uptrend since.
Gradual price increases accelerated in early April. On Apr 2 and 3, daily highs of over $5000 were reached.
We discuss these price gains in our latest “Bitcoin Major Market Update”:
https://www.youtube.com/watch?v=LMVAQcJ0SEc&feature=youtu.be
Now that we know Bitcoin has spiked to over $5000, what will happen next?
In this analysis, we hope to answer this question while offering reasonable price predictions for the near future.
Bitcoin (BTC): Trends and Highlights For April 3
- BTC/USD had been trading inside an ascending triangle since Feb 12
- Bitcoin broke out from the triangle on Apr 2.
- Bearish divergence is developing in the RSI and the MACD.
- There is support near $4500-$4600 and resistance near $5200.
Ascending Triangle
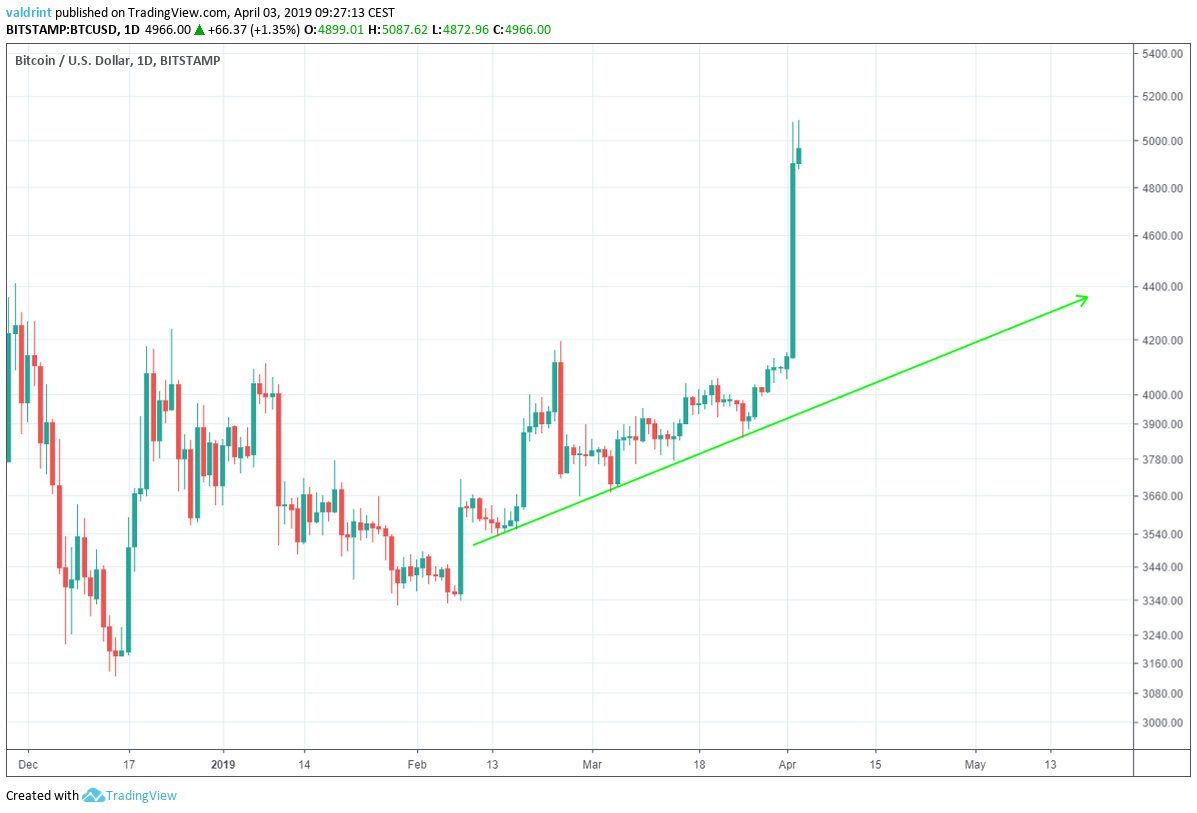
On Feb 14, the price made a low of $3531.01. A sharp upward move began. This was followed by a slight decrease.
The price has been on a gradual uptrend since, with each low being higher than the previous one. Tracing these lows gives us an ascending support line:
On Dec 1, 2018, Bitcoin made a high of $4264.67. Since then, several market cycles have been completed and the price has reached the same level several times.
Tracing these highs gives us a horizontal resistance line.
The resistance and support lines combine to create an ascending triangle:
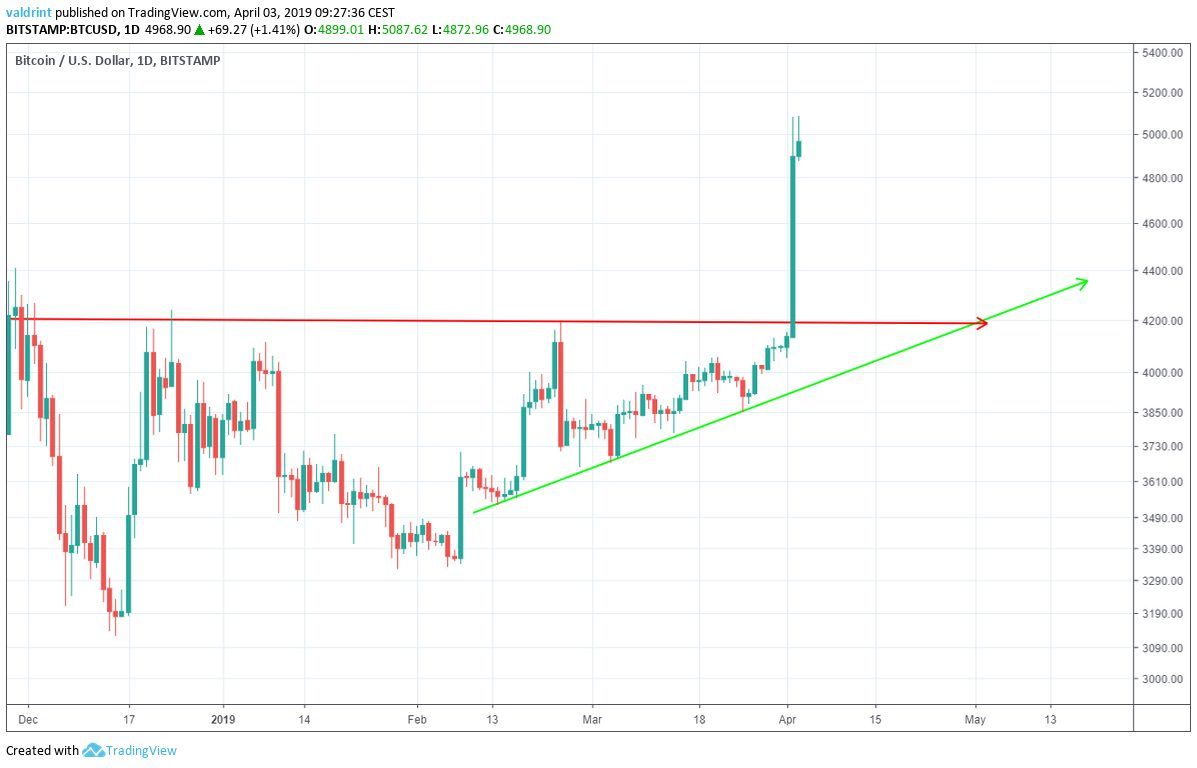
Bitcoin broke out from the triangle on Apr 2, 2019 when it skyrocketed to $5000 (learn more here).
Bearish Divergence
To better assess future price fluctuations, we incorporate technical indicators into the analysis.
The relative strength index (RSI) is an indicator which calculates the size of the changes in price in order to determine oversold or overbought conditions in the market.
The moving average convergence divergence (MACD) is a trend indicator that shows the relationship between two moving averages (long and short-term) and the price. It is used to measure the strength of a move.
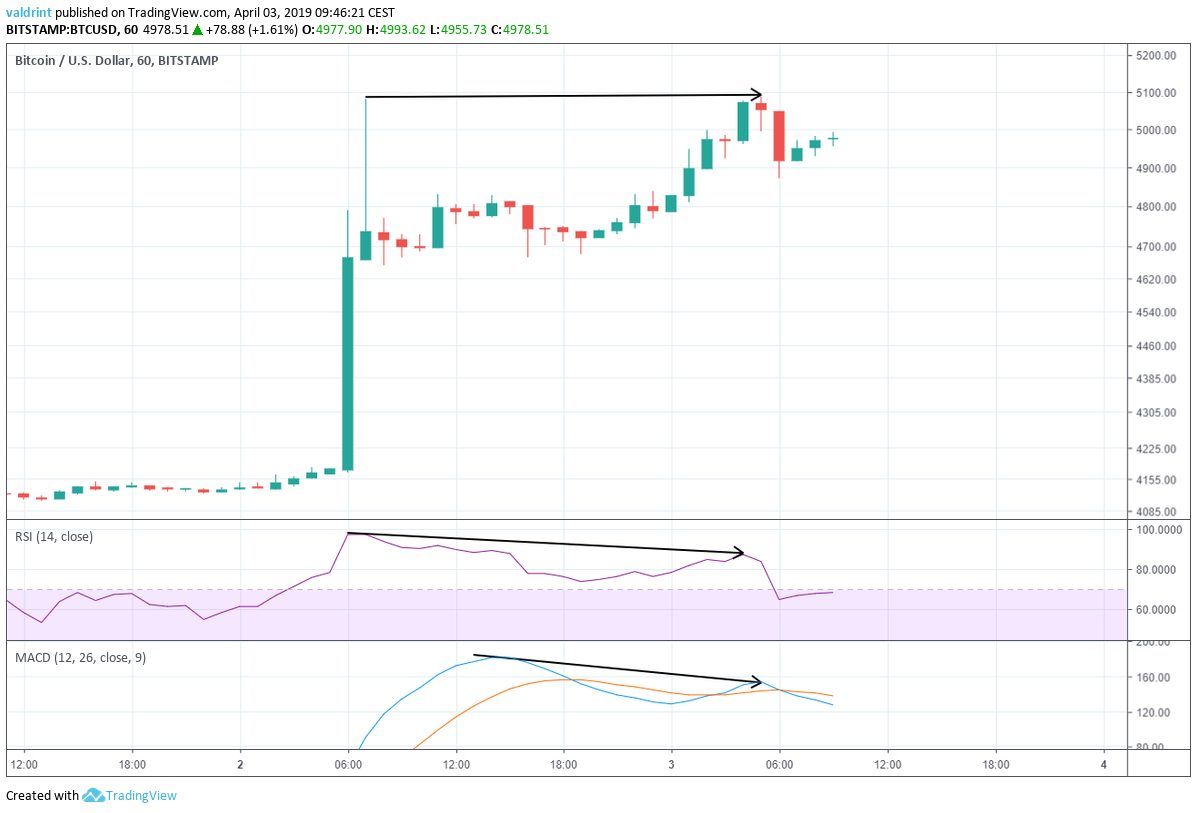
On Apr 2, the price reached a high of $5080. It reached the same level again on Apr 3.
Similarly, the RSI and the MACD made the first high on Apr 2. However, they have proceeded to generate lower values since.
This bearish divergence often precedes price decreases. As suggested in the video above, we may be seeing pushback from recent gains. Bitcoin may enter into a corrective period, but this does not annul the possibility of long-term gains past $5000.
Reversal Areas
A Fibonacci retracement is a term used to refer to areas of support or resistance. Fibonacci retracement levels present horizontal lines that indicate possible resistance and support levels.
We trace these to help determine future possible prices in the likely event that Bitcoin enters into a corrective period in the short-term.
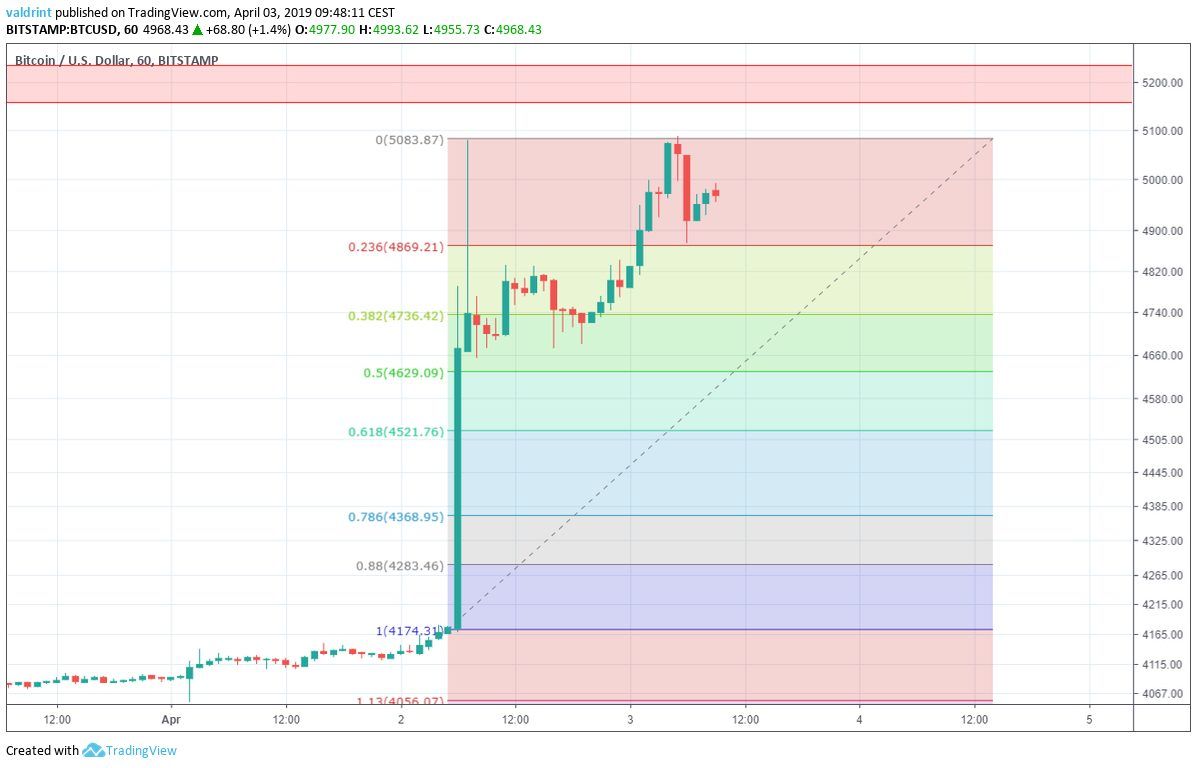
In the graph above, the most common retracement area is the one between 0.5 and 0.618.It falls between $4521-$4629.
If the price starts to decrease, this is a likely reversal area.
The closest resistance area is found near $5200. After a price drop to around the mid-$4000 range, Bitcoin may commence an upward trend and reach this level.
Summary of Analysis
Based on this analysis, the price of BTC is likely to undergo a slight correction and decrease to the area outlined above before a subsequent increase that should bring Bitcoin to around $5200. It is not yet clear on what time-table this will occur.
Do you think BTC will drop towards the support area? Let us know your thoughts in the comments below!
Disclaimer: This article is not trading advice and should not be construed as such. Always consult a trained financial professional before investing in cryptocurrencies, as the market is particularly volatile.


