
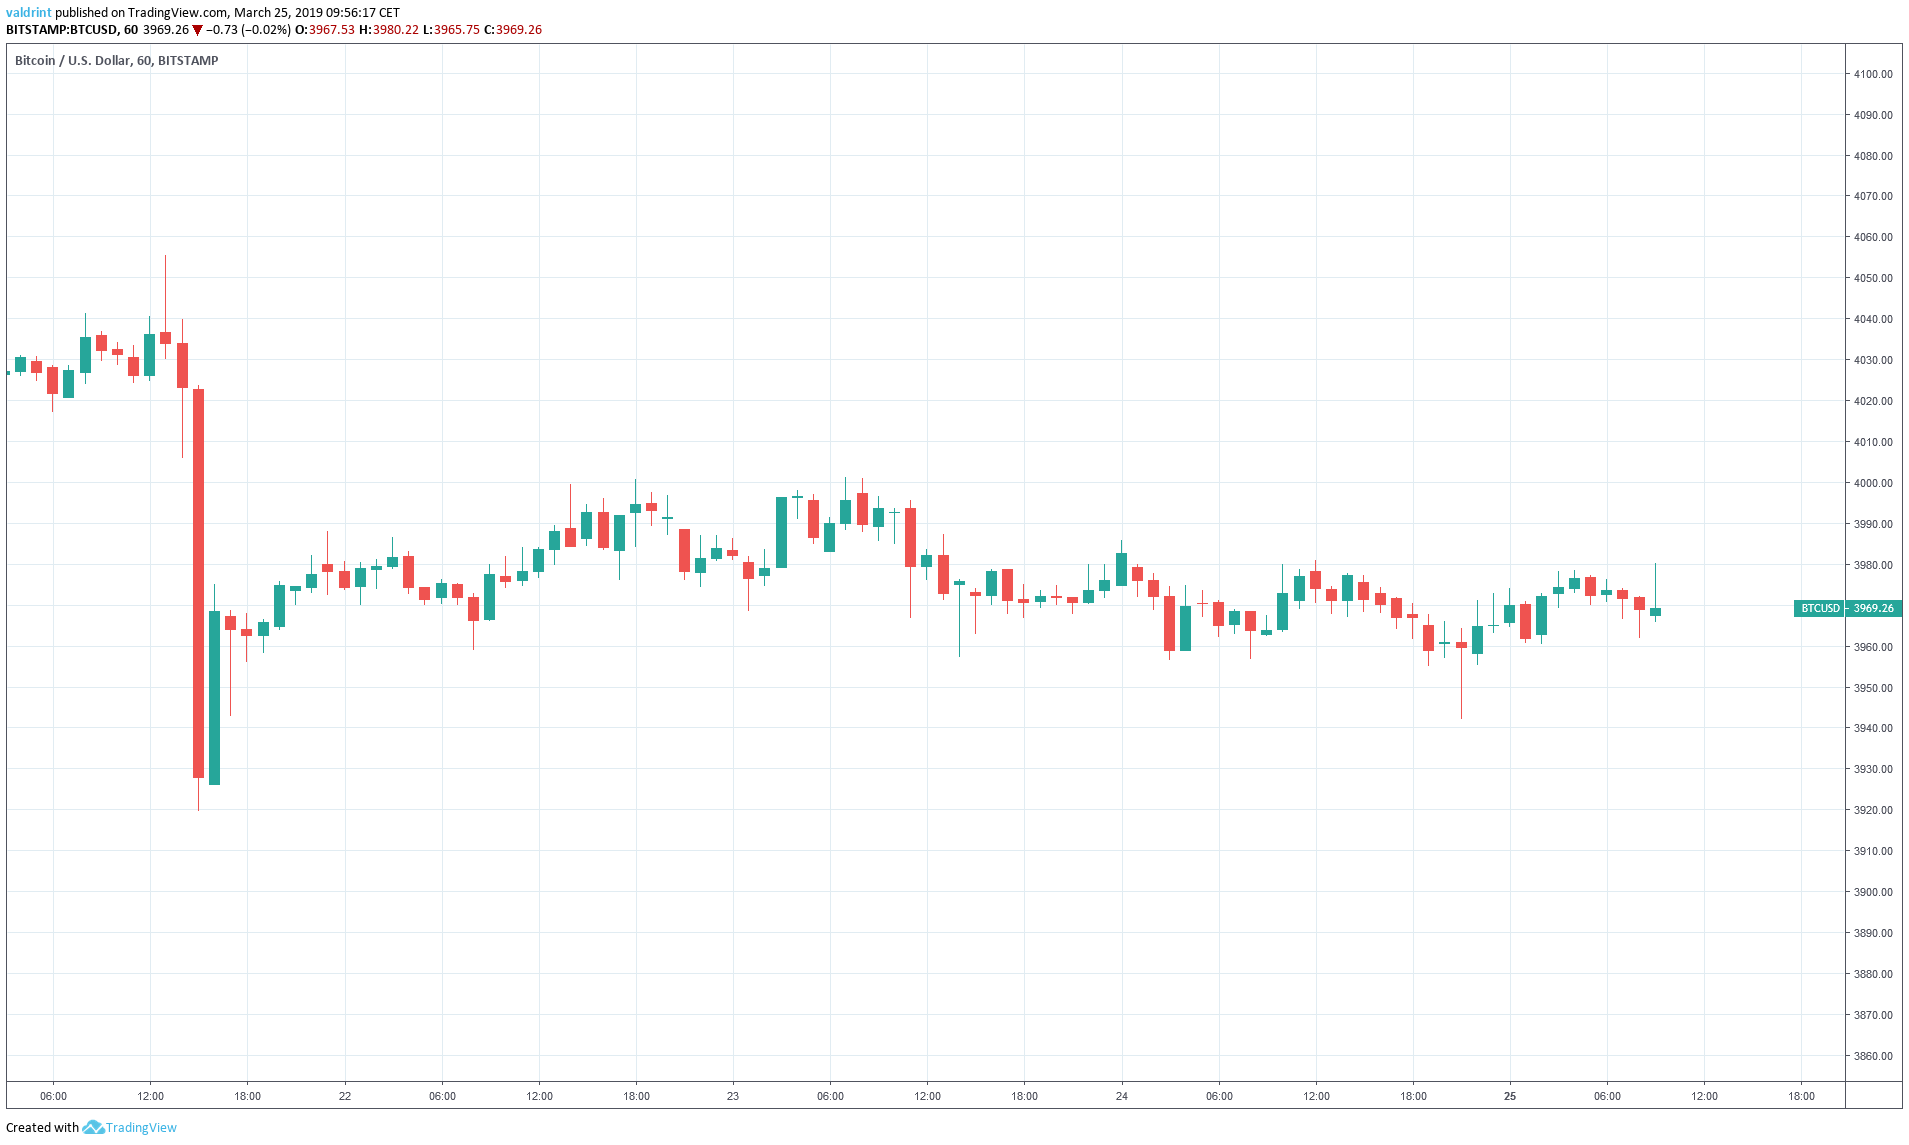
On March 21, 2019, Bitcoin (BTC) made a high of $4055 before a sharp drop took it to a low of $3919 in a matter of hours. It has been trading between these two values since, without experiencing significant volatility.
Will volatility return to BTC? Are prices going up or down?
 Based on today’s analysis it is likely that the price keeps trading within a horizontal channel we’ve defined below. Bitcoin will likely see gains and losses within this channel until a decisive move upward or downward. We believe a breakdown is slightly more likely—which could mean price losses.
Bitcoin (BTC): Trends and Highlights For March 25, 2019
- The price of Bitcoin has been on a downtrend since Mar 21.
- BTC is trading inside a horizontal channel.
- There is bullish divergence developing in the RSI.
- The price is trading inside a longer term ascending wedge.
- There are support areas near $3840 and $3680 and $3340.
- There is resistance near $4120.
Horizontal Support
The price of BTC on BitStamp is analyzed at one-hour intervals from Mar 21 to Mar 25. On Mar 21, the price made a low of $3942. It closed near $3960. A gradual uptrend ensued. The price dropped to the same level several times. Tracing these lows gives us a horizontal resistance line. The support line acts as a floor to price, preventing further downward movement. It traces the theoretical lower limits of the price.
It is unlikely that the price trades below these levels unless a breakdown with significant longitudinal losses occurs. Thus, the wick breakdown of $3942 on Mar 24 can be considered insignificant since it was not supported by continuous losses.
It is likely that the price will keep trading above this line unless a breakdown occurs. The support line alone is not sufficient in predicting when that breakdown will occur.
The support line acts as a floor to price, preventing further downward movement. It traces the theoretical lower limits of the price.
It is unlikely that the price trades below these levels unless a breakdown with significant longitudinal losses occurs. Thus, the wick breakdown of $3942 on Mar 24 can be considered insignificant since it was not supported by continuous losses.
It is likely that the price will keep trading above this line unless a breakdown occurs. The support line alone is not sufficient in predicting when that breakdown will occur.
Horizontal Channel
On Mar 22, the price made a high of $4000. A gradual drop ensued. The same level was reached three times. Tracing these highs gives us a horizontal resistance line: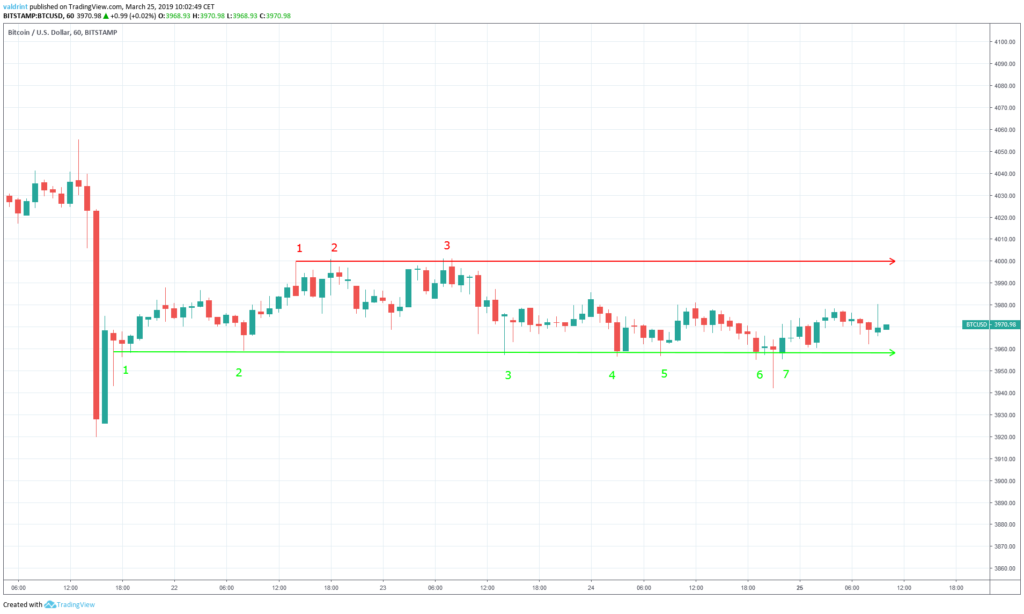 Similar to the support line, the resistance line can act as a ceiling to price, preventing further upward movement.
The resistance and support lines combine to create a horizontal channel, which is a neutral pattern, making price increases and decreases equally likely within the channel.
It is likely that the price will trade inside the confines of this channel until a breakdown or breakout occurs.
Similar to the support line, the resistance line can act as a ceiling to price, preventing further upward movement.
The resistance and support lines combine to create a horizontal channel, which is a neutral pattern, making price increases and decreases equally likely within the channel.
It is likely that the price will trade inside the confines of this channel until a breakdown or breakout occurs.
Developing Divergence
The relative strength index (RSI) is an indicator which calculates the size of the changes in price. It helps to determine oversold or overbought conditions in the market. Combining RSI bullish/bearish divergence with support/resistance essentially predicts price fluctuations.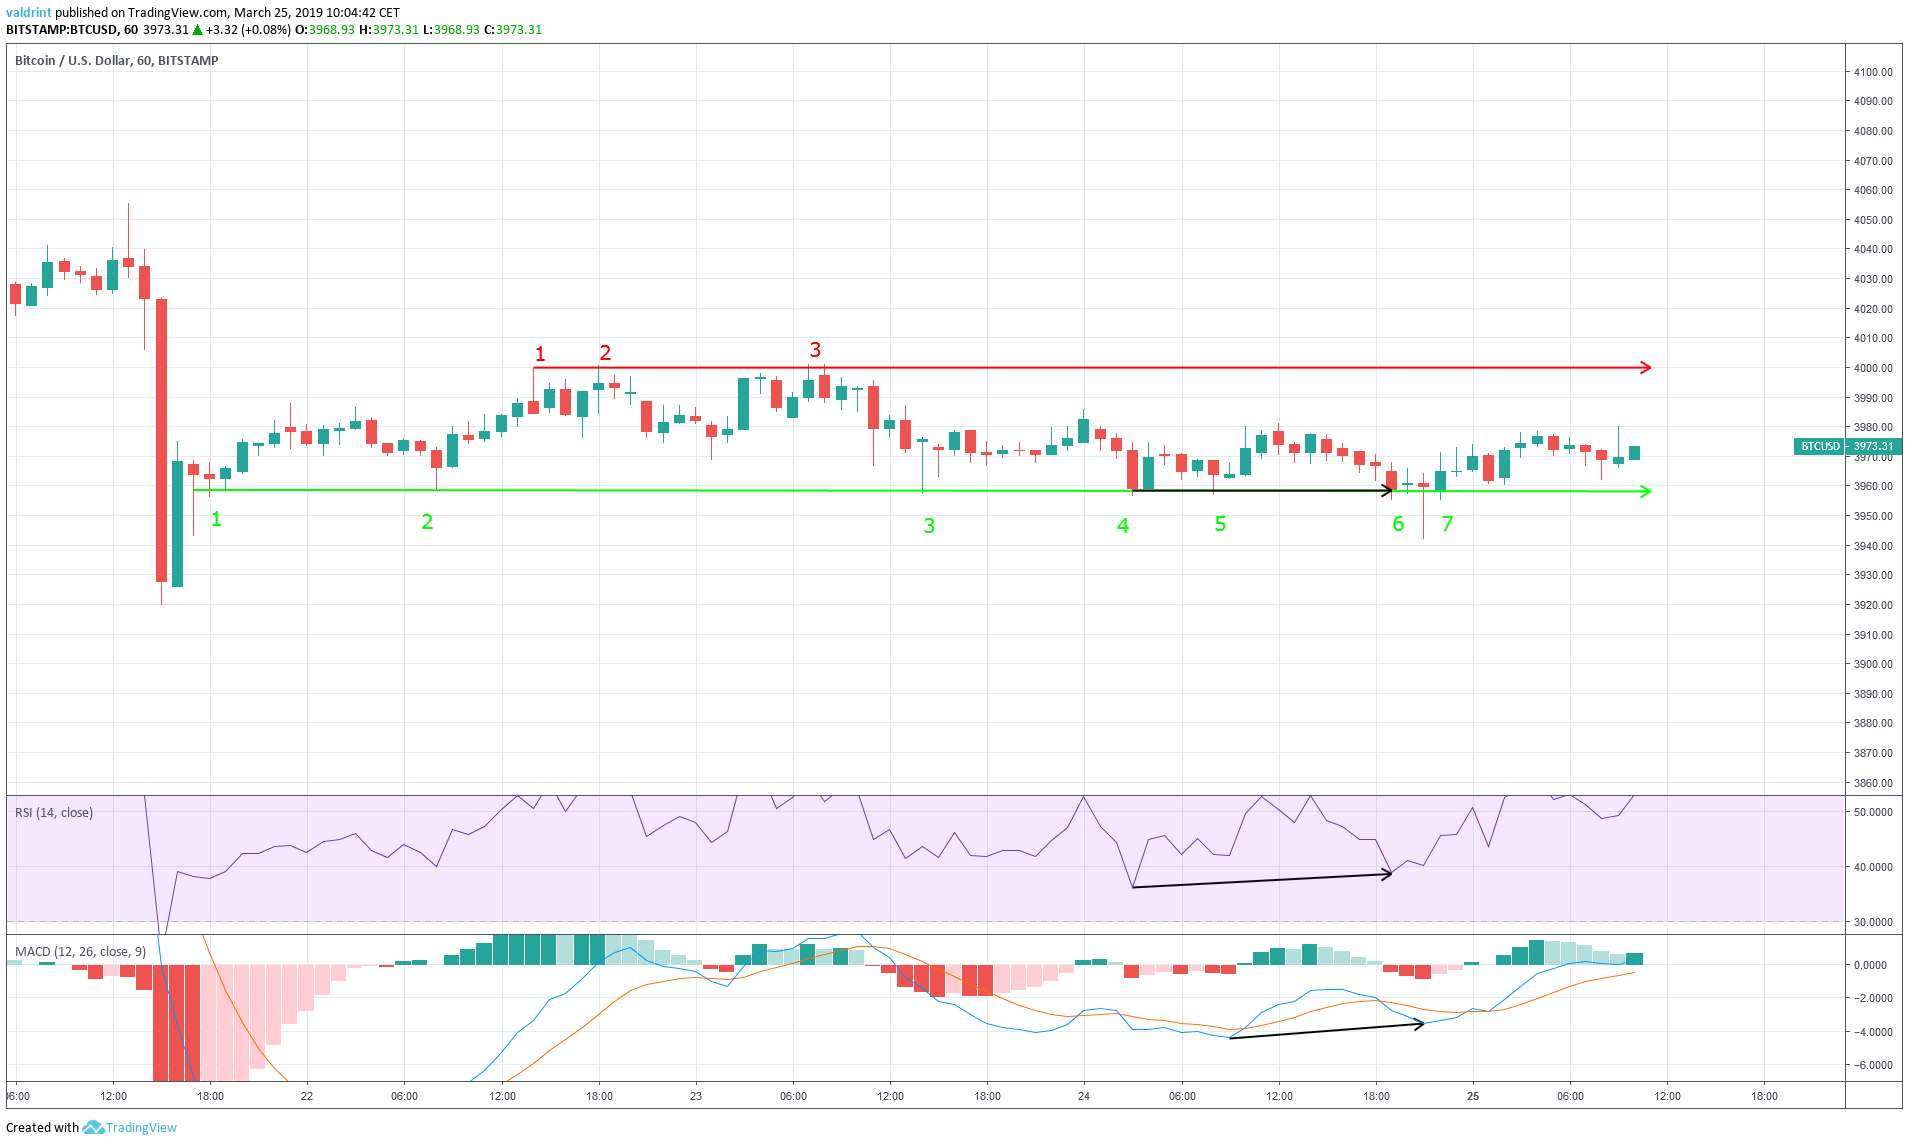 On Mar 24, the price made a low of $3856.3. It revisited the same level later that day. Similarly, the RSI made a low of $3856 on Mar 24 but has continued to generate higher values since.
This is known as bullish divergence and often precedes price increases.
It is especially effective if bullish divergence occurs in a bullish pattern and vice versa. This is not the case with Bitcoin, however, since the horizontal channel is a neutral pattern.
Possible price increases toward the resistance confirm the prediction made in the last section. However, because there is bullish divergence in a neutral pattern, we cannot necessarily expect a breakout at this time.
On Mar 24, the price made a low of $3856.3. It revisited the same level later that day. Similarly, the RSI made a low of $3856 on Mar 24 but has continued to generate higher values since.
This is known as bullish divergence and often precedes price increases.
It is especially effective if bullish divergence occurs in a bullish pattern and vice versa. This is not the case with Bitcoin, however, since the horizontal channel is a neutral pattern.
Possible price increases toward the resistance confirm the prediction made in the last section. However, because there is bullish divergence in a neutral pattern, we cannot necessarily expect a breakout at this time.
Long-Term Structure
The price of BTC on BitStamp is analyzed at six-hour intervals from Feb 8 to Mar 25 in an attempt to better assess possible future prices for Bitcoin. On Feb 8, the price made a low of $3337. Consecutive sharp upward moves followed. Several market cycles have been completed since, with each low being higher than the previous one. Tracing these lows gives us an ascending support line. On Feb 25, the price made a high of $3861. A gradual drop ensued followed by an increase. Each high has been higher than the previous one. Tracing these highs give us the ascending resistance line.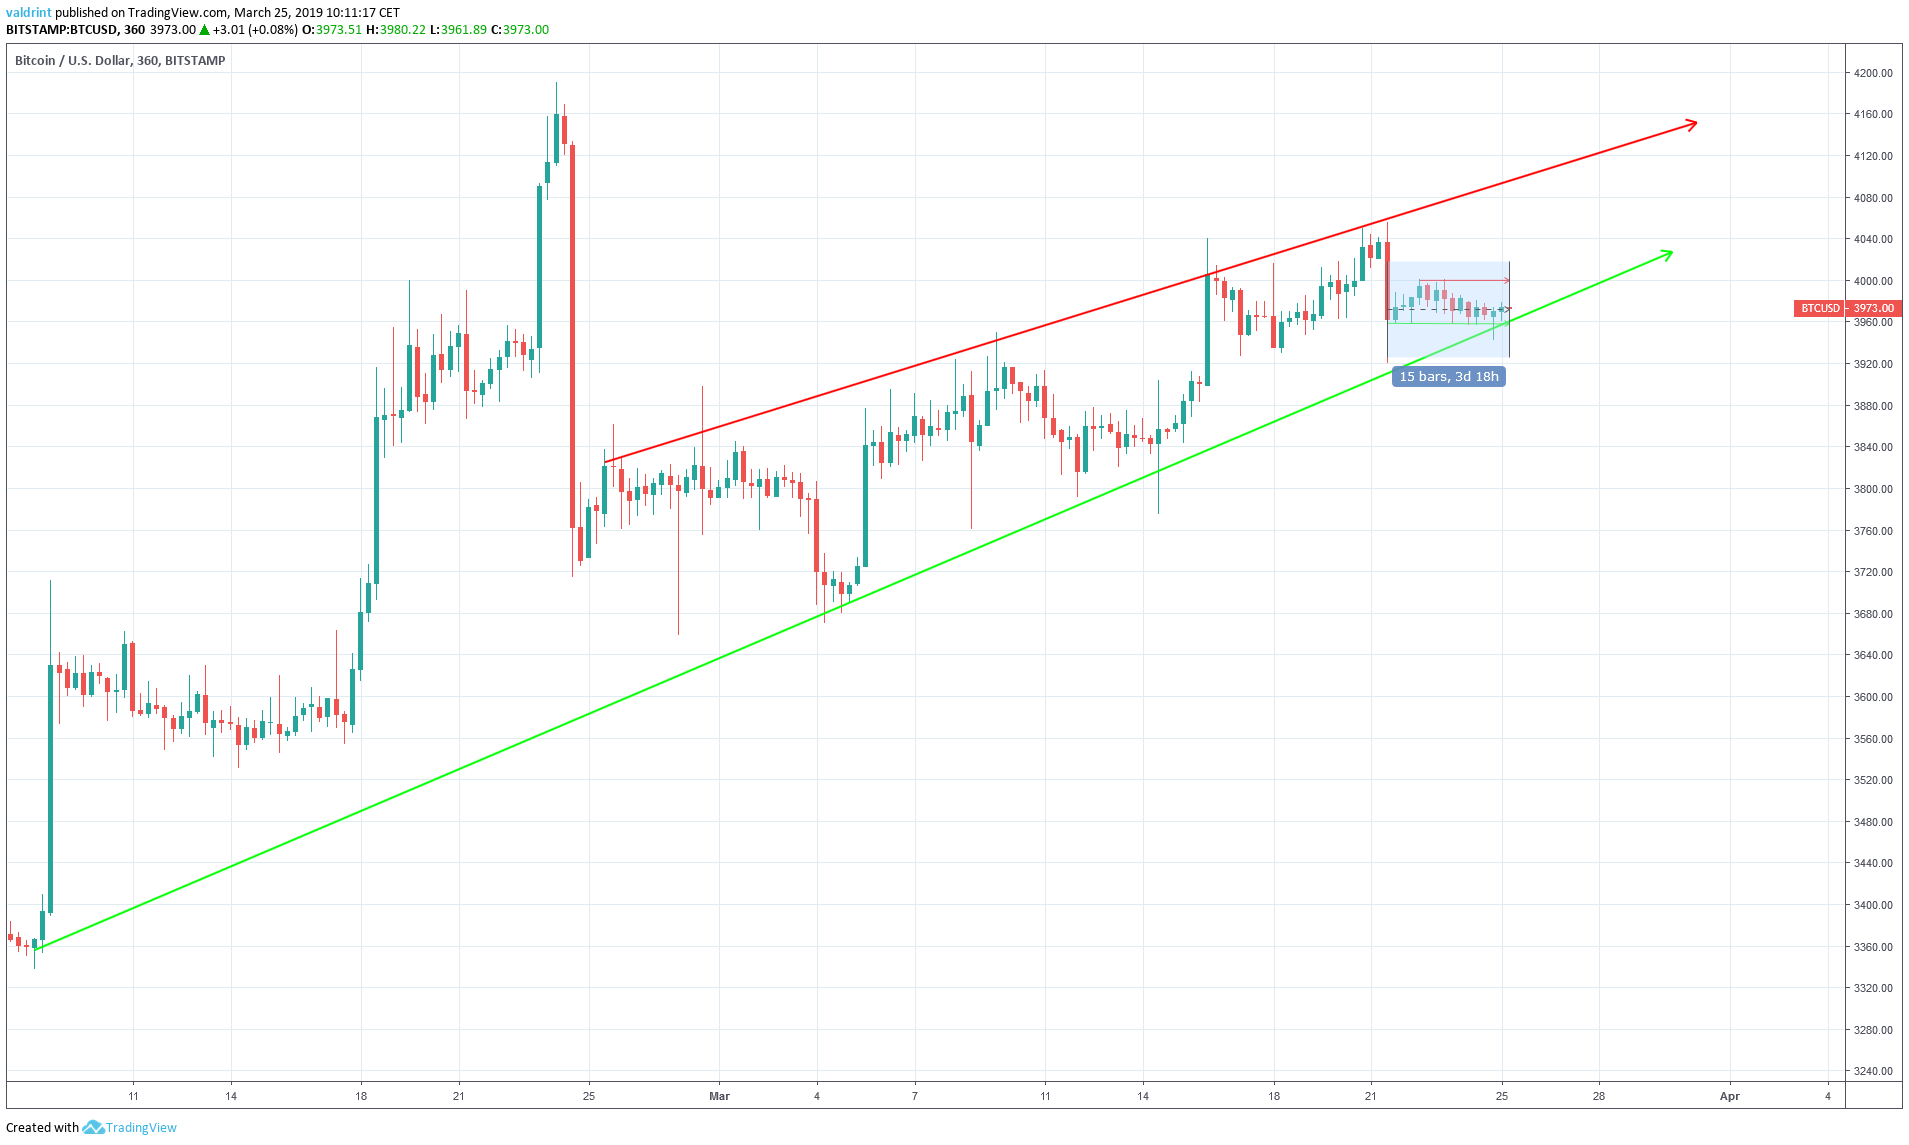 The support and resistance lines combine to create an ascending wedge, which is a bearish pattern, making price decreases more likely. The wedge is a better predictor of price fluctuations than support or resistance lines alone.
The horizontal channel analyzed in the previous section is highlighted in the graph.
Based on the creation of this pattern, a breakdown below the support line of the channel would effectively be a breakdown from the wedge and could trigger rapid price increases.
Conversely, a breakout above the resistance line of the channel could initiate an upward move to the top of the wedge.
The support and resistance lines combine to create an ascending wedge, which is a bearish pattern, making price decreases more likely. The wedge is a better predictor of price fluctuations than support or resistance lines alone.
The horizontal channel analyzed in the previous section is highlighted in the graph.
Based on the creation of this pattern, a breakdown below the support line of the channel would effectively be a breakdown from the wedge and could trigger rapid price increases.
Conversely, a breakout above the resistance line of the channel could initiate an upward move to the top of the wedge.
Reversal Areas
In order to better determine possible future levels of resistance and support, the price of BTC on BitStamp is analyzed at one-day intervals from Feb 9 to Mar 25, 2019. Resistance and support areas are created when the price visits the same level several times.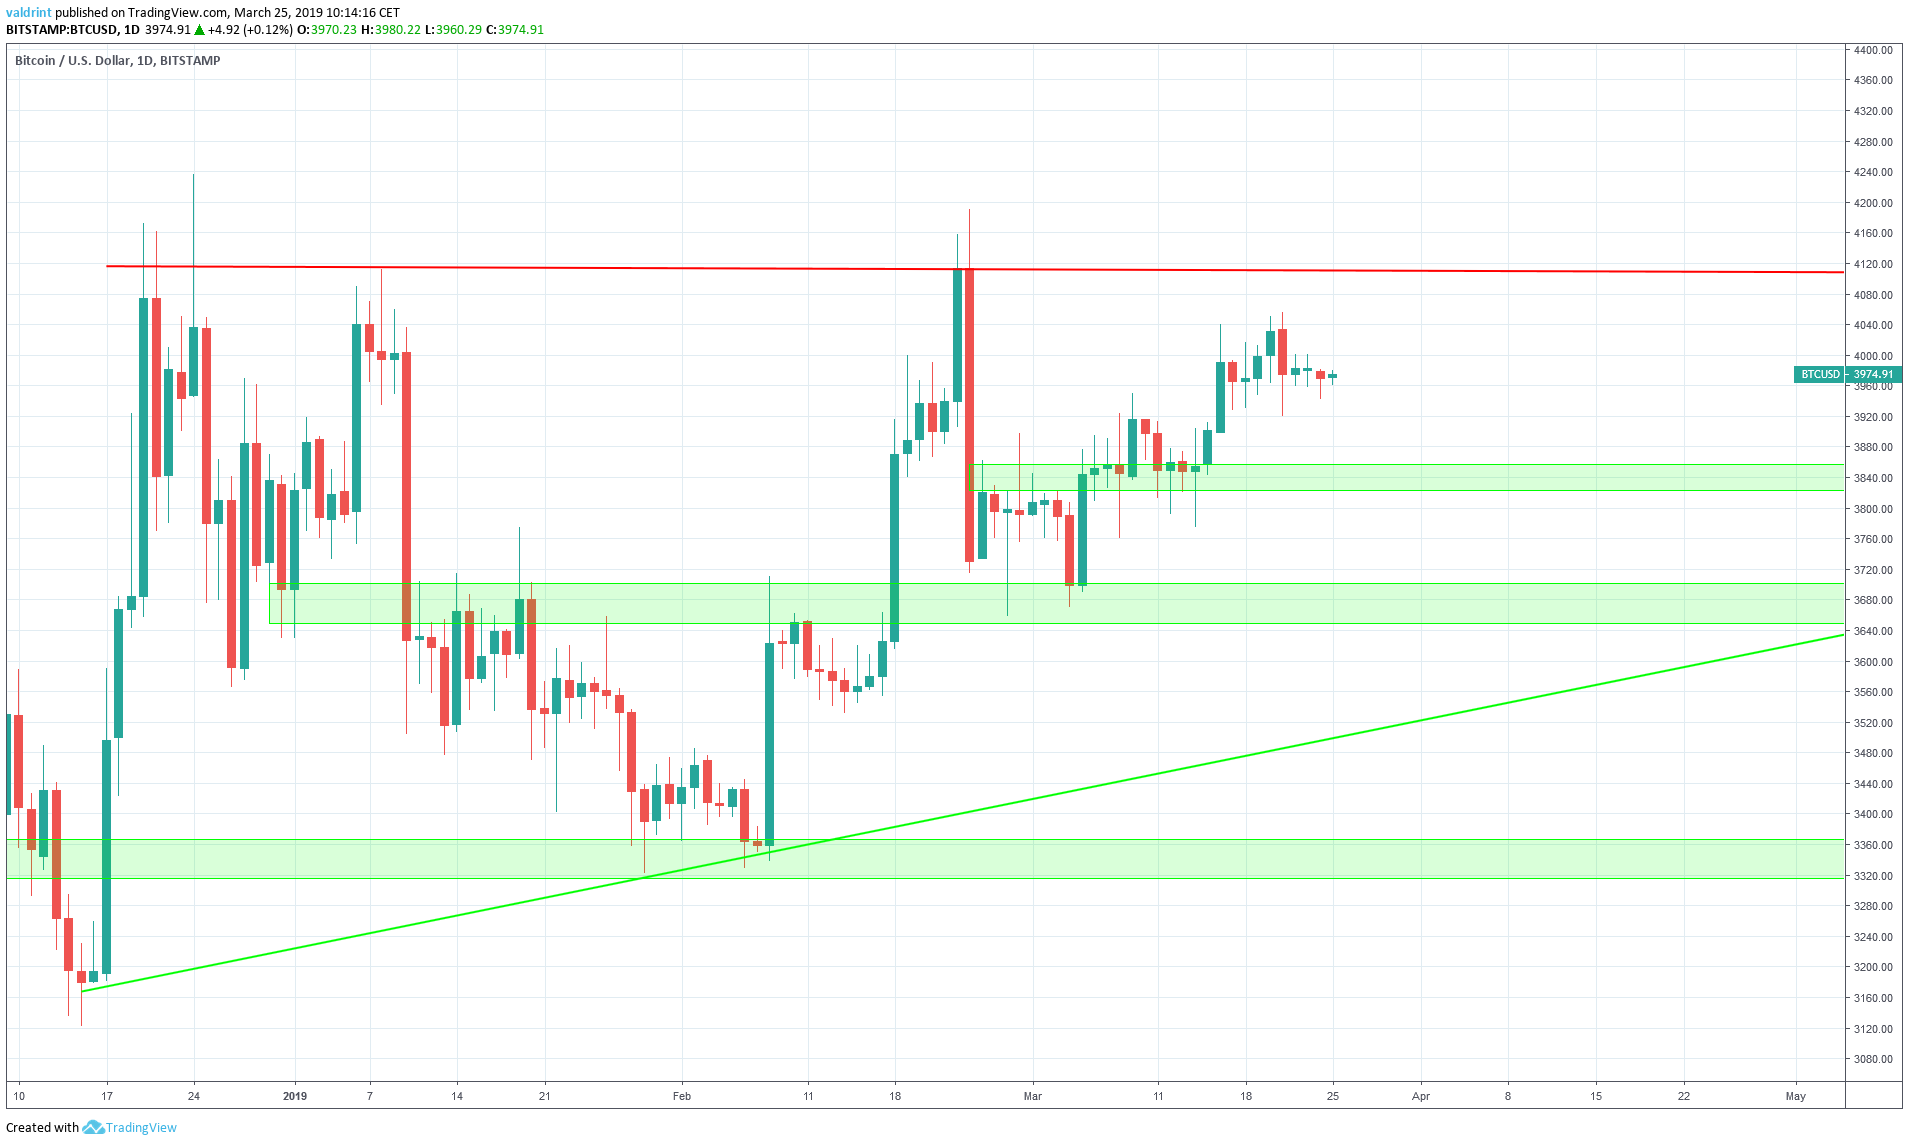 The first resistance area is found near $4120. If the price breaks out from the channel, it is likely that it will eventually reach this area but not necessarily in the near future. The $4120 mark is about 3% higher than the current resistance line traced in the horizontal channel. This point may be reached as a wick high, but we do not believe that prices will reach or exceed this level for long periods of time in the immediate future.
Price is currently trading above the first support area at $3840. The second support area is found at $3680, followed by the final one near $3340. If the price breaks down from the channel and wedge, it is likely that it will reach at least one of these areas. However, such a breakdown does not currently appear a likely possibility, so we do not expect these prices to be reached.
The first resistance area is found near $4120. If the price breaks out from the channel, it is likely that it will eventually reach this area but not necessarily in the near future. The $4120 mark is about 3% higher than the current resistance line traced in the horizontal channel. This point may be reached as a wick high, but we do not believe that prices will reach or exceed this level for long periods of time in the immediate future.
Price is currently trading above the first support area at $3840. The second support area is found at $3680, followed by the final one near $3340. If the price breaks down from the channel and wedge, it is likely that it will reach at least one of these areas. However, such a breakdown does not currently appear a likely possibility, so we do not expect these prices to be reached.
Summary of Analysis
Based on this analysis, the price of BTC is likely to keep moving inside the confines of the horizontal channel with upward movement toward the resistance line appearing likely. A high over $4000 may be reached, but such highs are not expected to lead to more significant price gains. On the contrary, if such highs are made, we expect drops back into the channel defined shortly thereafter. If the price breaks down, this prediction will be partially validated. If it first touches the resistance area then breaks down, it will be fully validated. A quick breakout above the resistance area would invalidate the prediction. Do you think BTC will breakout or breakdown? Let us know your thoughts in the comments below. Disclaimer: This article is not trading advice and should not be construed as such. Always consult a trained financial professional before investing in cryptocurrencies, as the market is particularly volatile.
Top crypto platforms in the US
Disclaimer
In line with the Trust Project guidelines, this price analysis article is for informational purposes only and should not be considered financial or investment advice. BeInCrypto is committed to accurate, unbiased reporting, but market conditions are subject to change without notice. Always conduct your own research and consult with a professional before making any financial decisions. Please note that our Terms and Conditions, Privacy Policy, and Disclaimers have been updated.

Valdrin Tahiri
Valdrin discovered cryptocurrencies while he was getting his MSc in Financial Markets from the Barcelona School of Economics. Shortly after graduating, he began writing for several different cryptocurrency related websites as a freelancer before eventually taking on the role of BeInCrypto's Senior Analyst.
(I do not have a discord and will not contact you first there. Beware of scammers)
READ FULL BIO
Sponsored
Sponsored