


At BeInCrypto, we complete regular price analyses and predictions of the most popular and relevant cryptoassets. Today, we are beginning a weekly series in which we compare the price of Bitcoin (BTC) against the share price of two of the largest companies specializing in Artificial Intelligence: NVIDIA (NVDA) and Alphabet Inc. (GOOGL).
NVIDIA is an American technology company which designs graphics processing units (GPUs) for the gaming and professional markets, as well as system on a chip units (SoCs) for the mobile computing and automotive market. It began heavily focusing on artificial intelligence in 2014.
Alphabet Inc. is an American multinational conglomerate. It was created through a corporate restructuring of Google in 2015 when it became the parent company of Google and several subsidiaries
NVIDIA Price Analysis
The price of NVDA reached lows of $183.13 on Apr 15. Since then, it has been increasing, reaching a high of $192.8 on Apr 24.
During the week of Apr 22-29, NVDA was trading within an ascending channel formed earlier in the month:
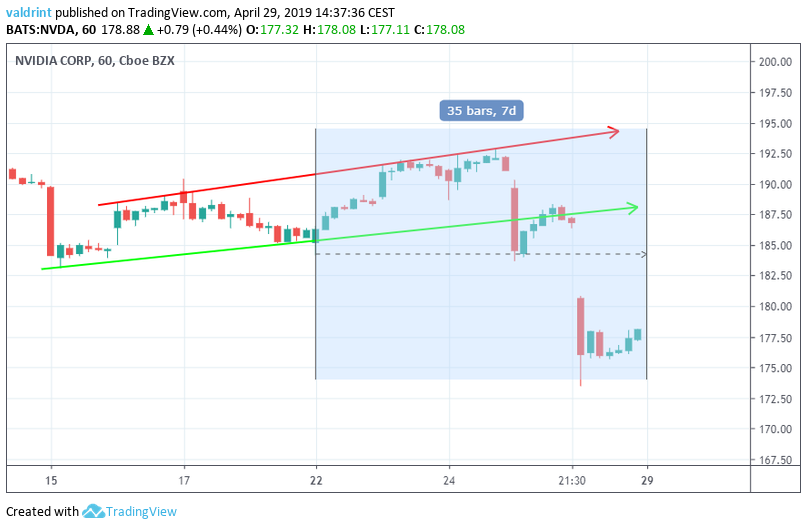
The price broke down from the channel on Apr 25. Since then, the price has steadily dropped and a new trading pattern may be developing.
At the time of writing on Apr 29, NVDA was trading close to $177.50—lower than the lows reached two weeks prior.
Alphabet Inc.
The price of GOOGL reached a low of $1163.0 on Mar 28. A gradual increase followed with a high of $1278.7 reached on Apr 26.
GOOGL has been trading inside an ascending channel throughout April. During the last week, it rose to touch the resistance line and has fallen slightly since:
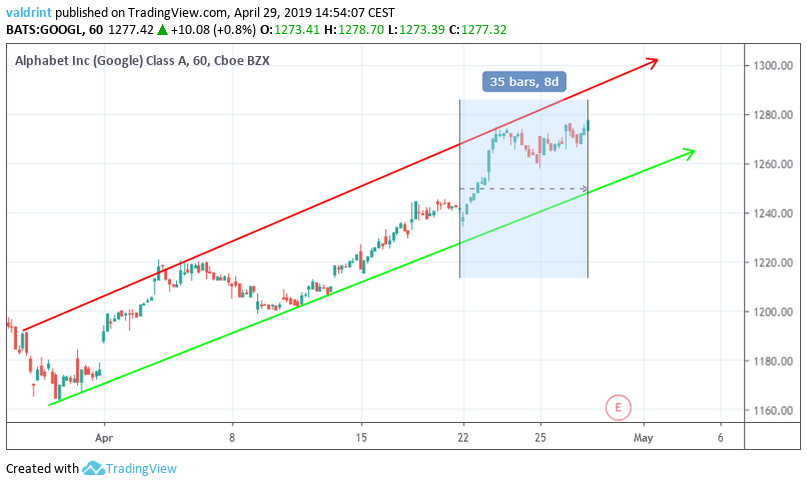
At the time of writing on Apr 29, GOOGL had dropped back to under $1230 after making a high near $1300.
Bitcoin
On Apr 2, a massive spike caused Bitcoin to break out of its previous trading pattern. The price broke past $5300 the following day and has gradually climbed to highs over $5600 at several times throughout April.
During the month, Bitcoin has been trading within an ascending channel. When this analysis was performed, Bitcoin appeared to be in the middle of the trading pattern:
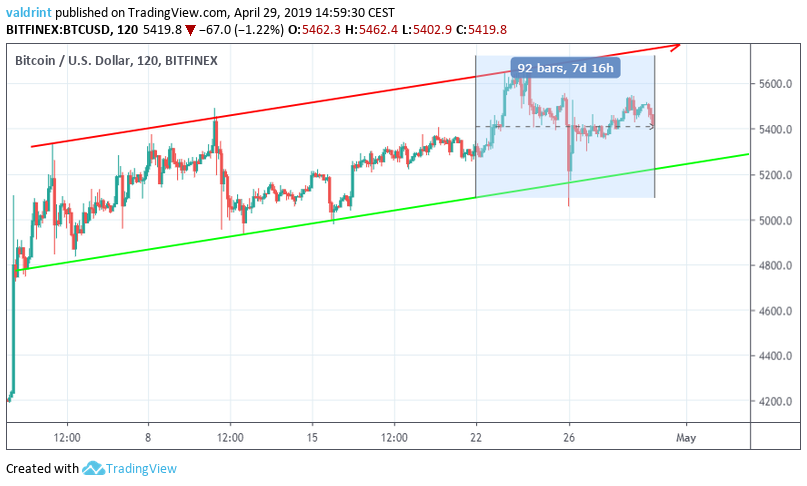
Earlier this week, Bitcoin rose to touch the resistance line. It has since fallen but is still trading at higher levels than last week.
Comparing April 22-29 Performances
The price of BTC (candle bars), GOOGL (blue line) and NVDA (orange line) are compared at one-hour intervals from Apr 22 to Apr 29 in the graph below. The right-hand scale presents the percentage increase/decrease of the three assets during this period.
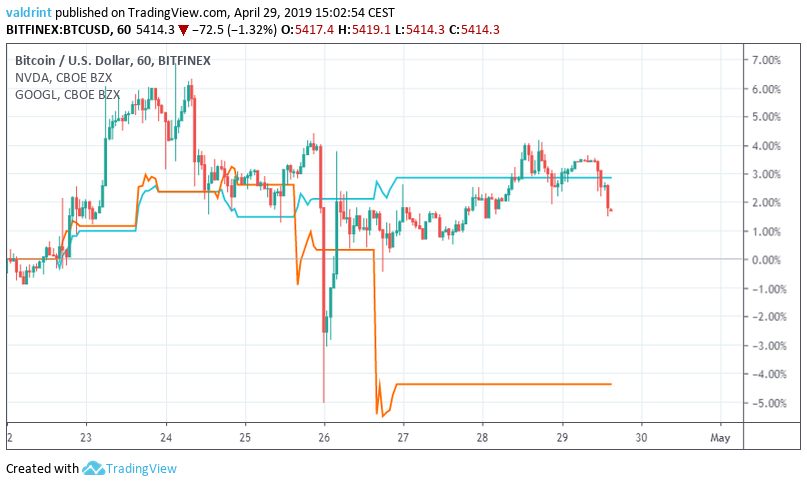
The price of BTC began the measuring period with a gradual increase, which intensified on Apr 23.
On Apr 24, the price reached a high of almost 7% increase from the beginning of the measuring period. However, a sharp decrease took it to lows of -5%, before the price rebounded to an overall increase of 1.49% for the week.
The price of GOOGL has been gradually increasing since the beginning of the measuring period. It did not experience significant fluctuations and finished the period with an increase of 2.8%.
Finally, the price of NVDA began the measuring period with a gradual increase, reaching levels of 3% on Apr 25. However, a sharp decrease occurred on Apr 26. It finished the measuring period with a decrease of 4.35%.
Summary
As evidenced by the charts above, we can come to the conclusion that the price of GOOGL has enjoyed the biggest increase, followed by the price of BTC. The price of NVDA has decreased significantly.
Furthermore, we can see that the prices of BTC and GOOGL have followed similar ascending patterns. However, the price of BTC has experienced significant volatility, while GOOGL has not.
The price of NDVA was trading inside an ascending pattern, but broke down and is currently falling freely.
Based on this week’s analysis, we cannot make a predictive assumption about a correlation between the AI industry and Bitcoin. However, the price of GOOGL and Bitcoin appear to be increasing at similar rates.
We will return to this analysis next week in order to see if the assumption still holds true.
Interested in long-term bitcoin predictions? Click on the button below.
BTC/USD Predictions for 2019 & 2020!
Disclaimer: This article is not trading advice and should not be construed as such. Always consult a trained financial professional before investing in cryptocurrencies, as the market is particularly volatile.


