
The Stellar (XLM) price has fallen since a rejection at the end of April, which validated a longstanding horizontal resistance area.
Most of the weekly and short-term readings are bearish, supporting the possibility of more downside in May. The wave count offers an outline of how this decrease might transpire.
Stellar Price Fails to Clear Crucial Level
The price of Stellar has been consistently increasing since the beginning of the year. There was a significant breakthrough in January when the price surpassed a resistance line. Previously, the line had existed since the 2021 high of $0.80.
Since the line had been in place for such a long period of time, a breakout from it was expected to lead to a substantial upward movement and also indicate the end of a downward correction.
Afterward, the XLM price climbed up to the $0.110 resistance but failed to break through.
Since the rejection, the XLM price has decreased consistently toward the $0.075 support area, reaching a low of $0.090 in May.
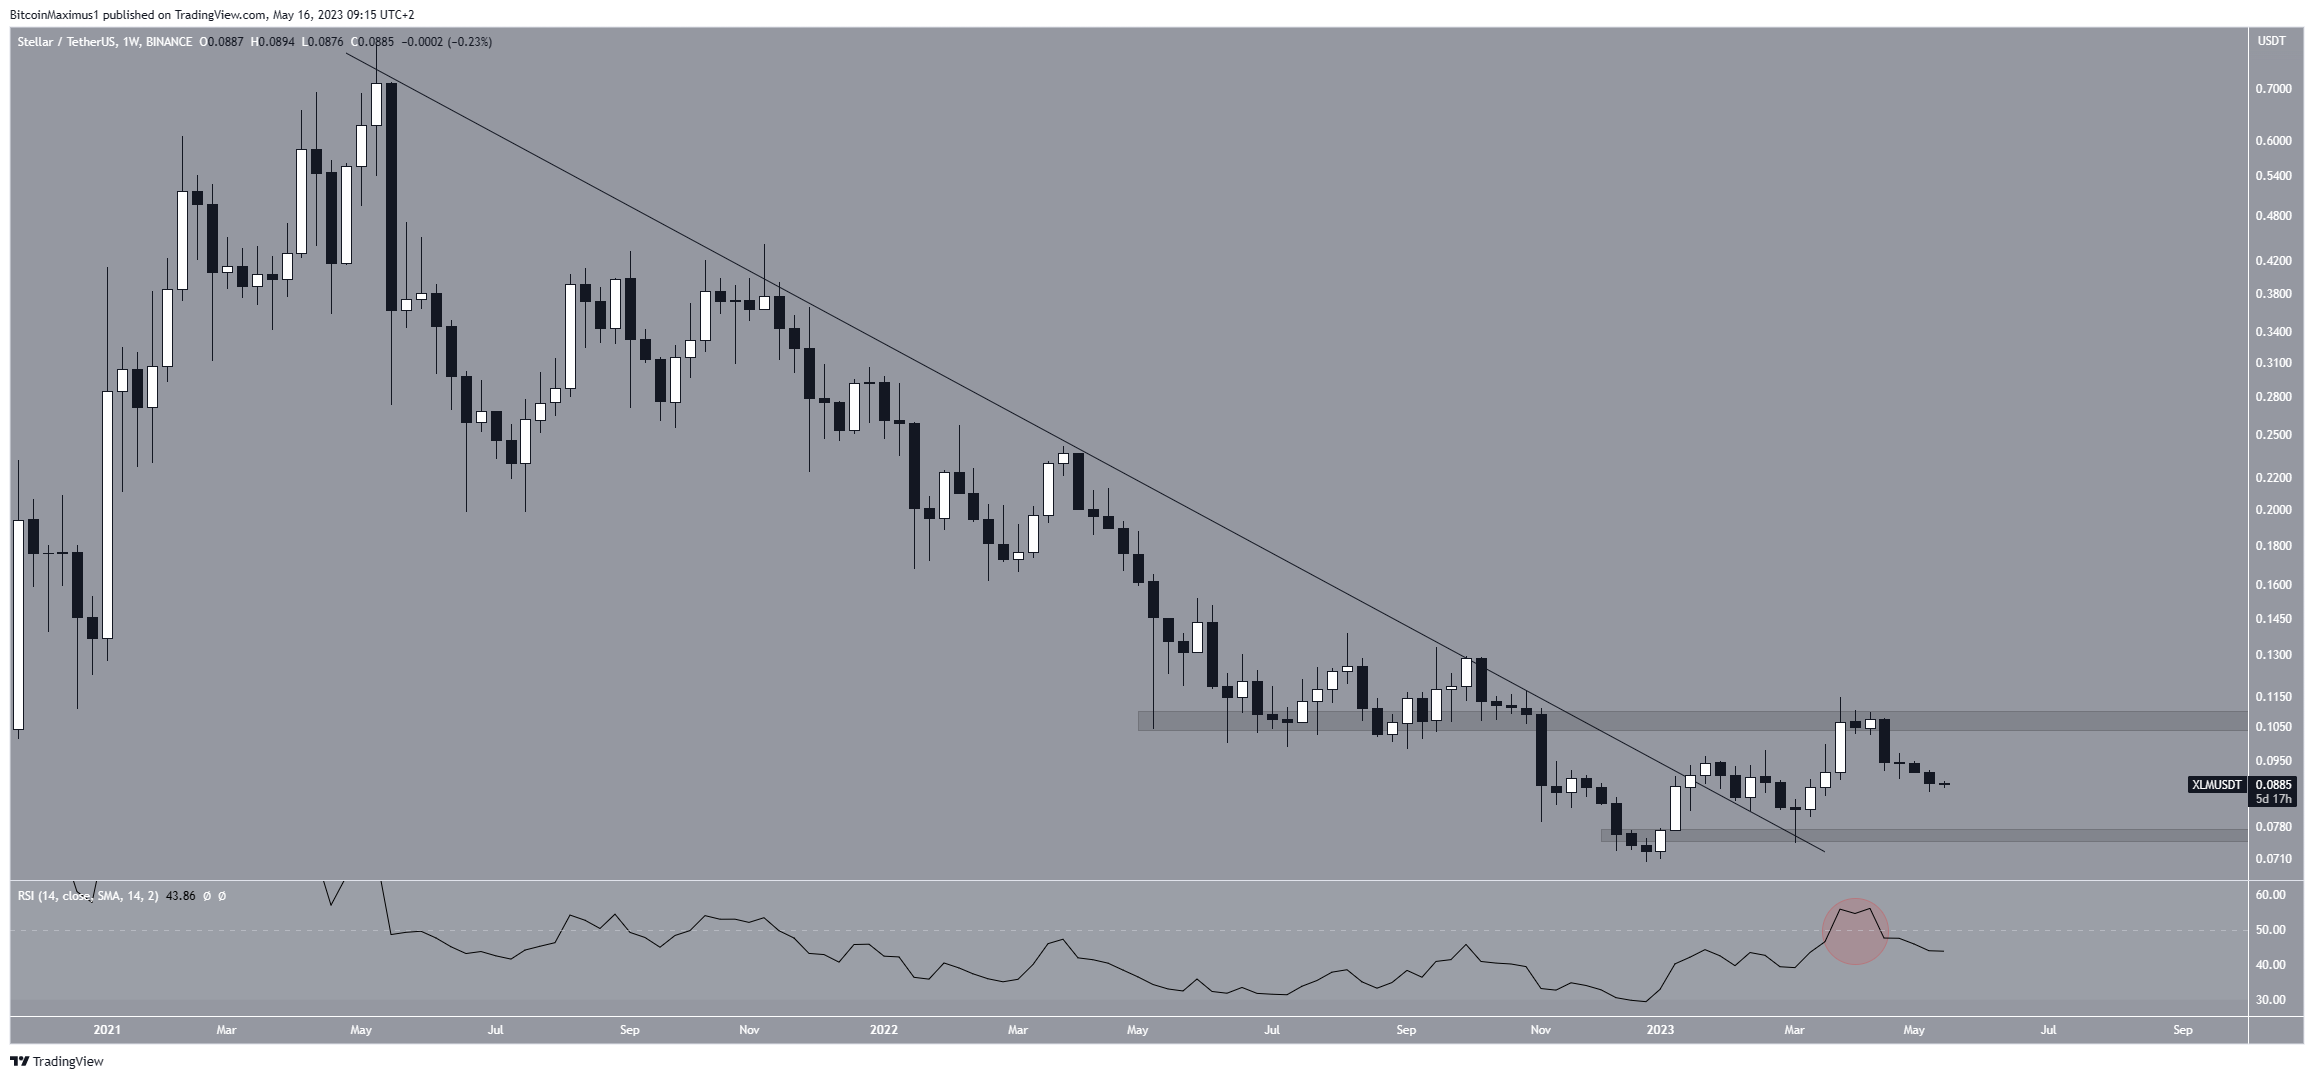
The weekly Relative Strength Index (RSI) also gives a bearish reading. When evaluating market conditions, traders use the RSI as a momentum indicator to determine if a market is overbought or oversold and to decide whether to accumulate or sell an asset.
If the Relative Strength Index (RSI) reading is above 50 and the trend is upward, bulls still have an advantage, but if the reading is below 50, the opposite is true.
After deviating above 50 (red circle), the RSI fell below the line, a sign of a bearish trend.
XLM Price Prediction: Wave Count Predicts Downside
The technical analysis from the short-term 12-hour time frame gives a more decisively bearish XLM price prediction. The main reason for this comes from the wave count.
Technical analysts employ the Elliott Wave theory as a means to identify recurring long-term price patterns and investor psychology, which helps them determine the direction of a trend.
Since the beginning of the year, the most likely wave count suggests that the entire movement is an A-B-C corrective structure (white). This supports the rejection from the long-term resistance area.
Then, the ensuing decrease looks like a beginning of a new bearish impulse, as evidenced by the five waves down (black).
If the count is correct, the crypto asset will decrease toward the closest support area at $0.075 and possibly break down.
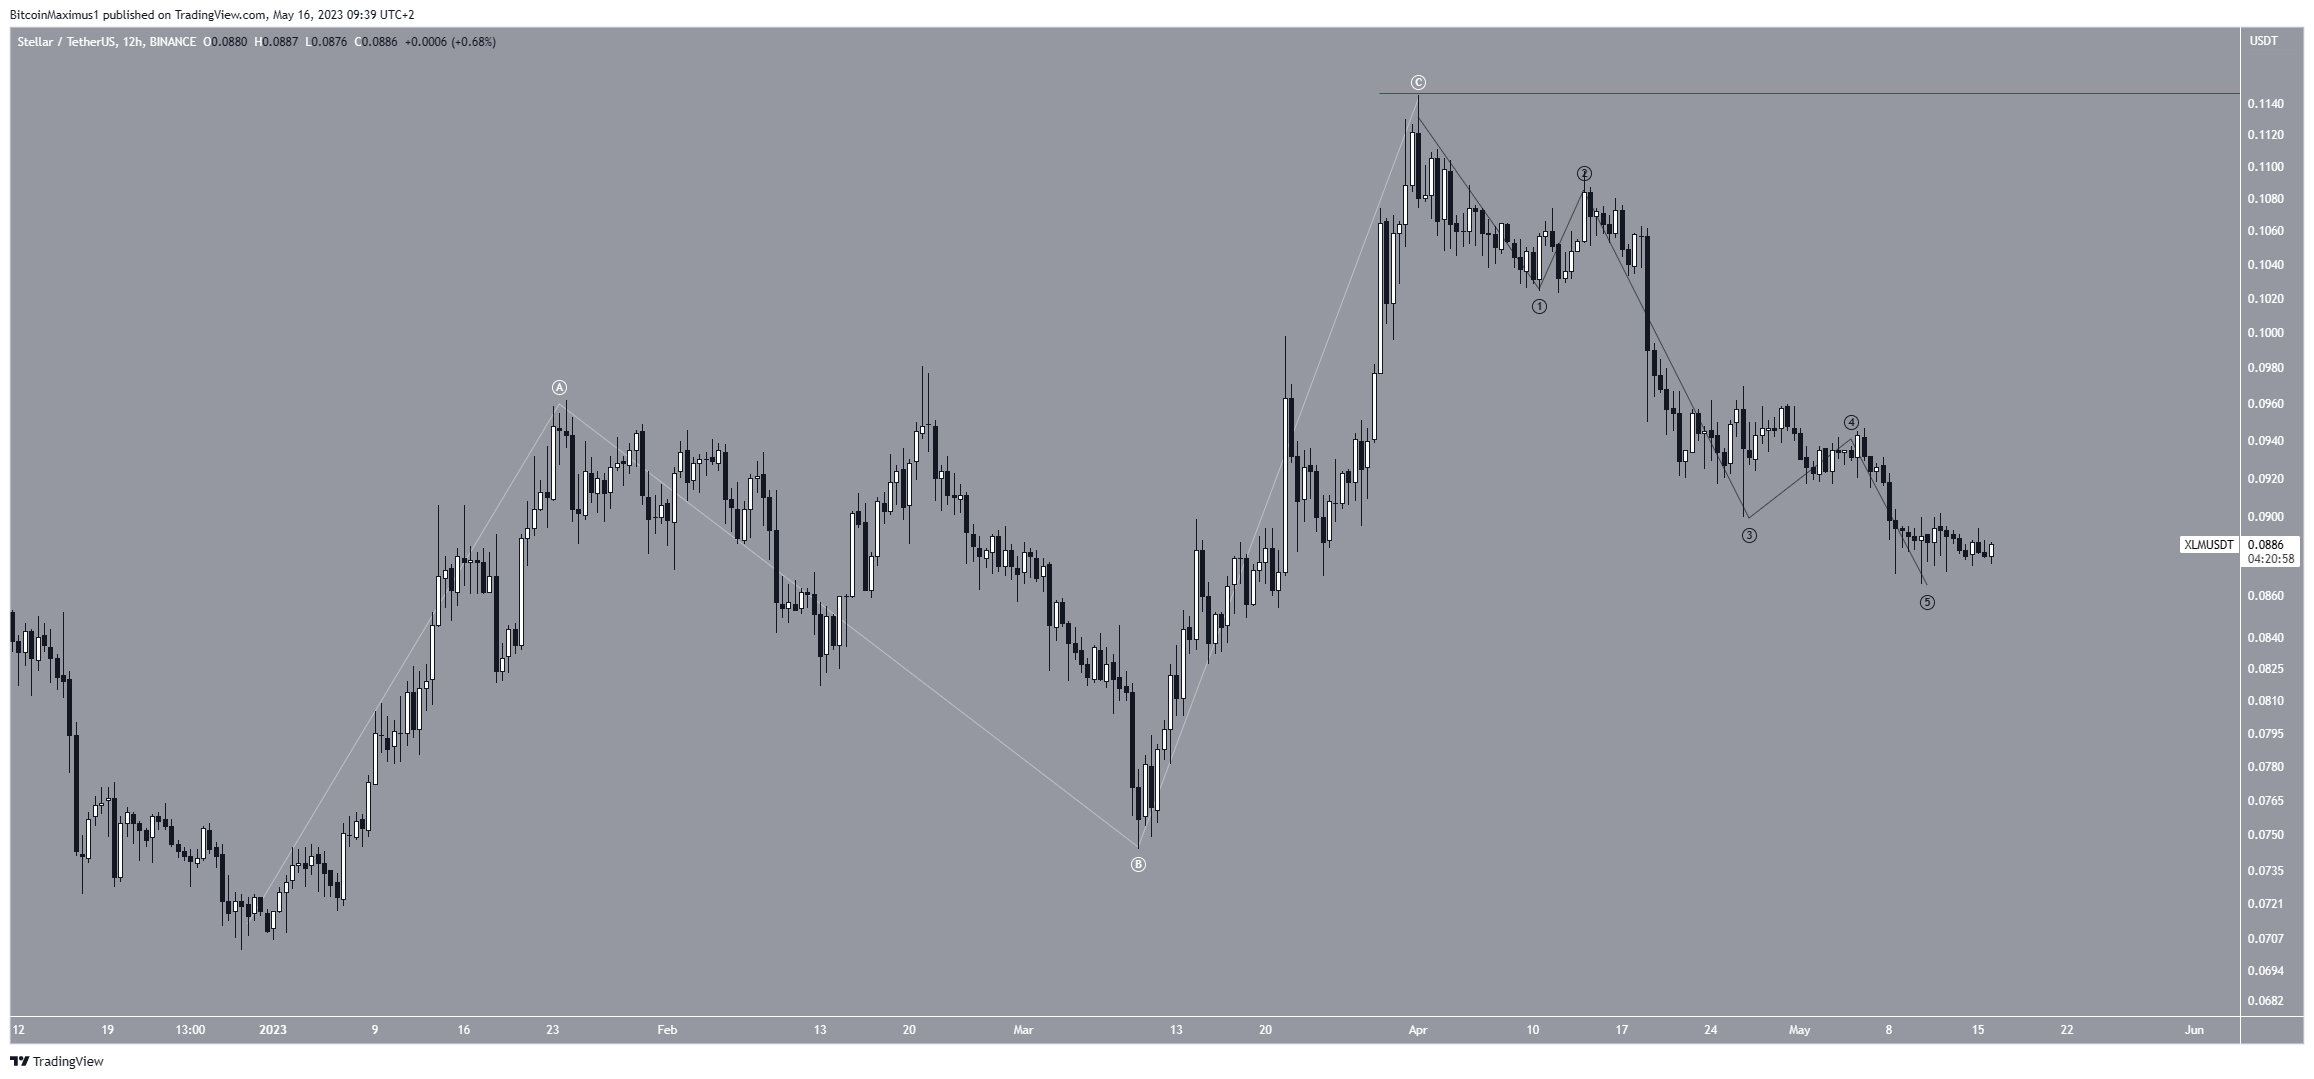
However, an increase above the $0.115 wave C high (red line) will mean that the trend is bullish instead.
In that case, the future price can move to the next resistance at an average price of $0.20.
