


Bitcoin (BTC) has surged over the last few days with a high of nearly $8400 reached on May 16. Litecoin (LTC) and Bitcoin Cash (BCH) have followed suit along with several other altcoins.
In this continuing analysis of BTC, LTC, and BCH, we examine their current long-term and short-term trading patterns and compare their technical indicators. This allows us to generate possible trade setups.
Our major findings are summarized in the conclusion where the winner of this analysis is selected based on future price potential.
You can read our previous analysis of BTC, BCH, and LTC here.
Long-Term Patterns
Bitcoin
On Apr 3, the price of BTC/USD reached a high of $5335.5 and a low of $4842. Resistance and support lines are traced from this date to generate the ascending channel outlined in the graph below:
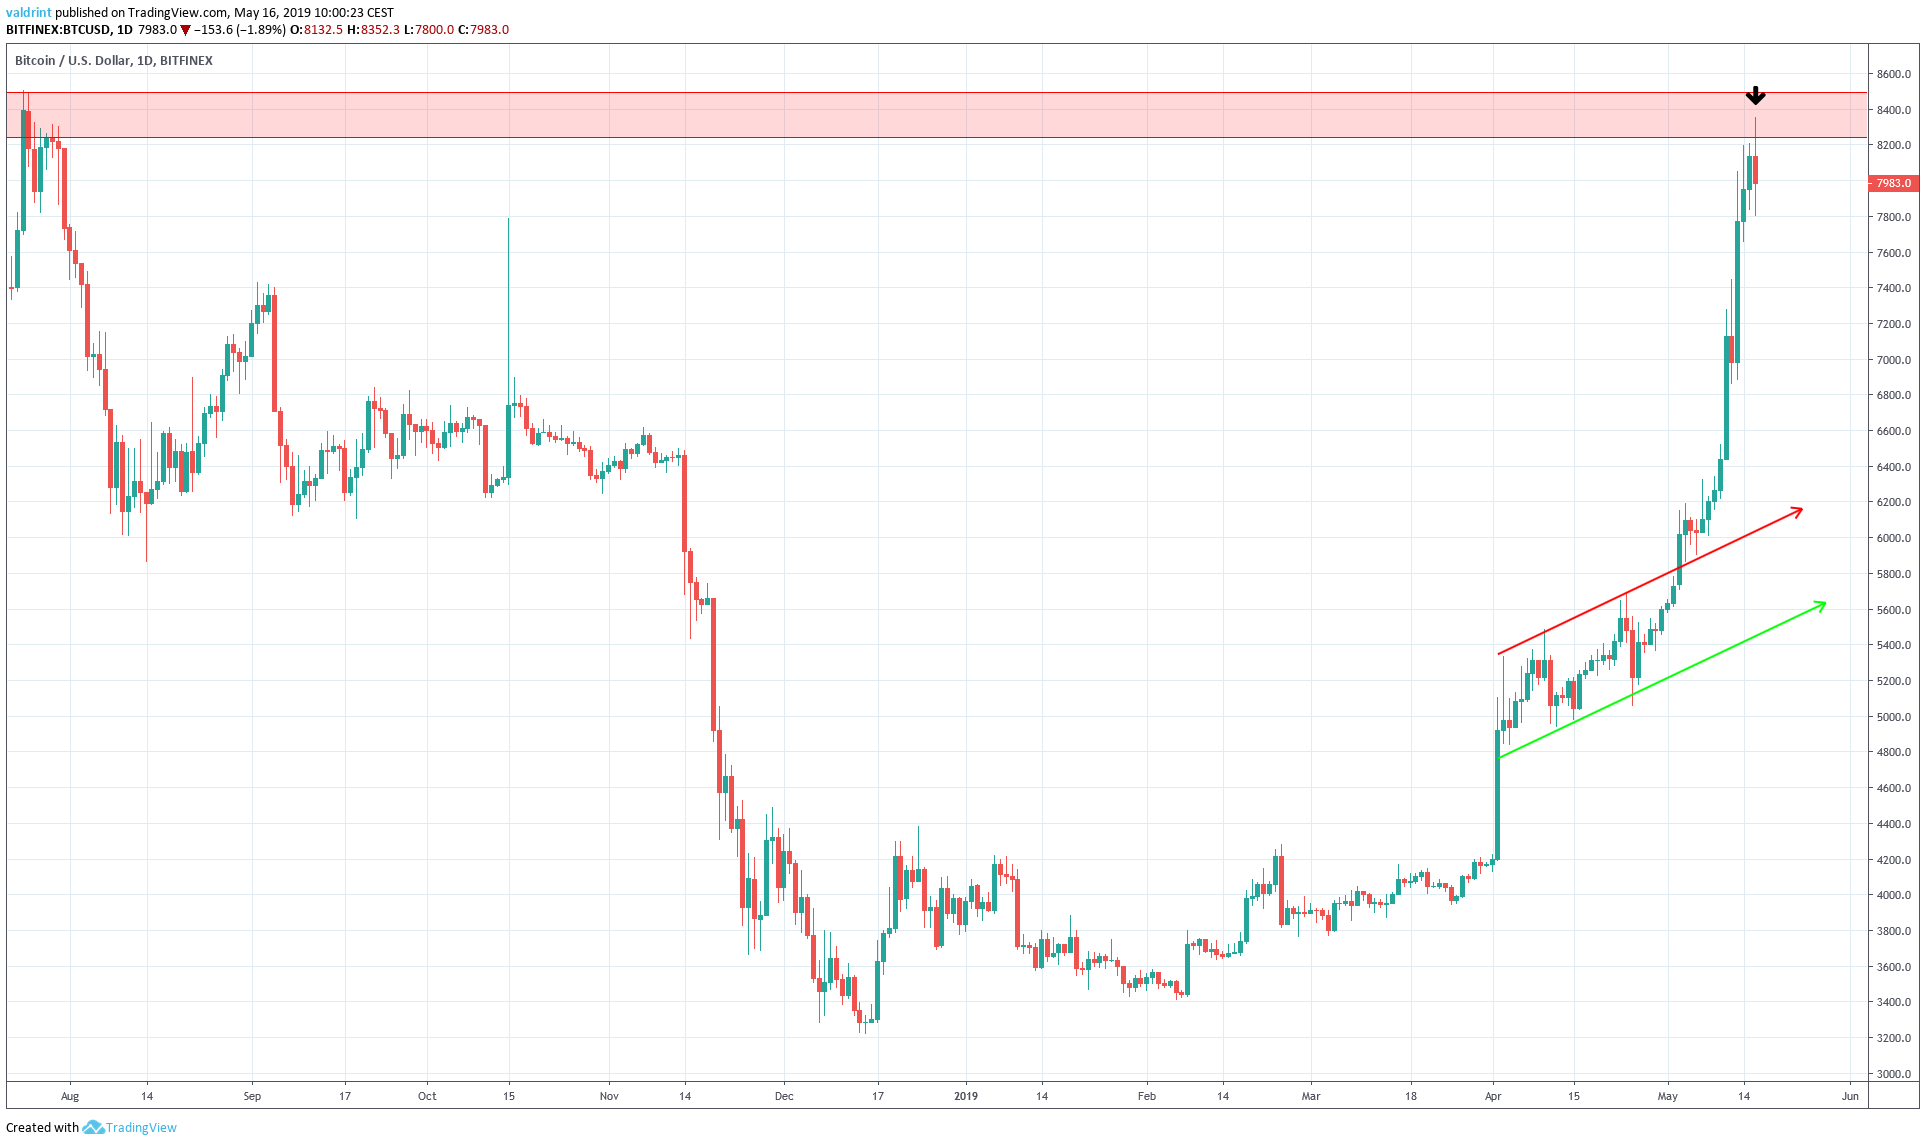
The price broke out from the channel on May 5th. A rapid increase began. On May 16, BTC reached a major resistance area of $8300-$8500 when a high of $8352.3 was reached on May 16. This resistance area was generated by the highs of July 2018.
The daily candles have been characterized by long upper wicks, indicating that there is selling pressure in the market.
Furthermore, the current daily candle is bearish with both a long upper and lower wick. It is worth keeping an eye on how the price closes today. A close below $7800 would create a bearish engulfing candle and possibly initiate a reversal.
Litecoin
The price of LTC/USD, however, has been following an ascending support line since making lows of $53.4 on Mar 12.
The increase intensified on Apr 2 and the price reached a high of $99.4 on Apr 3. After reaching similar levels on Apr 6, LTC initiated a gradual descent. The price fell throughout the rest of the month and validated the support line on May 1.
Thus far in May, the price has been on an uptrend. A high of $106.98 was reached on May 16. Price movements are shown in the graph below:
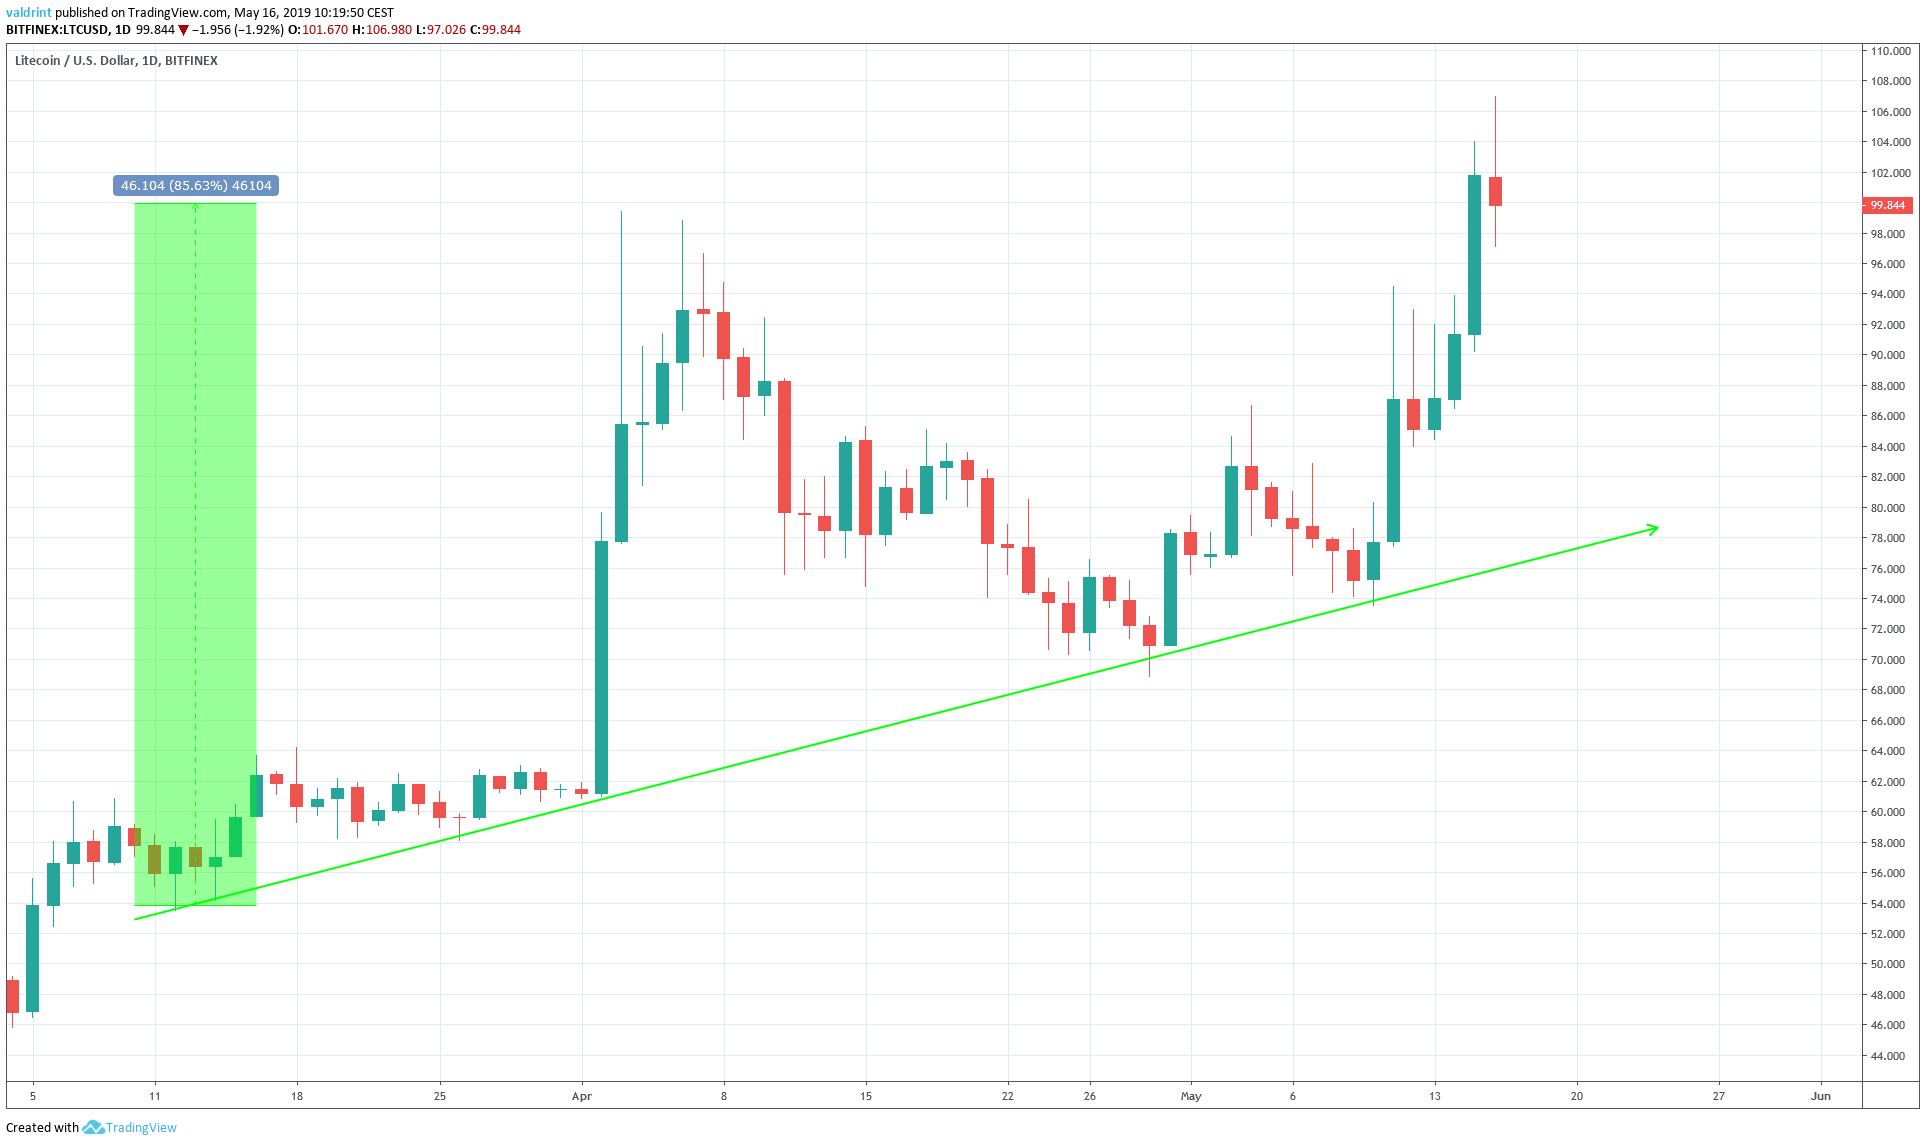
The price has since fallen below $100. Since the beginning of the support line, it has increased by over 80% at the time of writing.
Bitcoin Cash
Similar to LTC, the price of BCH/USD has been following an ascending support line since Dec 18, 2018 when a low of $85.2 was reached.
Over the next three days, the price spiked. A high of $232.1 was reached on Dec 21, 2018.
A gradual decrease lasted until Apr 2019. Within the first few days of the month, the price spiked to over $350. and then fell slightly throughout the month. At the beginning of May, price began rising again and has cine surpassed the $400 mark.
Currently, BCH is trading inside the ascending channel outlined below:
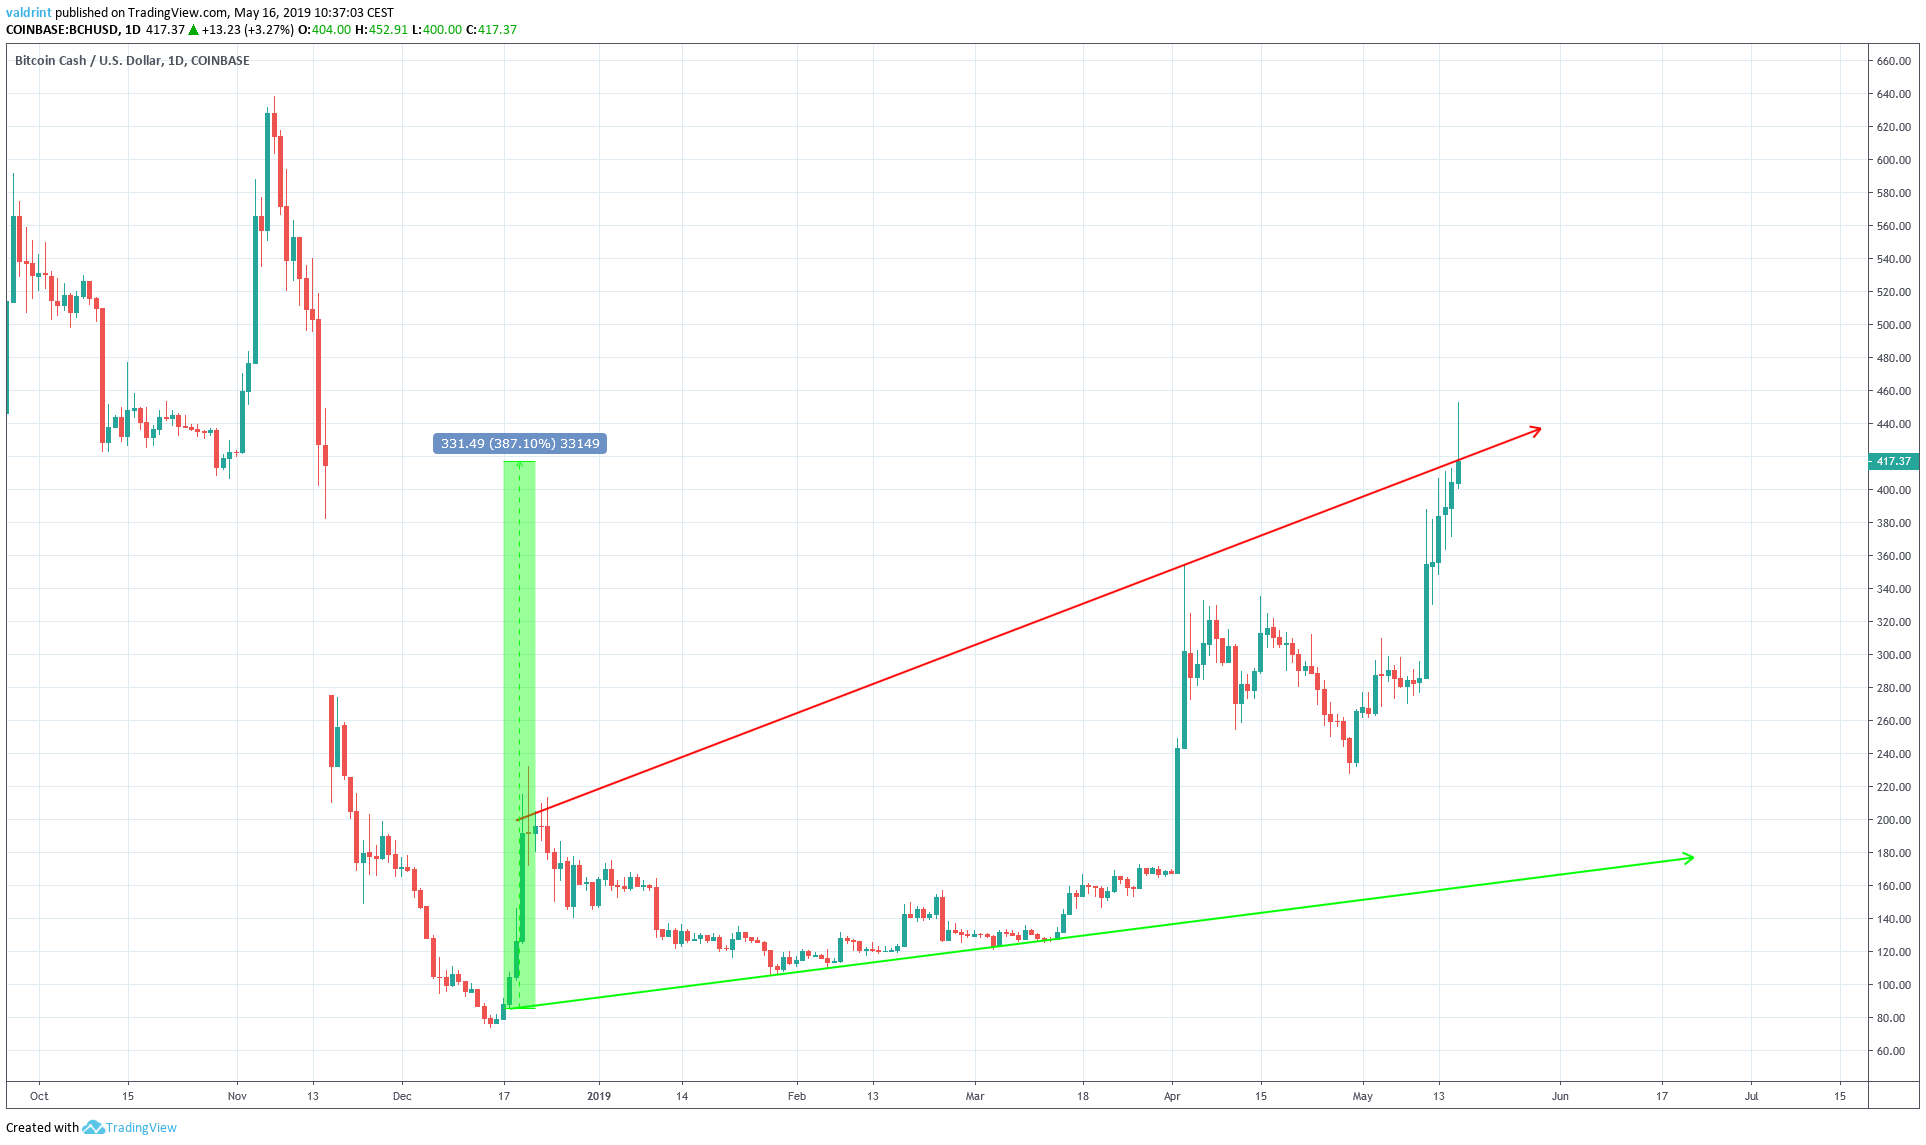
At the time of writing, the price was trading at $420.
While trading inside the channel, the price has increased by a massive 387%
However, these patterns alone are not sufficient to predict future price movements. In order to do that, we need to take a look at each of these coins within a shorter time-frame alongside relevant technical indicators.
Bitcoin’s Current Pattern
On May 12, the price reached a high of $7448.0. A gradual decrease brought it to a low of $6880.0 the next day. It has been trading inside the ascending channel outlined below:
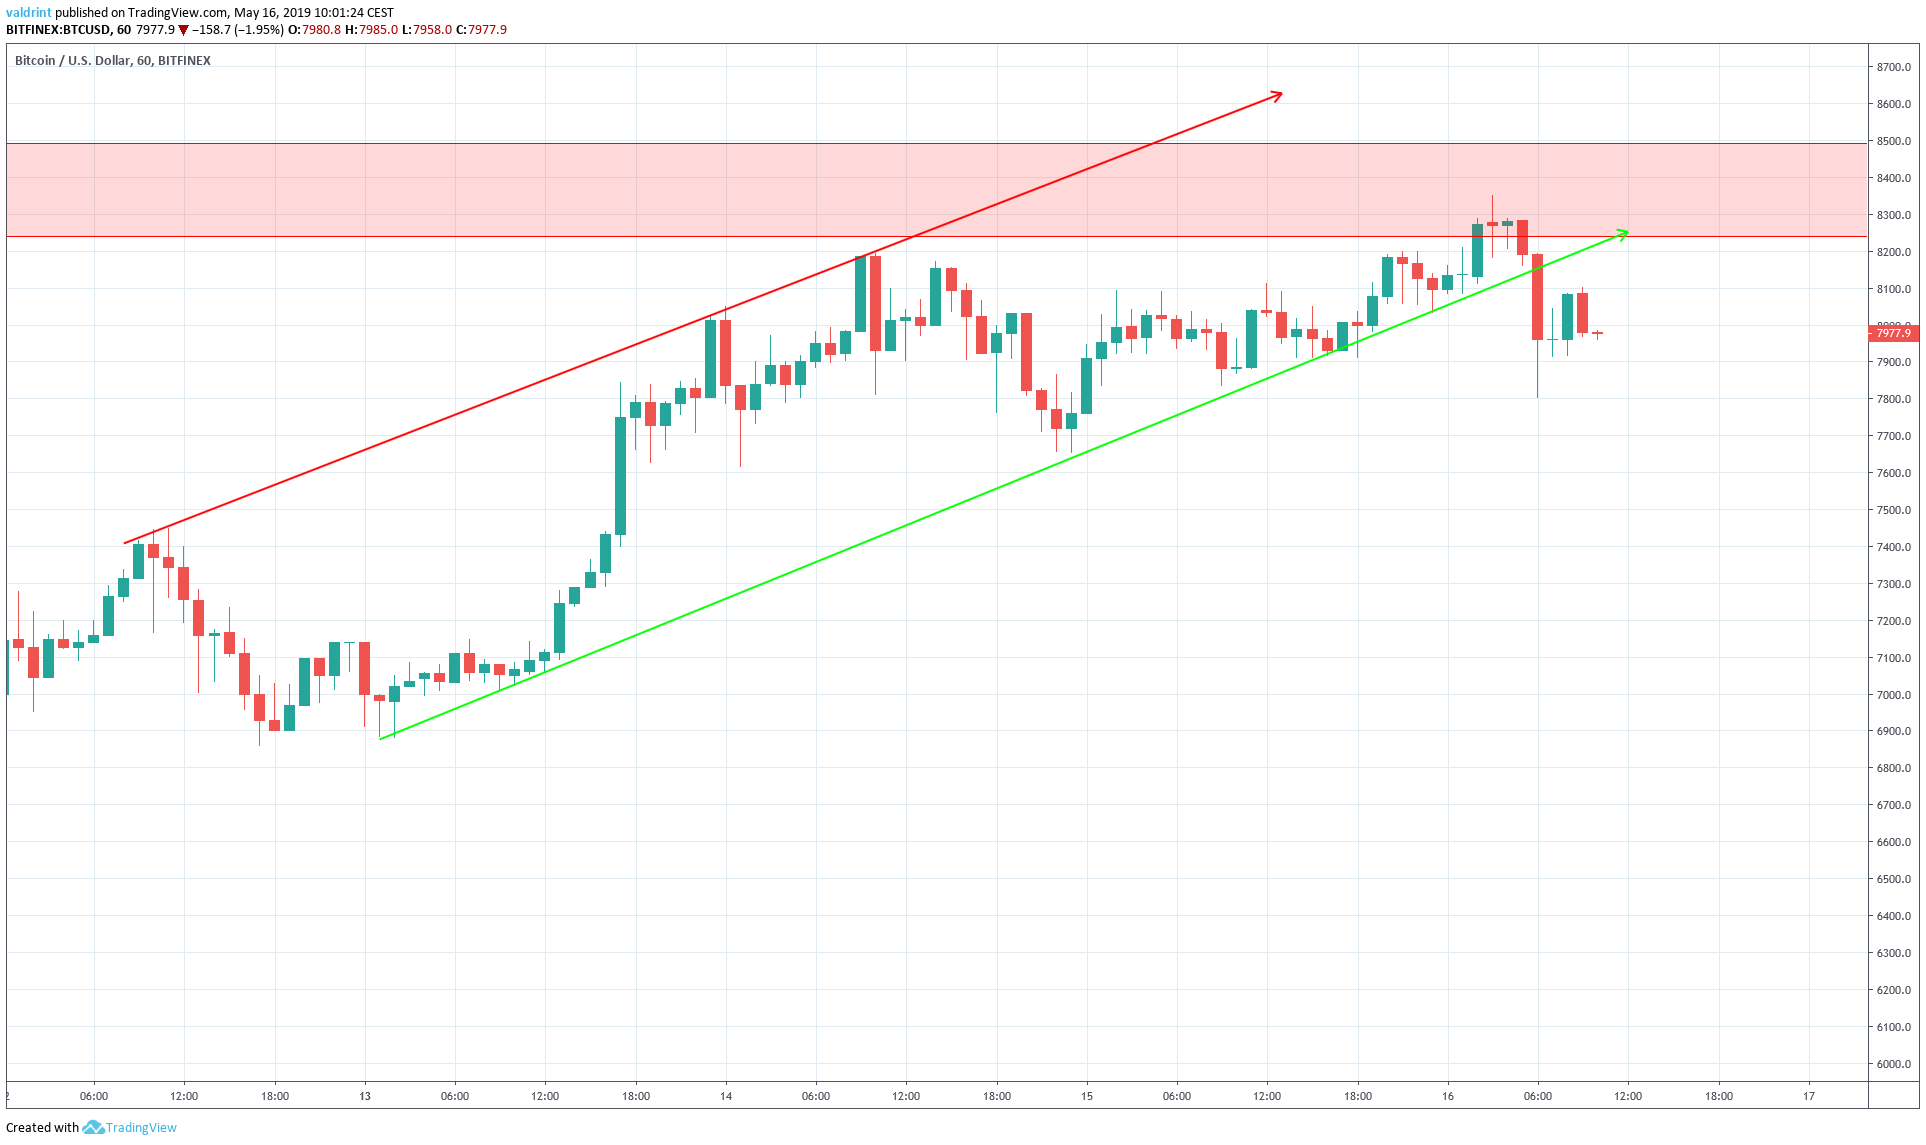
On May 16, the price reached our resistance area of $8300-$8500. Afterward, it broke down from the channel, reaching lows of $7800.0
If the breakdown was legitimate, a reversal may have already been initiated. This could indicate that severe price drops may occur in the short-term.
In order to assess the validity of the breakdown, the price of BTC is analyzed at one-hour intervals alongside volume:
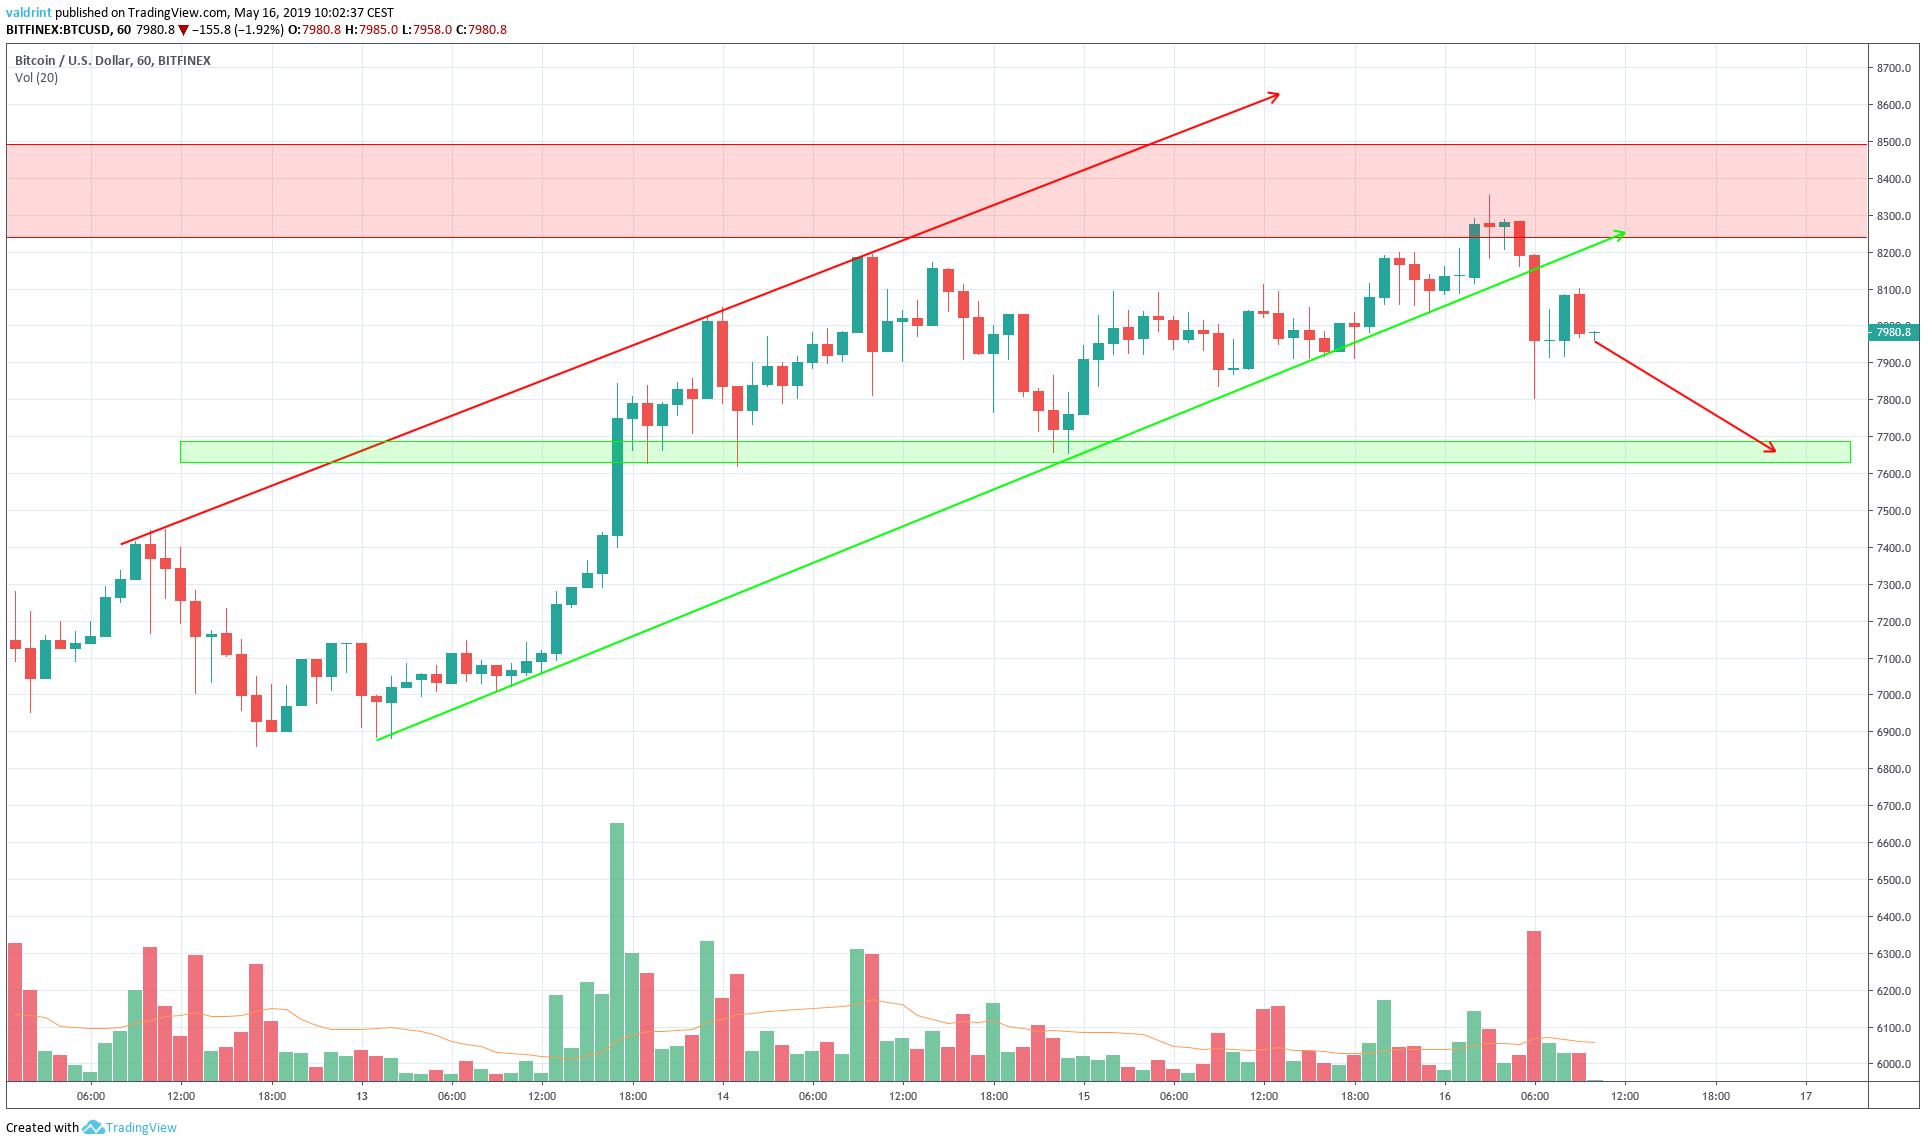
We can see that the breakdown occurred with above-average volume. This suggests that the breakdown is legitimate and the price will continue to decrease.
We believe it is likely that it will reach the support area near $7650 in the near future.
At the current time, we do not see any profitable trade setups for BTC until the price reaches our support area.
Now, let’s take a look at LTC/USD:
Litecoin’s Wedge
On May 4, the price reached a high of $86.65. A gradual decrease followed, and the price made a low of $76.07 on May 10.
Price then spiked and broke out of the ascending channel outlined in the graph below on May 15:
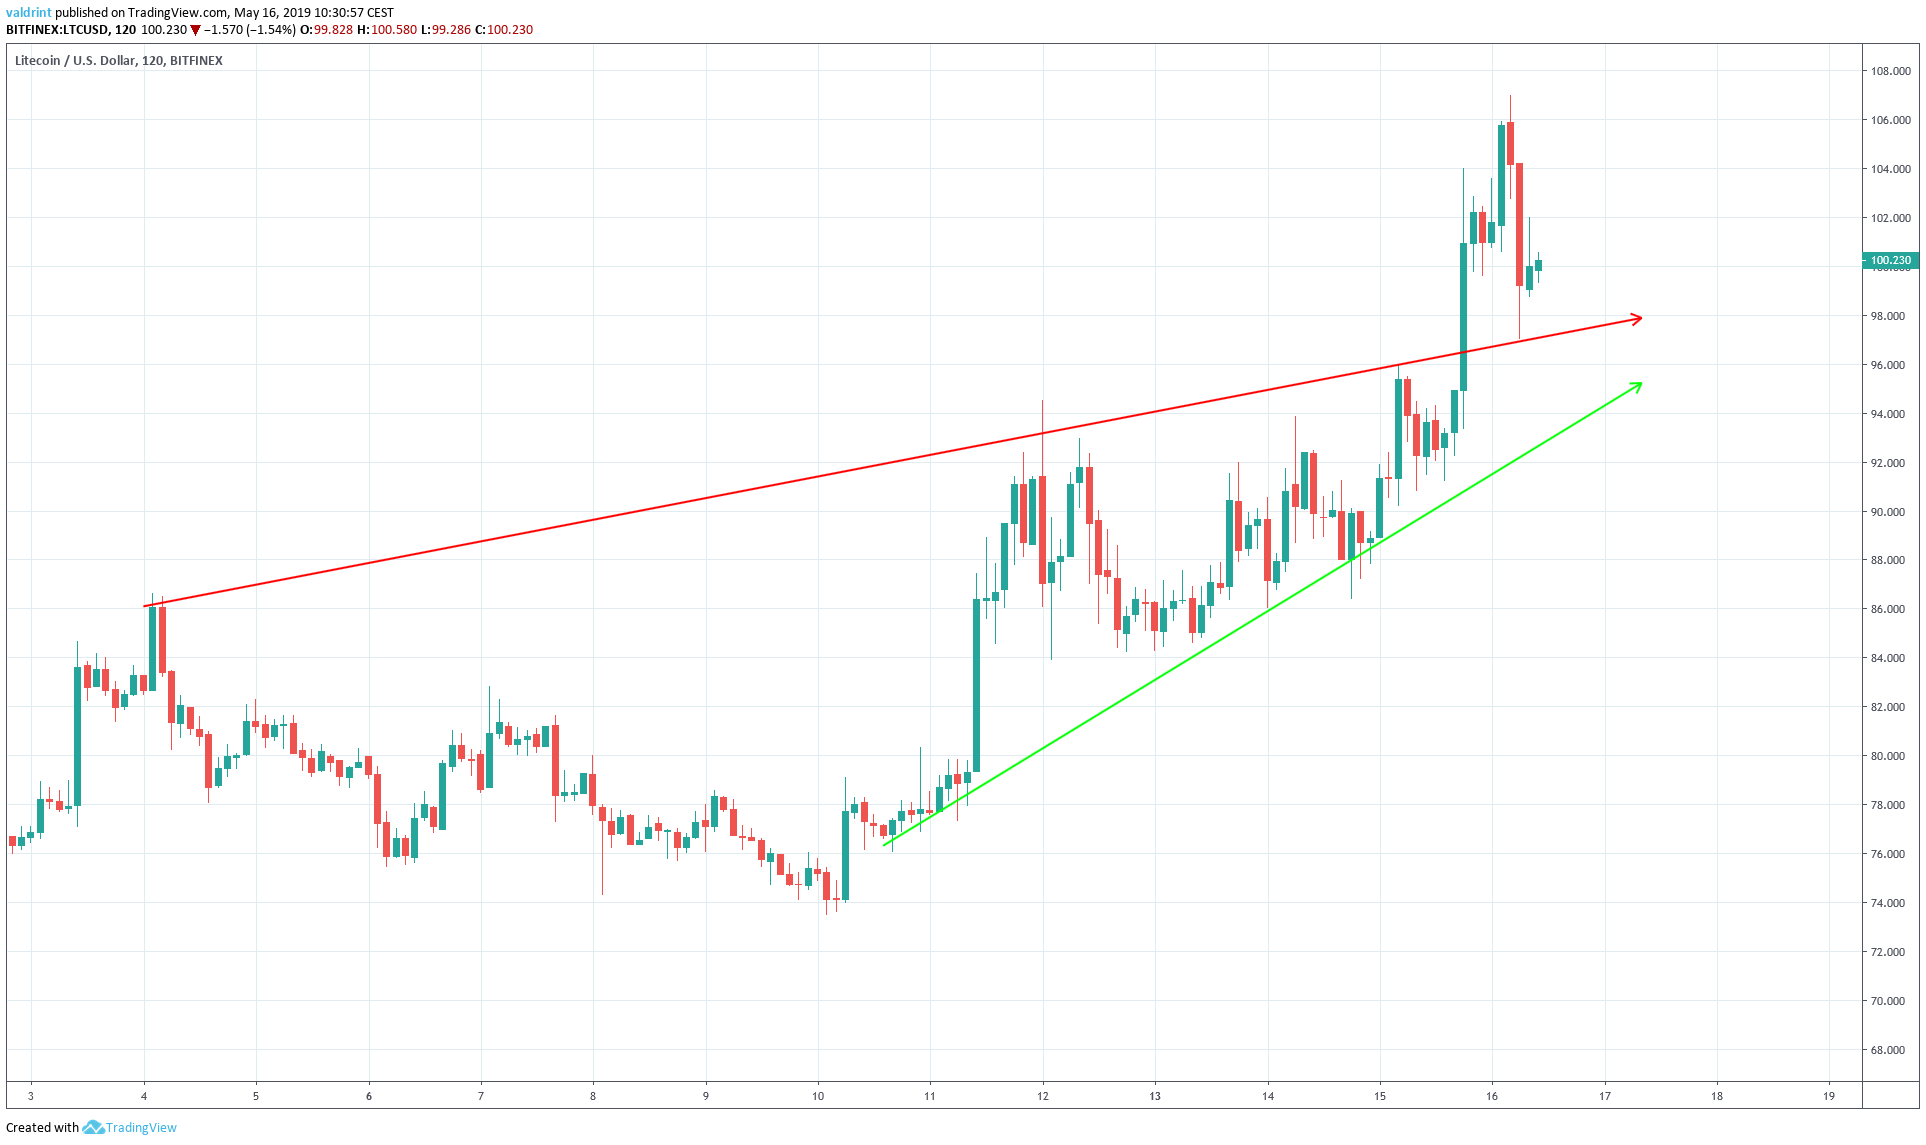
The next day, LTC reached a high of $106.9 and then dropped to touch the resistance line. If the price continues falling, then May 15’s break out may be considered false.
To better determine the validity of the breakdown and predict future fluctuations, we analyze the price of LTC at two-hour intervals alongside volume and the RSI in the graph below:
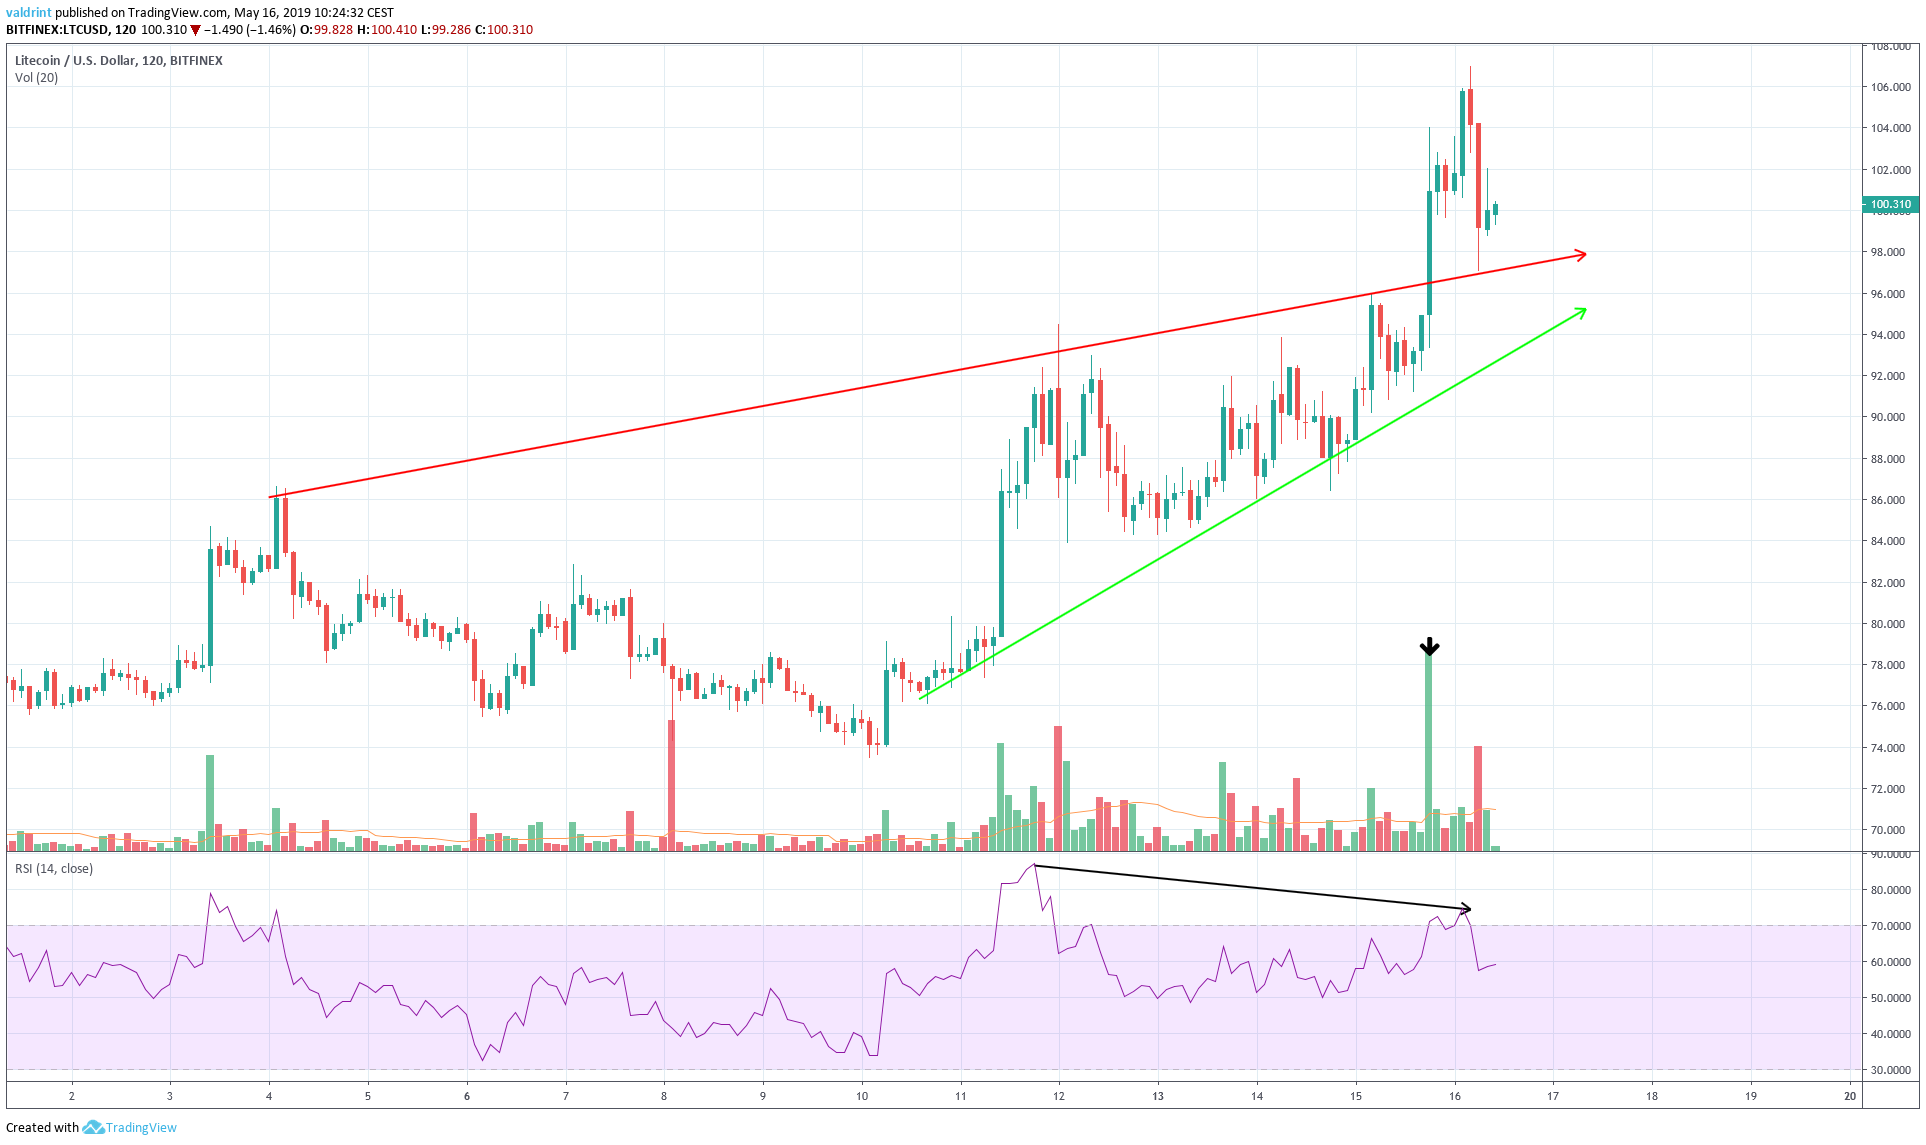
Similar to BTC, we can see that the breakout occurred with above-average volume. However, a bearish divergence is developing the RSI. This divergence is also present in longer timeframes.
Therefore, these two indicators are in conflict. The volume suggests that the breakout was legitimate while the bearish divergence suggests the opposite.
Therefore, we are unable to initiate a trade setup. Our previous short was unsuccessful and the stop loss of less than 5% was triggered.
Finally, let’s take a look at BCH/USD:
An Ascending Channel For Bitcoin Cash
On May 11, the price reached a low of $314.98 and a high of $387.99. Since then, it has been trading inside the ascending channel outlined below:
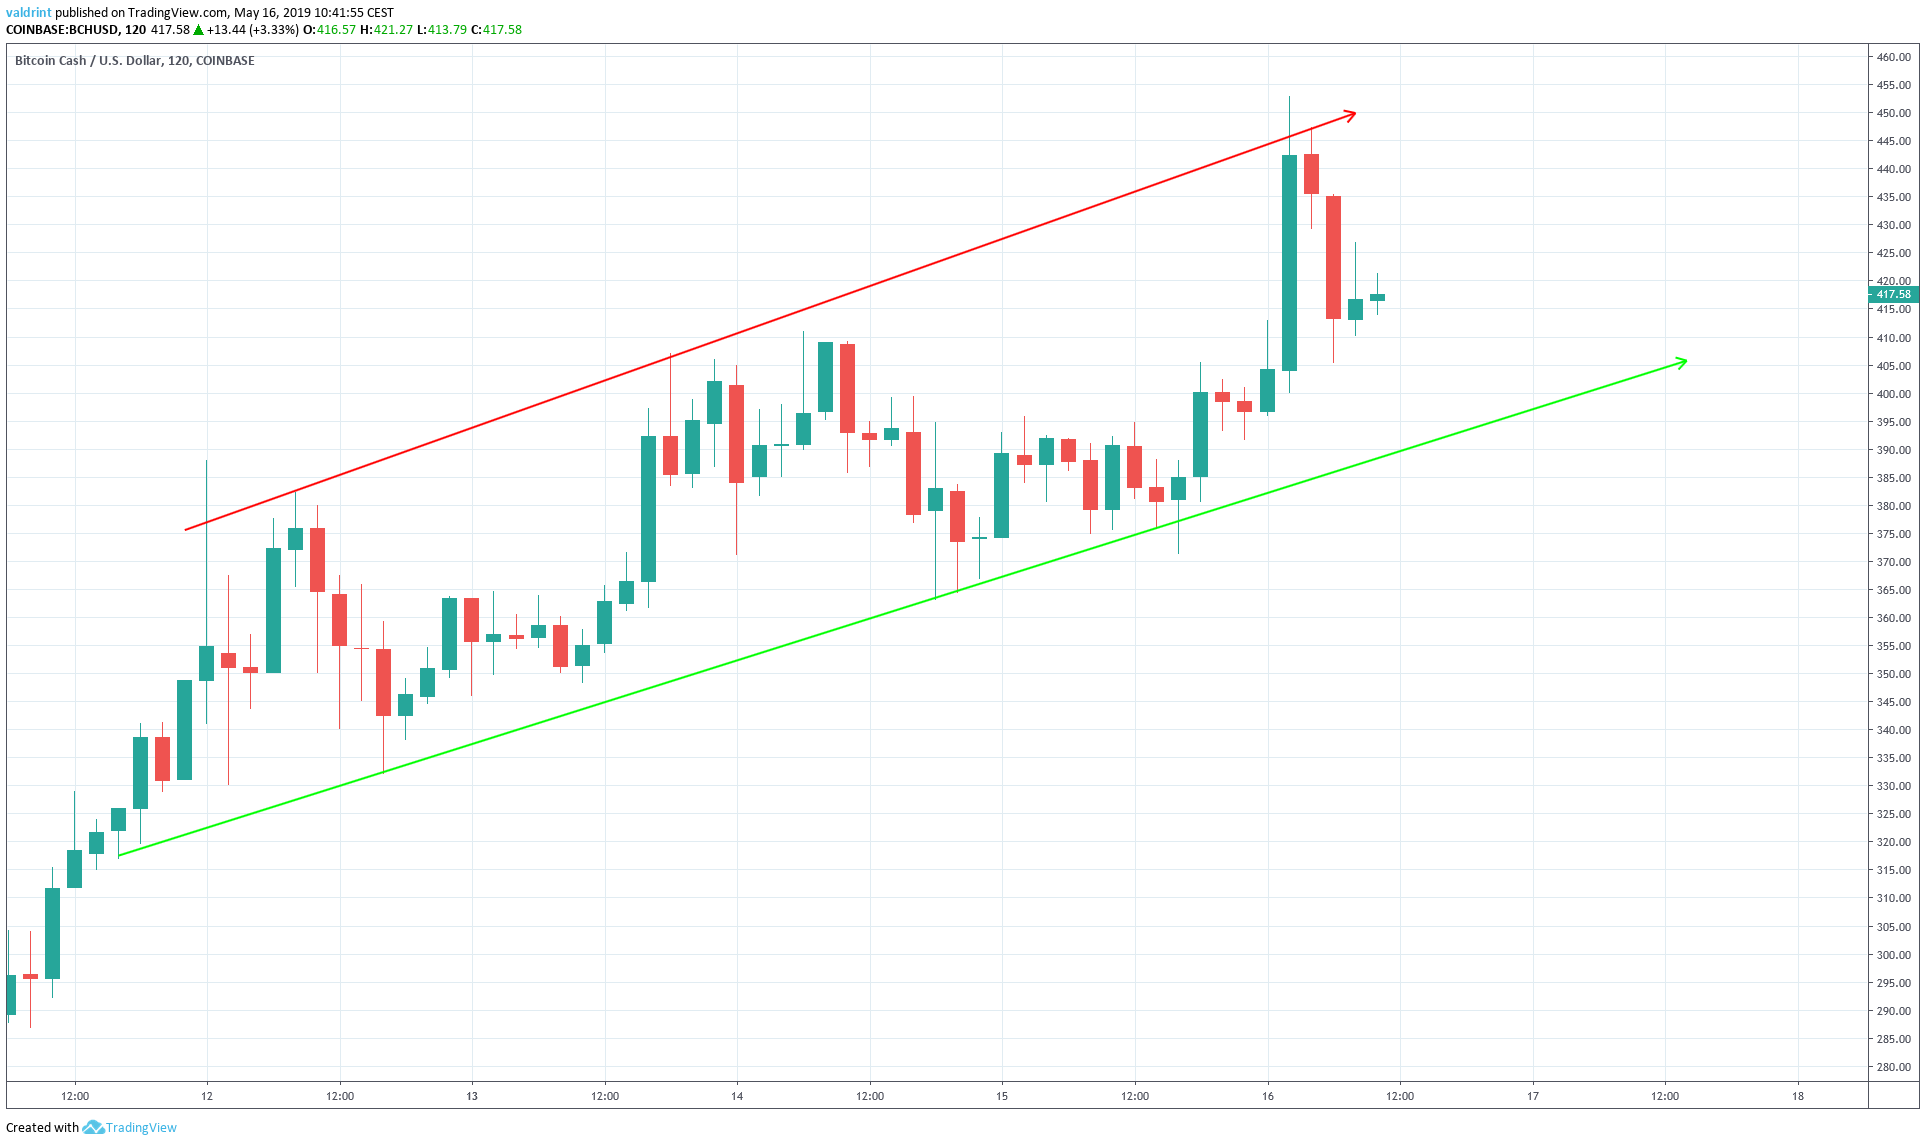
The resistance and support lines of the channel have both been touched four times.
In order to predict future movement, we have outlined the four-hour price of BCH/USD alongside the RSI and the MACD below:
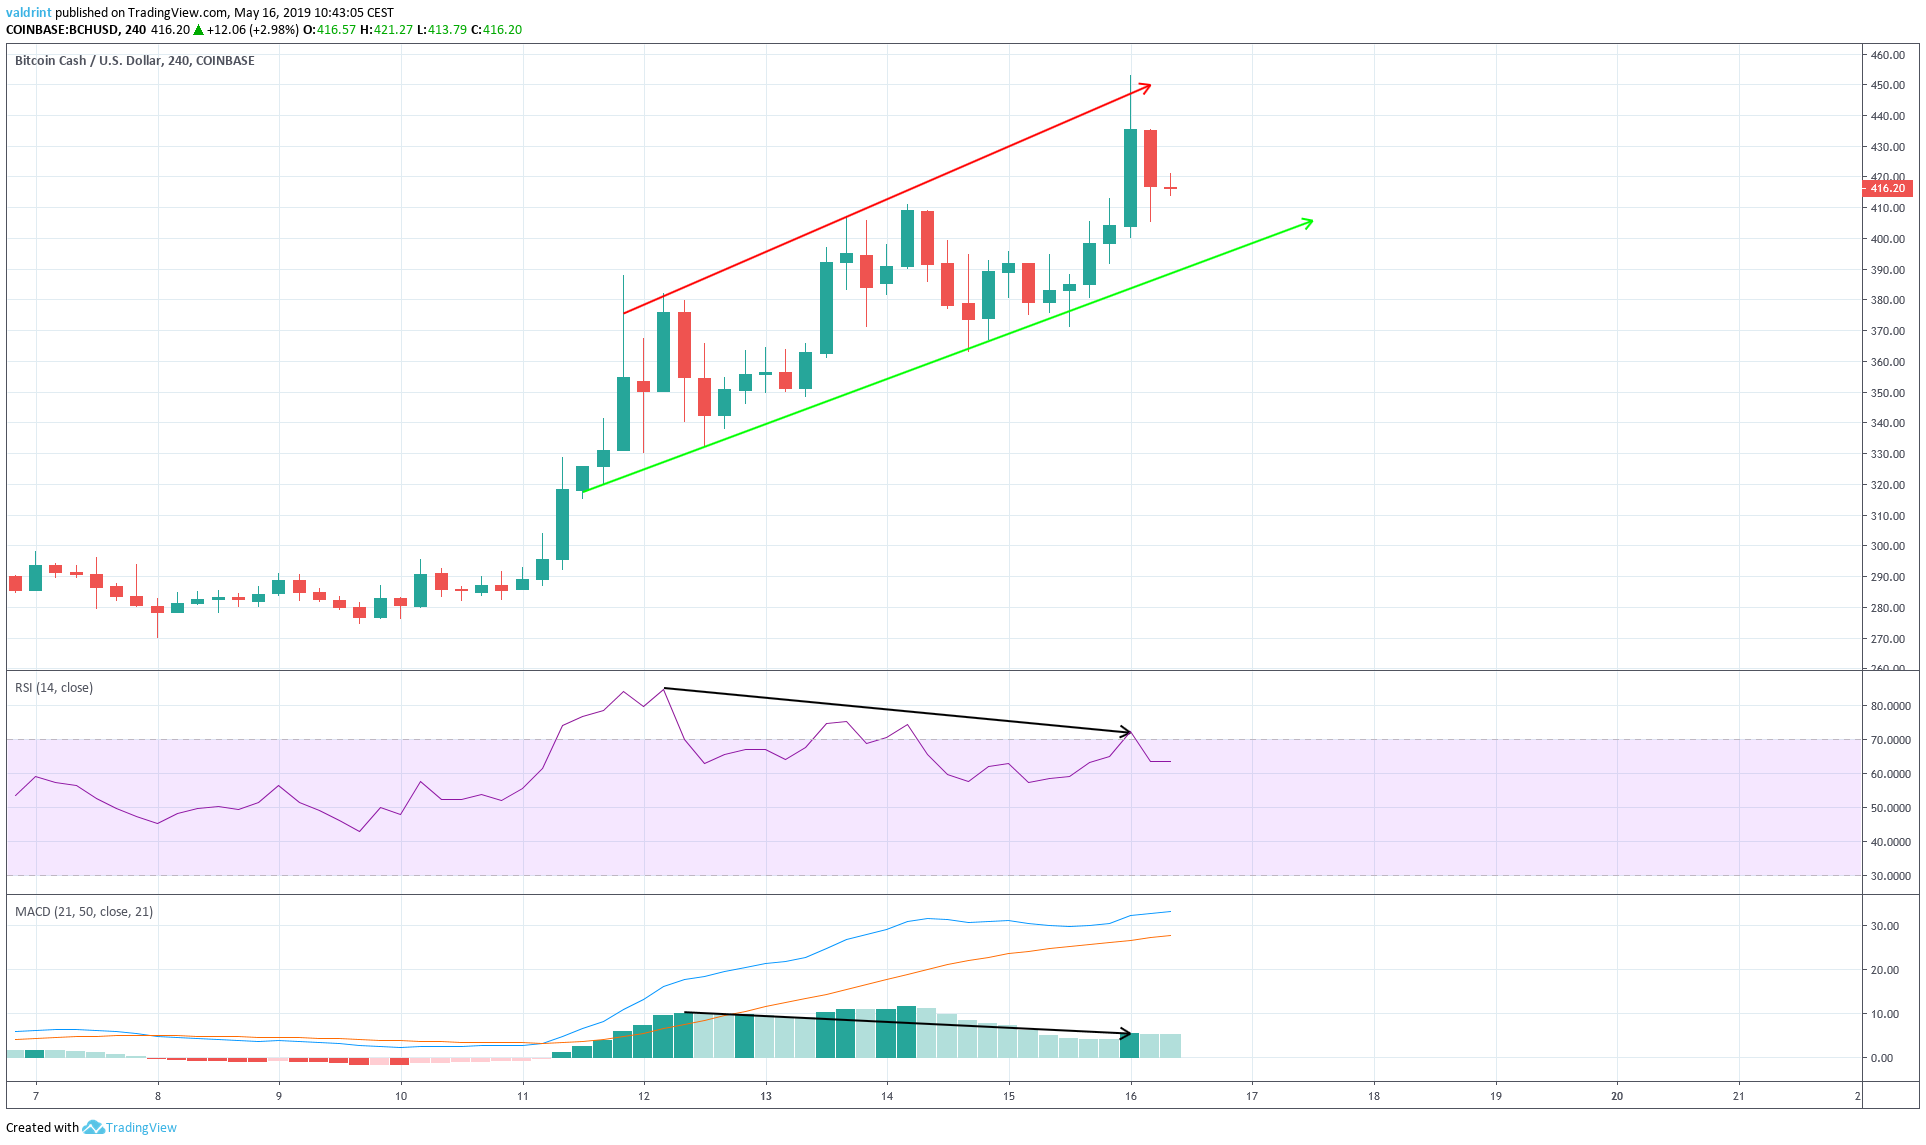
Similar to BTC we see bearish divergence in the RSI. In addition, there is bearish divergence in the MACD. Thus, price decreases appear likely.
In the short term, we believe that the price will continue falling toward the support line of the channel.
Due to the fact that the price is trading in the middle of the channel, we cannot initiate a short trade setup.
Our previous short was unsuccessful and the stop loss of 7% was triggered.
Conclusion
To conclude, LTC and Bitcoin BCH are both following ascending support lines. However, LTC is not following any resistance lines, while BCH is trading inside an ascending channel.
BTC recently broke out of its trading pattern and is not currently following a trading structure, though a new trading pattern may be forming. It has reached the major resistance area near $8300-$8500.
Furthermore, LTC recently broke out from its trading pattern, while BTC broke down. All three have developed bearish divergence. However, due to recent surges in price, we cannot rule out further increases.
To conclude, we believe that LTC faces the best prospects for the near future, due to the fact that it recently broke out from its pattern and is not currently following any resistance lines.
Conversely, BCH is trading inside a gradually increasing pattern, while BTC has broken down.
No viable trade setups were identified.
A summary is presented in the table below:
Do you think the price of Litecoin will continue to increase? Will BTC continue its breakdown? Where will the price of BCH go? Let us know in the comments below.
Disclaimer: This article is not trading advice and should not be construed as such. Always consult a trained financial professional before investing in cryptocurrencies, as the market is particularly volatile.


