


The BONK price increased considerably in February, breaking out from diagonal and horizontal resistance levels.
Will the price sustain this increase, or was the movement just a relief rally? Let’s find out.
BONK Breaks Out From Resistance
The technical analysis of the daily time frame shows the BONK price broke out from a descending resistance trend line on February 7. Before the breakout, the trend line had existed for 55 days.
More specifically, the trend line had existed since the all-time high on December 15, 2023. Today, BONK reached a high of $0.000014 before falling slightly.
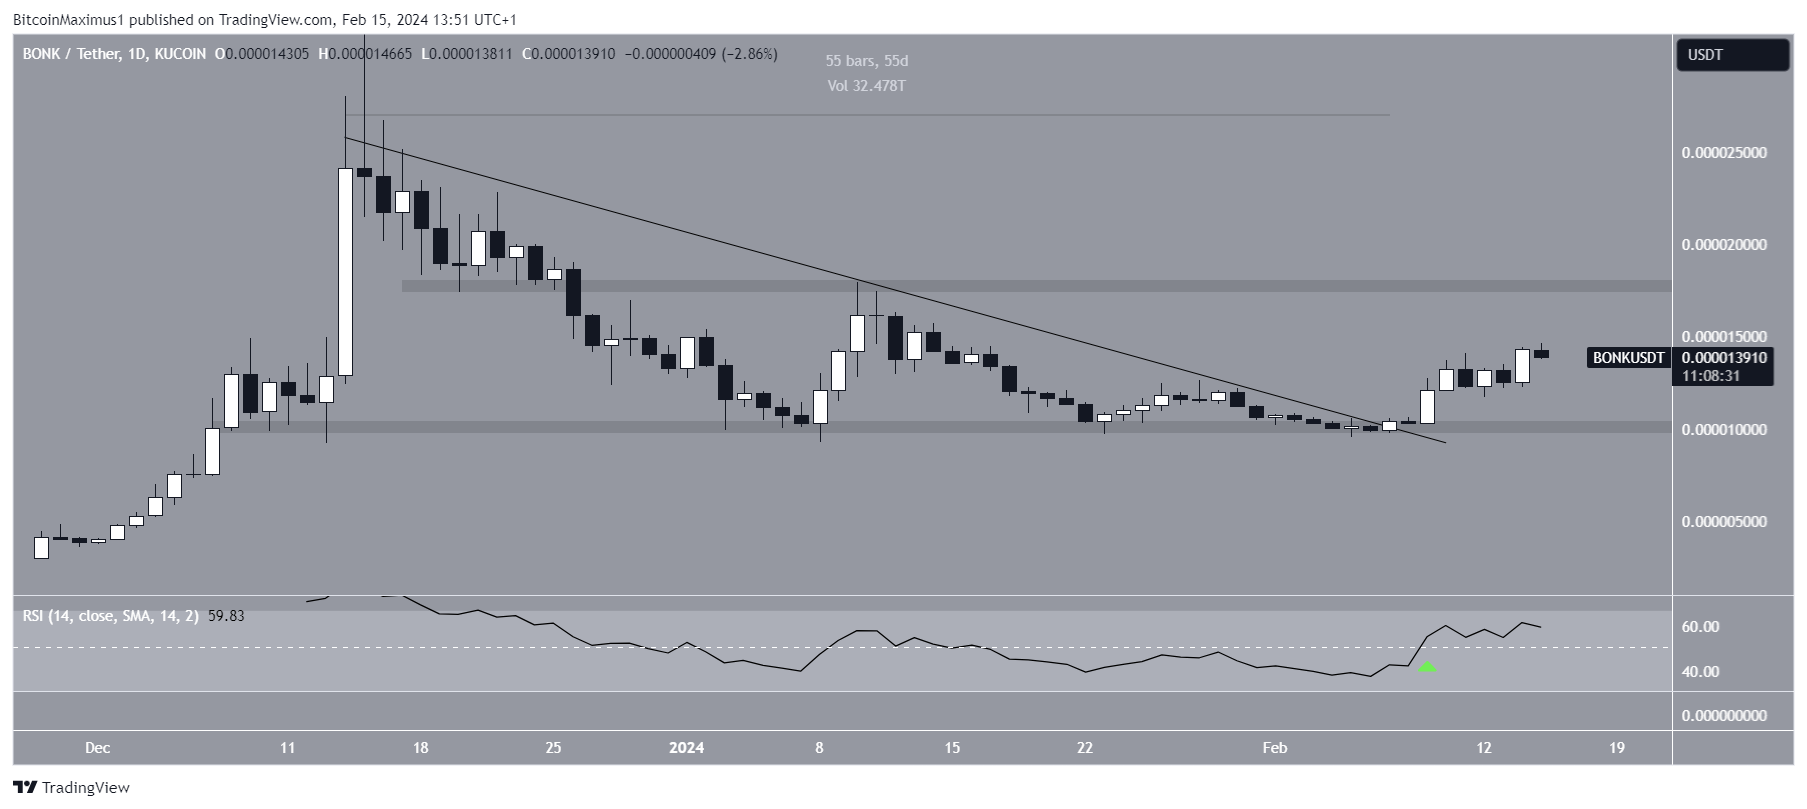
The daily Relative Strength Index (RSI) gives a bullish reading. Traders utilize the RSI as a momentum indicator to assess whether a market is overbought or oversold and whether to accumulate or sell an asset.
If the RSI reading is above 50 and the trend is upward, bulls still have an advantage, but if the reading is below 50, the opposite is true. The indicator exceeded 50 once the price broke out, legitimizing the breakout.
Read More: What Are Meme Coins?
BONK Price Prediction: Will the Breakout Be Sustained?
The six-hour chart gives a more undetermined trend than the bullish daily time frame readings. This is because of conflicting readings from the price action and the Relative Strength Index (RSI).
The price action shows that BONK broke out from a horizontal and Fib resistance at $0.000014.
However, the six-hour RSI shows a pronounced bearish divergence (green). Such divergences occur when a momentum decrease accompanies a price increase. They often lead to bearish trend reversals.
So, whether the BONK price bounces or closes below the $0.000014 area can determine the future trend’s direction.
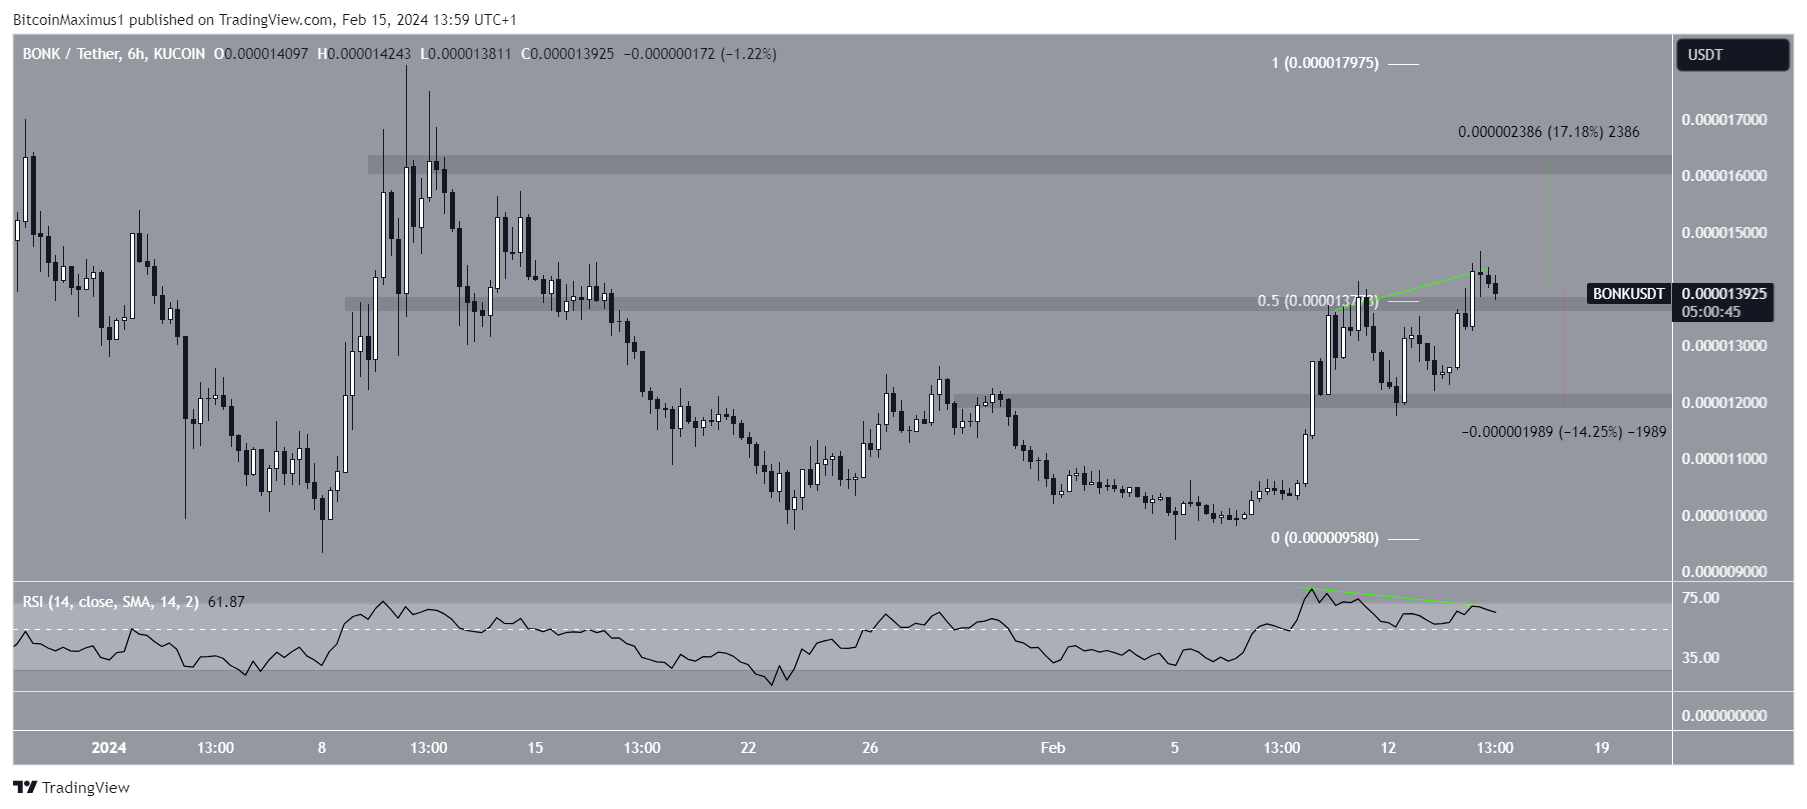
A successful bounce can catalyze an 18% BONK increase to the next resistance at $0.000016, while a breakdown can cause a 14% drop to the closest support at $0.000012.
Read More: 7 Hot Meme Coins That Are Trending in 2024
For BeInCrypto‘s latest crypto market analysis, click here.


