


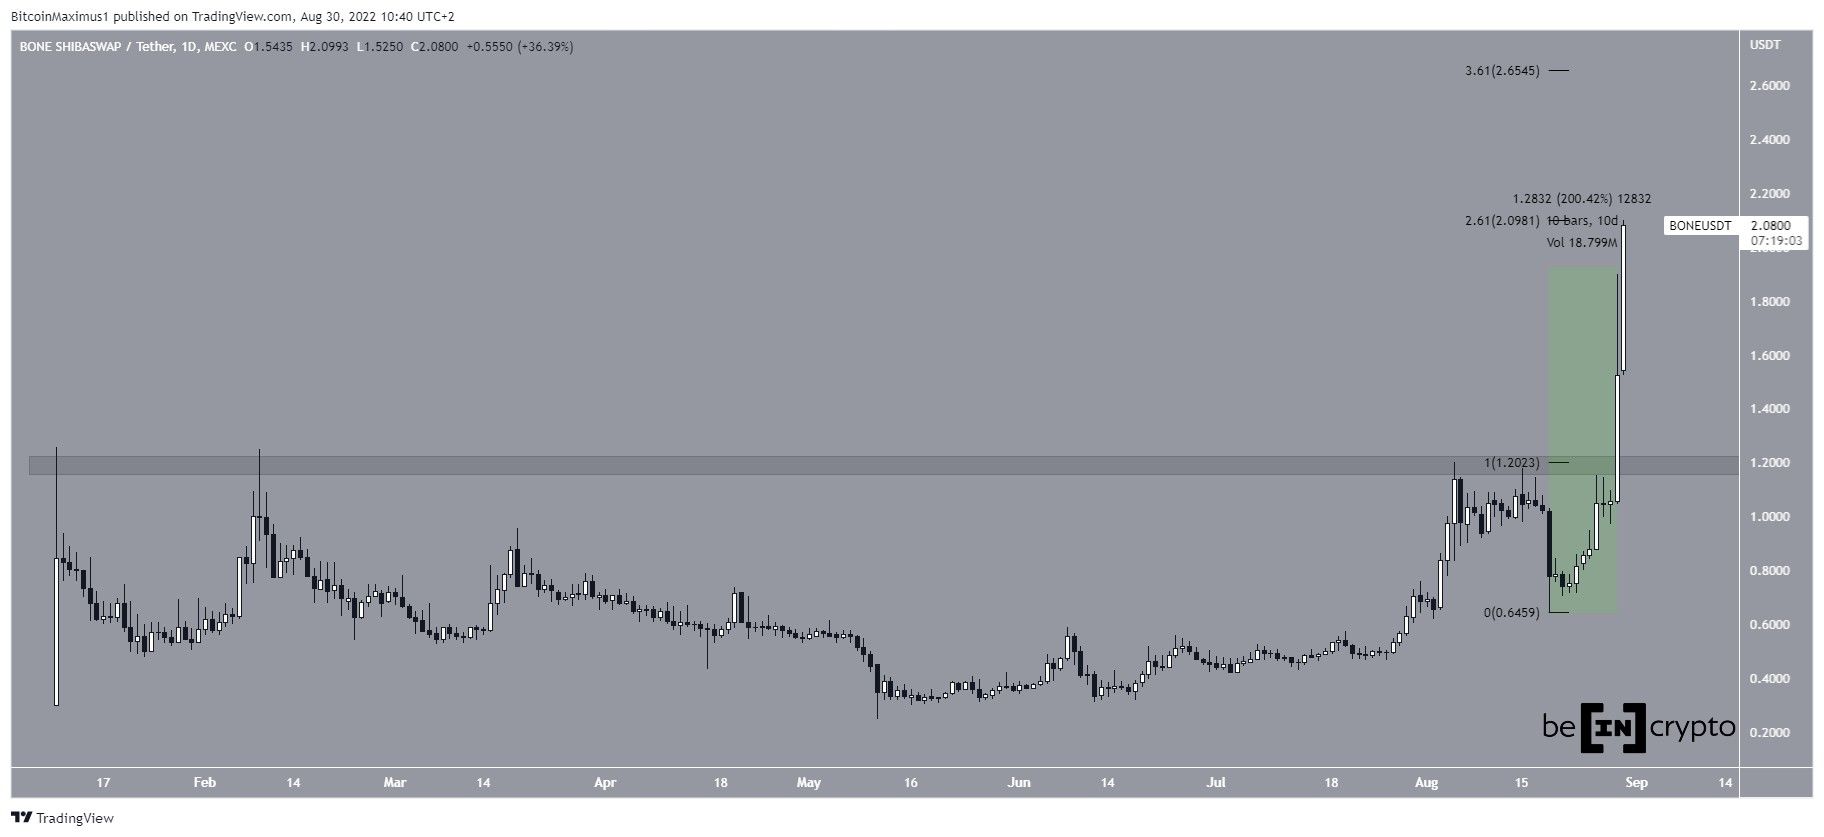
Bone ShibaSwap (BONE) has been increasing at an accelerated rate since Aug 19. With its $2.10 high on Aug 30, it moved above a crucial Fib resistance level.
BONE is the governance token of the ShibaSwap ecosystem. It allows holders to vote on proposals, with the weight of their vote being proportional to the amount of their holdings.
Since the beginning of the year, the price had struggled to break out from the $1.20 horizontal resistance area. During this time, it made three unsuccessful breakout attempts.
However, the price initiated a rapid upward movement on Aug 19 and managed to successfully break out on Aug 29. Throughout this upward movement, BONE increased by 200% in 10 days and resumed its upward movement on the 11th day. The acceleration of the upward movement over the past two days aligned with the listing of BONE in the BlueBit exchange.
It is currently trading at the 2.61 external Fib retracement resistance at $2.10. If successful in moving above it, the next resistance would be at $2.65, created by the 3.61 external Fib retracement resistance level.
Cryptocurrency and stock trader @mindandtrading tweeted a chart of BONE which shows that the price has reached a high of $2. He suggested that the next resistance will be at $2.60.
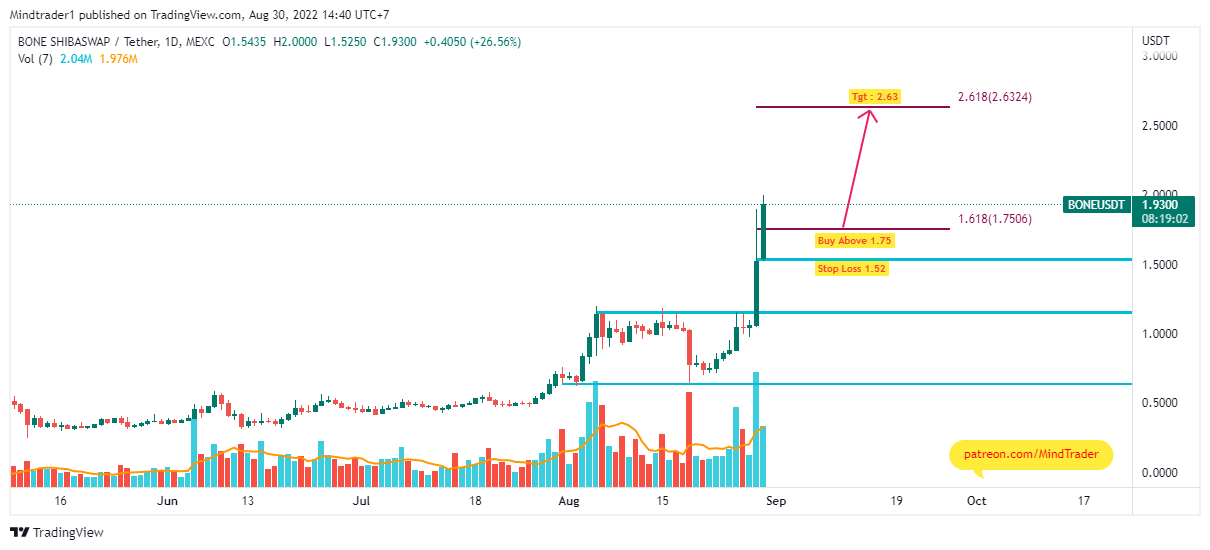
The resistance area is in alignment with the 3.61 external Fib retracement level when measuring the previous downward movement.
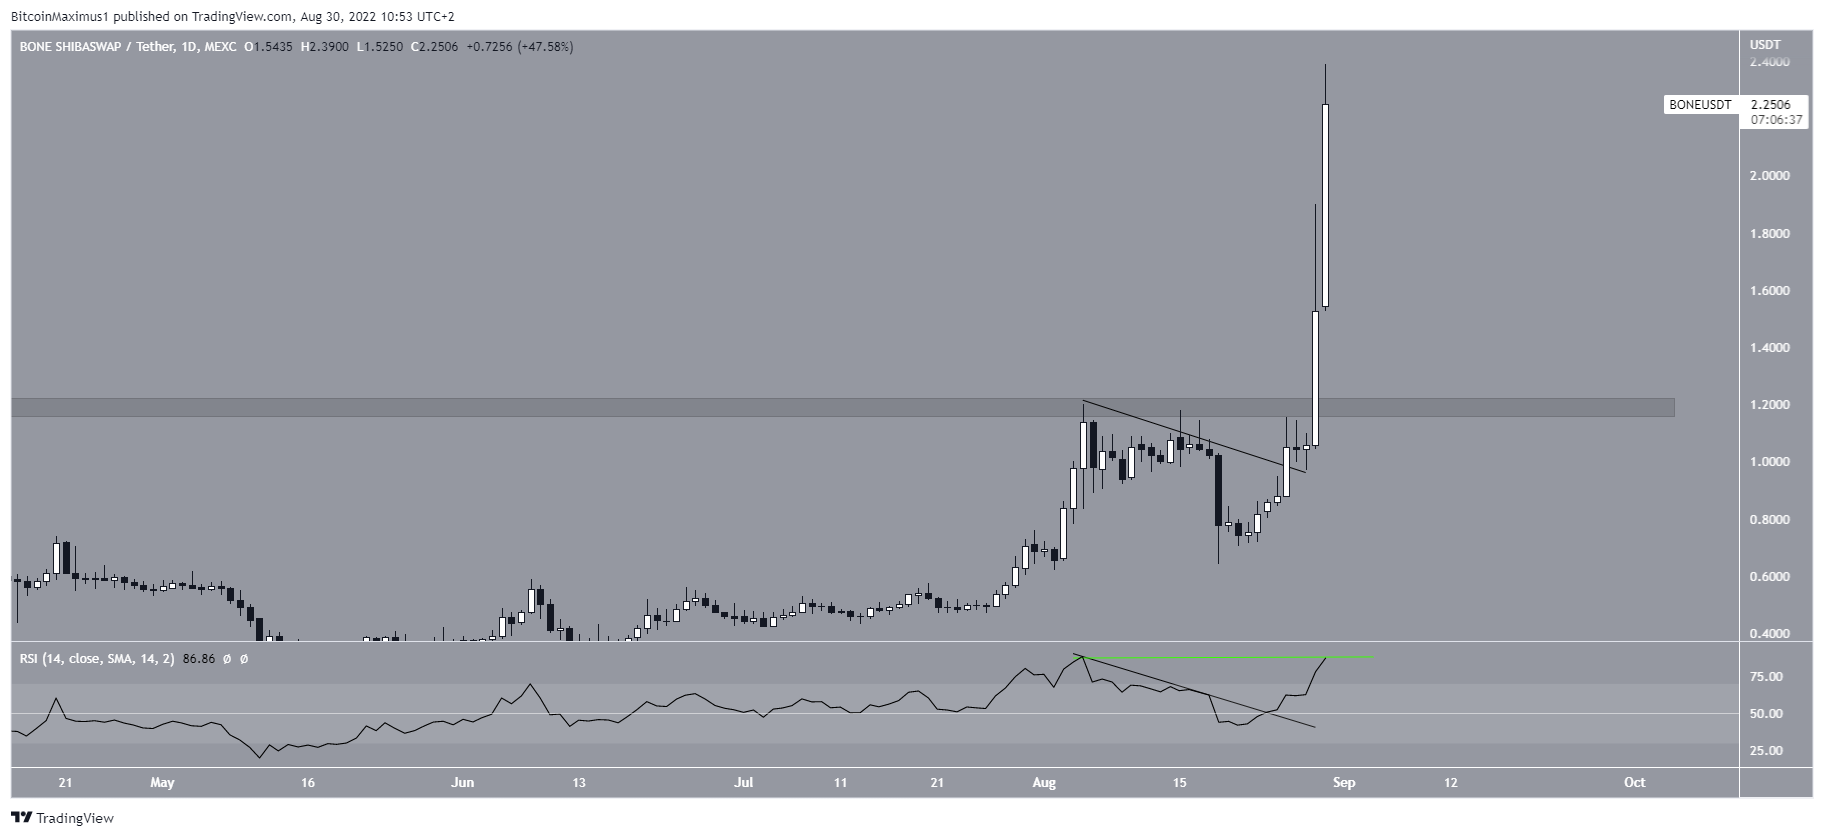
Lack of bearish divergence
The readings from the RSI support the continuation of the upward movement towards the outlined targets. The first reason for this is that the indicator has broken out from a descending resistance line, and the second one is that there is no bearish divergence present in the daily RSI, even though the indicator is overbought.
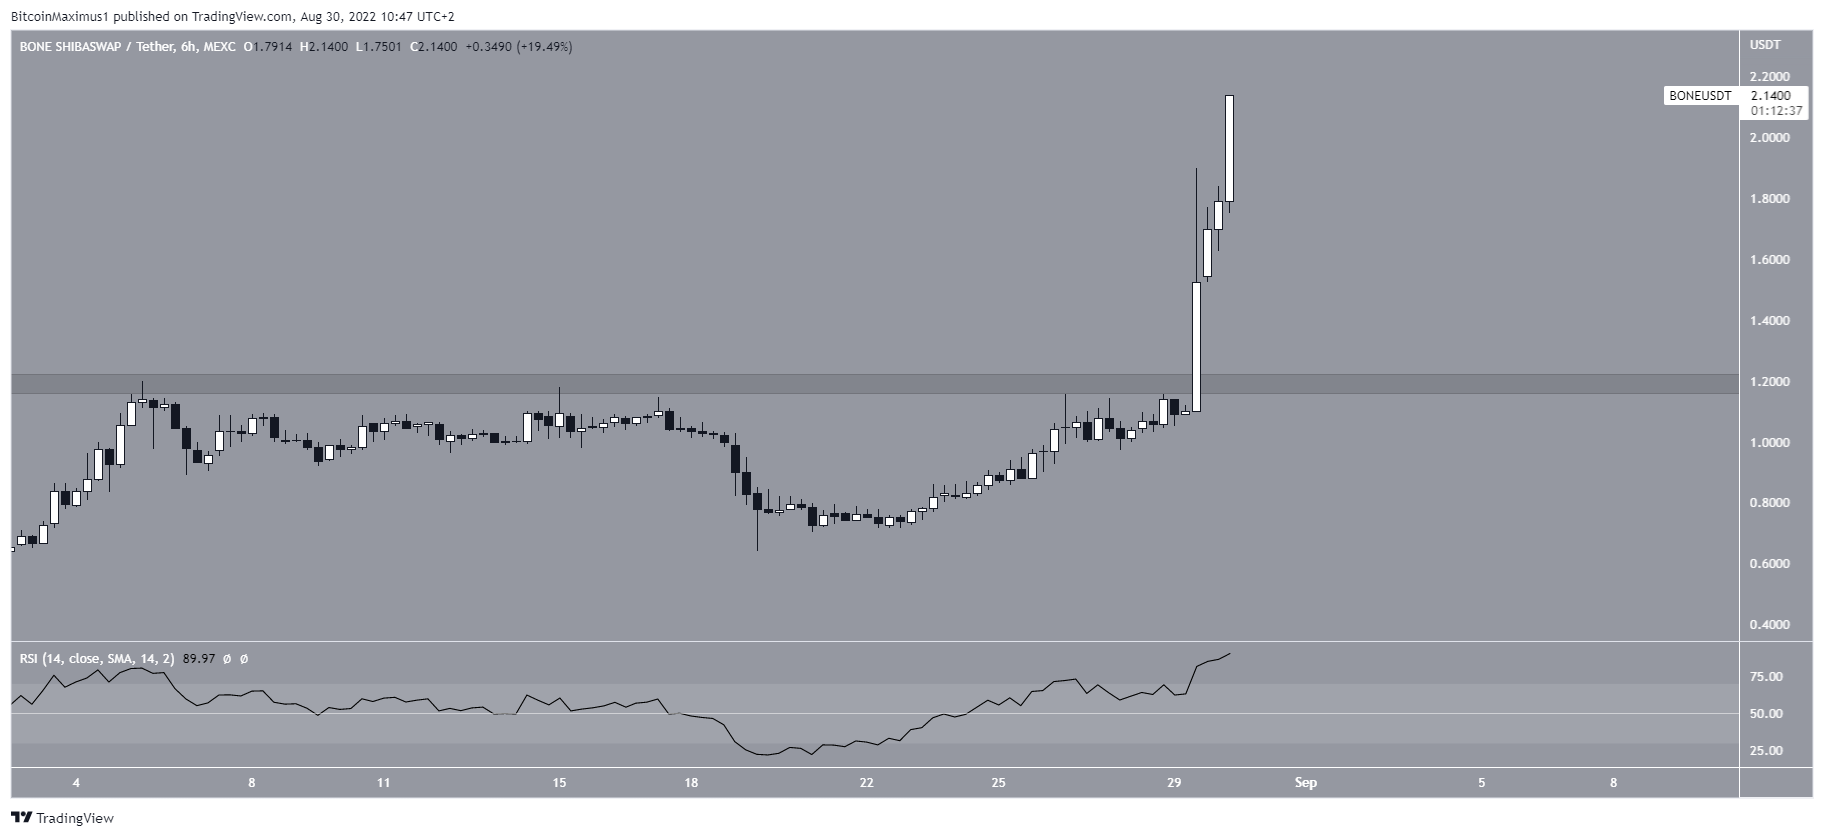
Similarly, there is no bearish divergence present in the six-hour time frame RSI. On the contrary, the indicator is increasing even though it is deep inside overbought territory.
As a result, the most likely scenario indicates that an upward movement toward at least the $2.65 area could occur.
For Be[in]Crypto’s previous Bitcoin (BTC) analysis, click here


