
The Binance Coin (BNB) price was rejected on Sept. 30 and initiated a drop that is still ongoing. While a short-term bounce is expected, the direction of the longer-term trend is unclear.
Creation of a Lower High
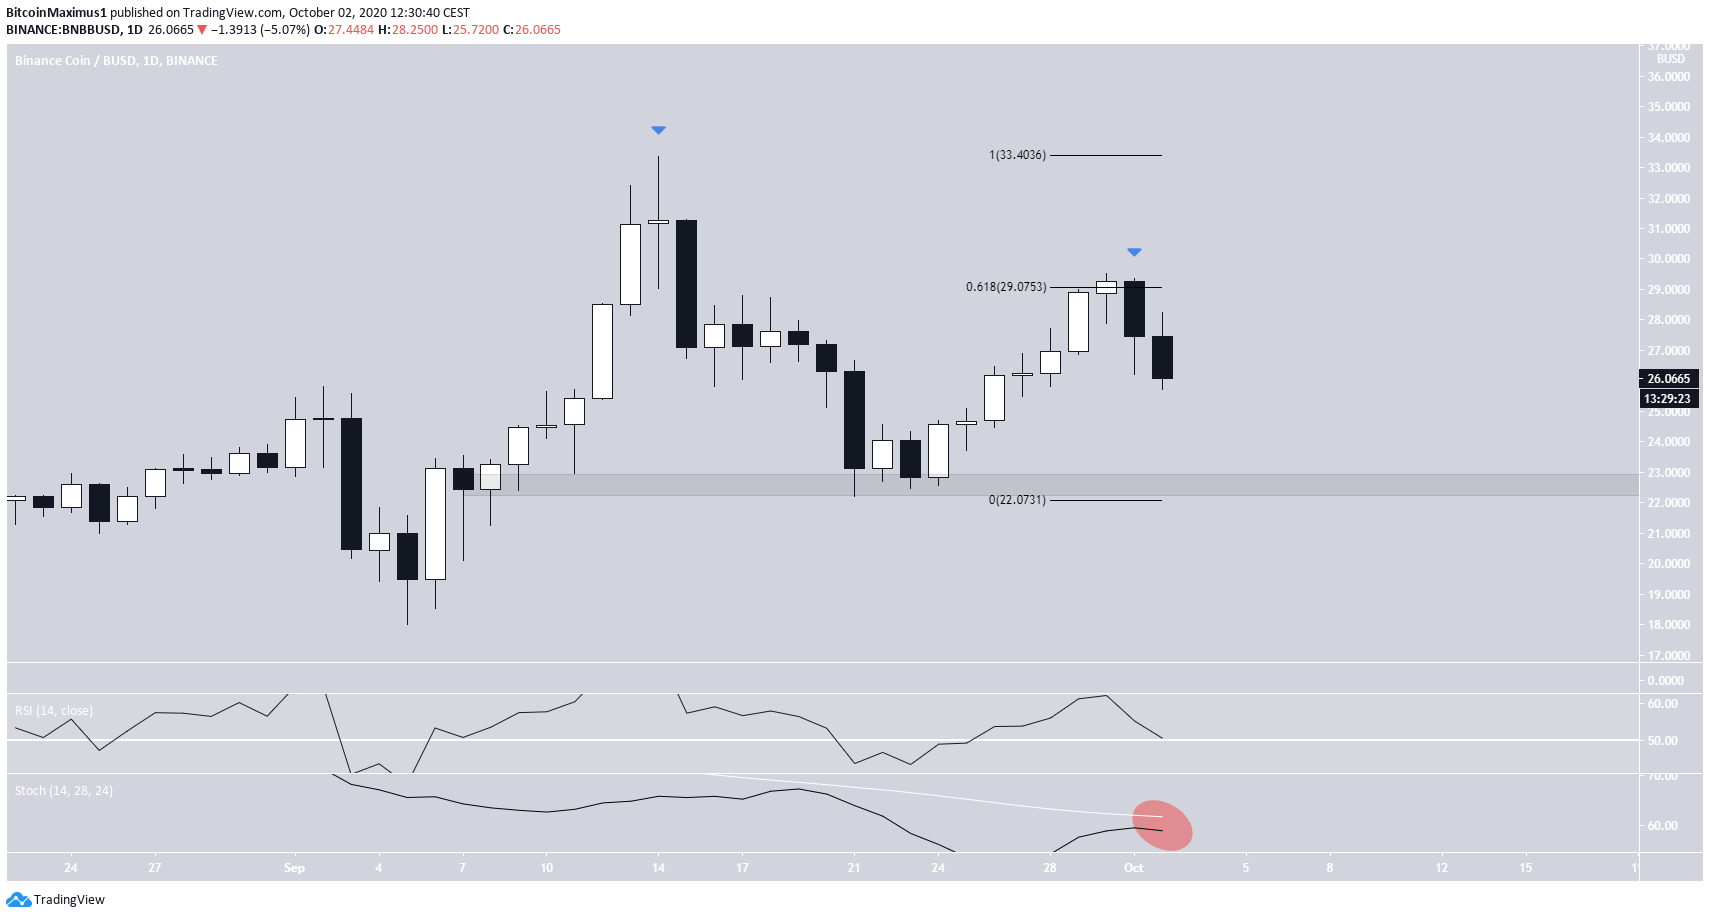
On Sept. 14, the BNB price reached a high of $33.35. However, the price created a doji candlestick and followed that up with a bearish engulfing one, successfully completing an evening star (known as a bearish reversal pattern).
The decline continued until the price reached a low of $22.22 on Sept. 21, validating the $22.50 area as support.
On Sept 30, the price was rejected by the 0.618 Fib level of the entire decline and dropped once more. This successfully created a lower high at a customary level for retracements.
Technical indicators are neutral. The RSI is trading above 50 but is falling, and the Stochastic oscillator seems to have rejected a bullish cross.
Weakness Leads to Drop
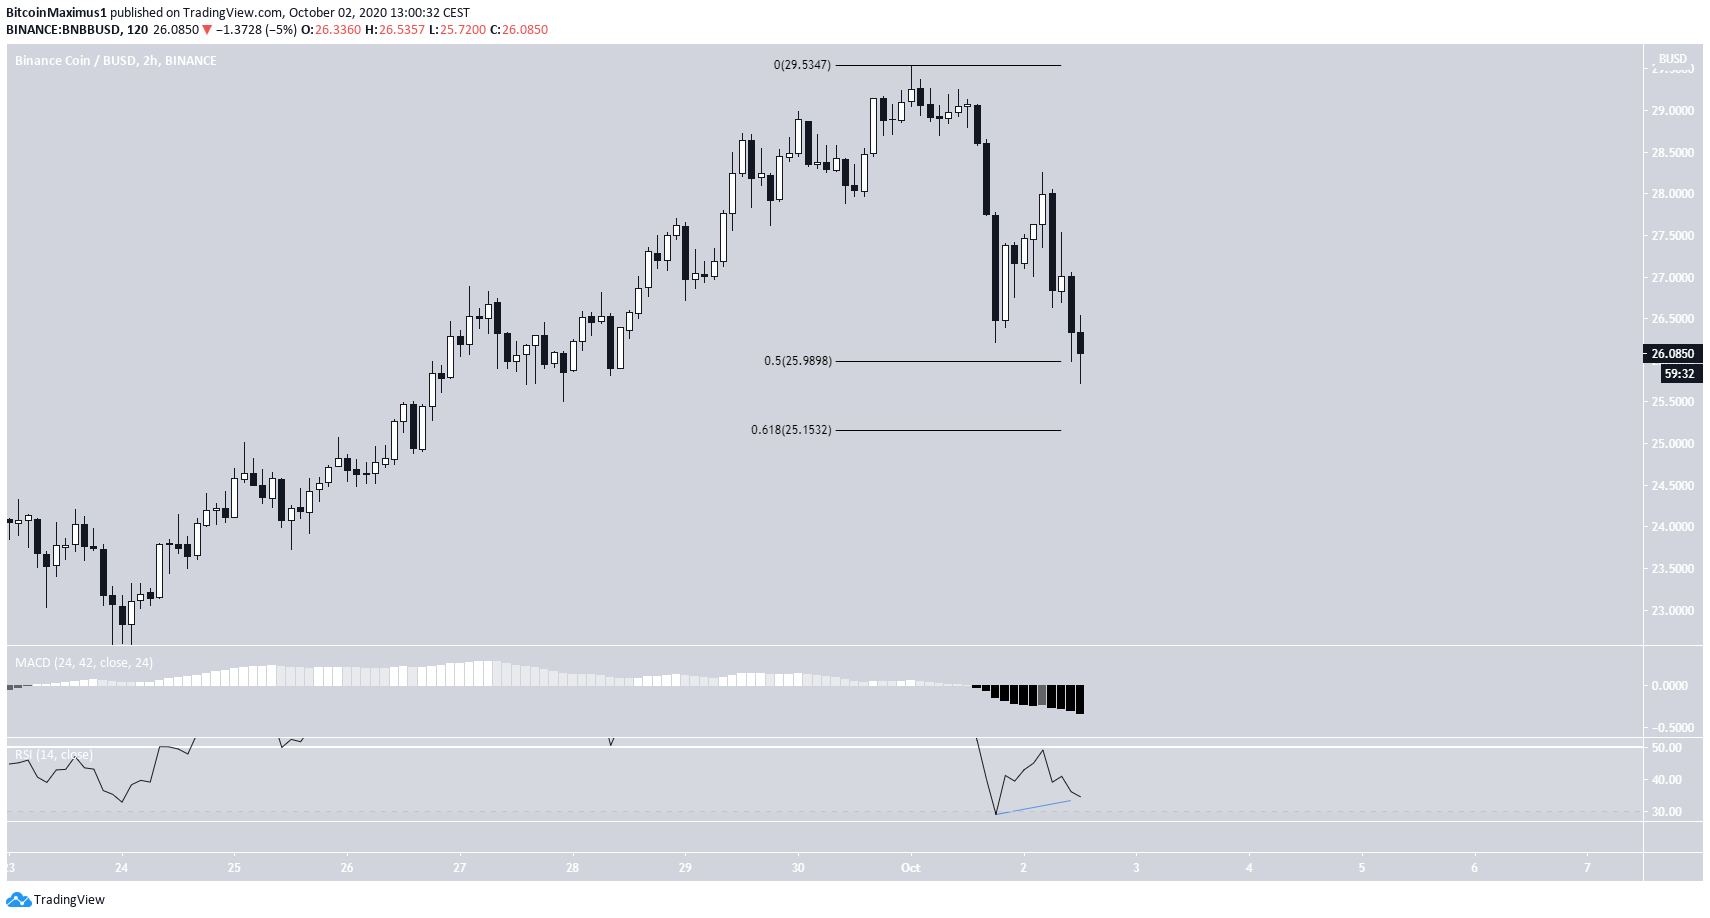
Cryptocurrency trader @devchart outlined a BNB chart, stating that that the price has increased by 12% and reportedly flipped a critical resistance level at $26.50. However, since the tweet, the price has been rejected and fallen below the resistance level again.

The 6-hour chart shows that the fall was preceded with bearish divergence on both the RSI and the MACD.
At the time of writing, the price was trading right at the 0.5 Fib level of the entire rally. To remain valid, BNB would soon need to reach a low and begin moving upwards.
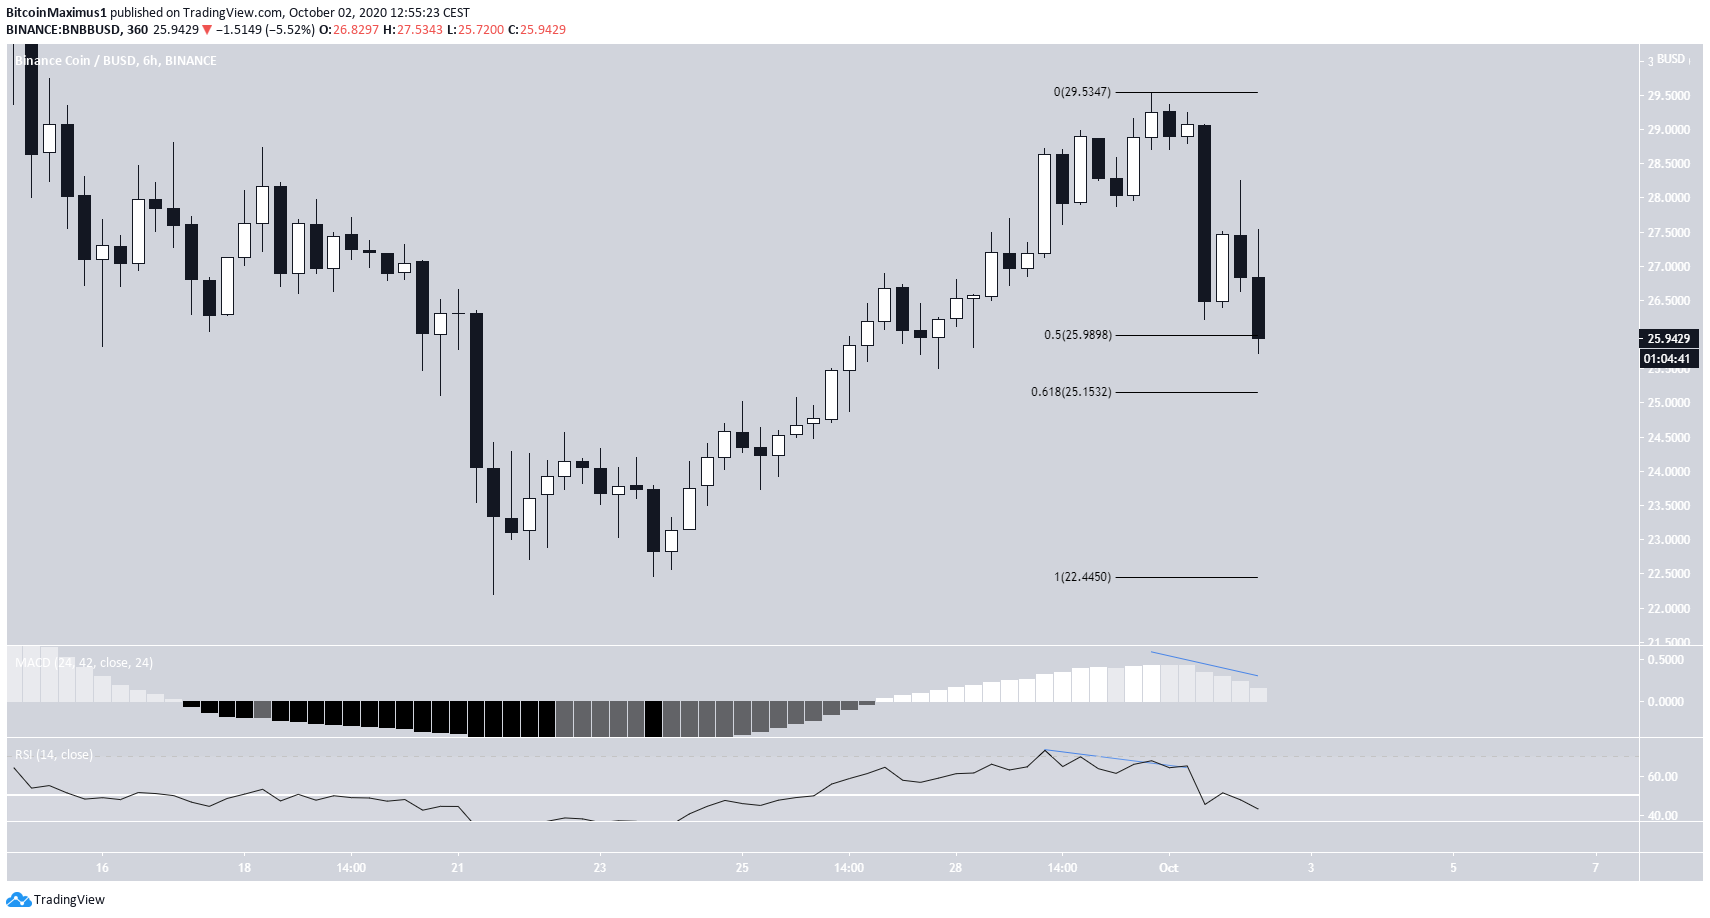
While there is an unconfirmed bullish divergence on the RSI, there are no other signs that would suggest that the price will reverse its bearish trend.
Wave Count
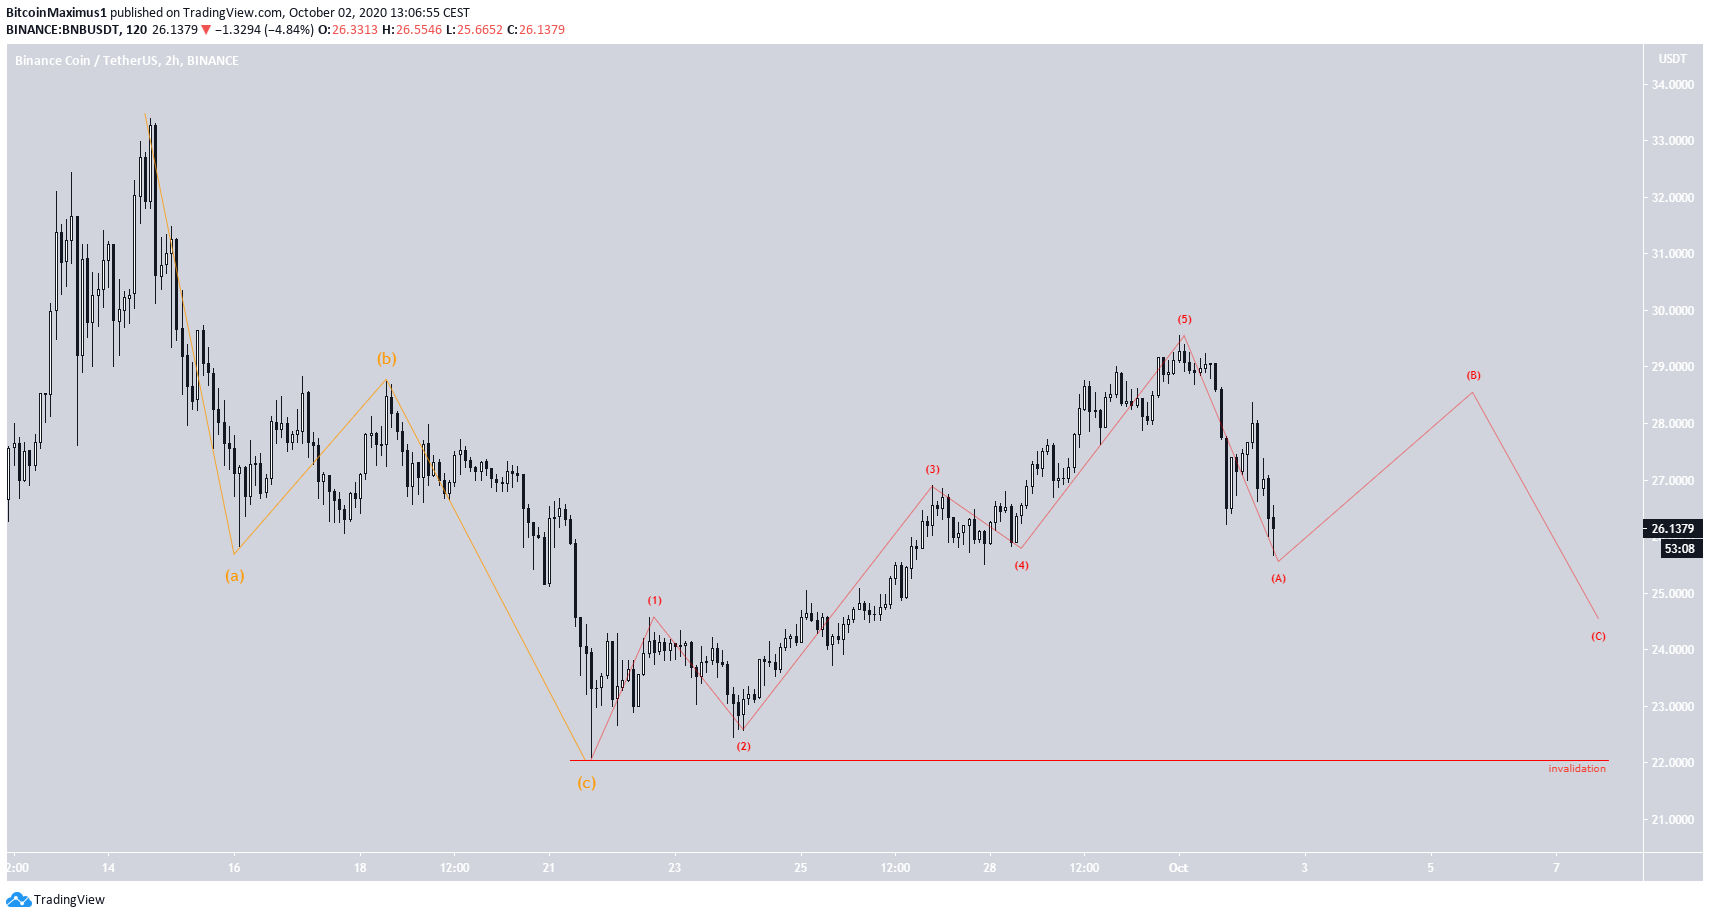
The wave count for BNB indicates that the price has completed an A-B-C correction (shown in orange below) with a low on Sept 21. The rally since then looks impulsive rather than corrective (red), and the price seems to have completed a bullish impulse, currently trading in another A-B-C correction.
Currently, it’s not yet certain whether the increase is a part of a larger wave A or a new bullish impulse.
However, the price should complete its correction near $24, and a decline below this area would reduce the chances of this being a bullish impulse. A decline below the $22.10 low would invalidate the possibility of this being the beginning of a new upward trend.
To conclude, the BNB price should find support near $24 and begin an upward move. The direction of the longer-term trend remains unclear.
For BeInCrypto’s Bitcoin analysis, click here!
Disclaimer: Cryptocurrency trading carries a high level of risk and may not be suitable for all investors. The views expressed in this article do not reflect those of BeInCrypto.
