


The Binance Coin (BNB) price has been increasing since Feb. 13. However, it’s likely that the upward movement is corrective.
PancakeSwap (CAKE) has bounced at the $8.60 support area. However, the bounce has been weak and CAKE is expected to break down.
Celsius (CEL) is trading inside a symmetrical triangle. The direction of the trend is not clear, but a breakout looks slightly more likely.
Binance Coin (BNB)
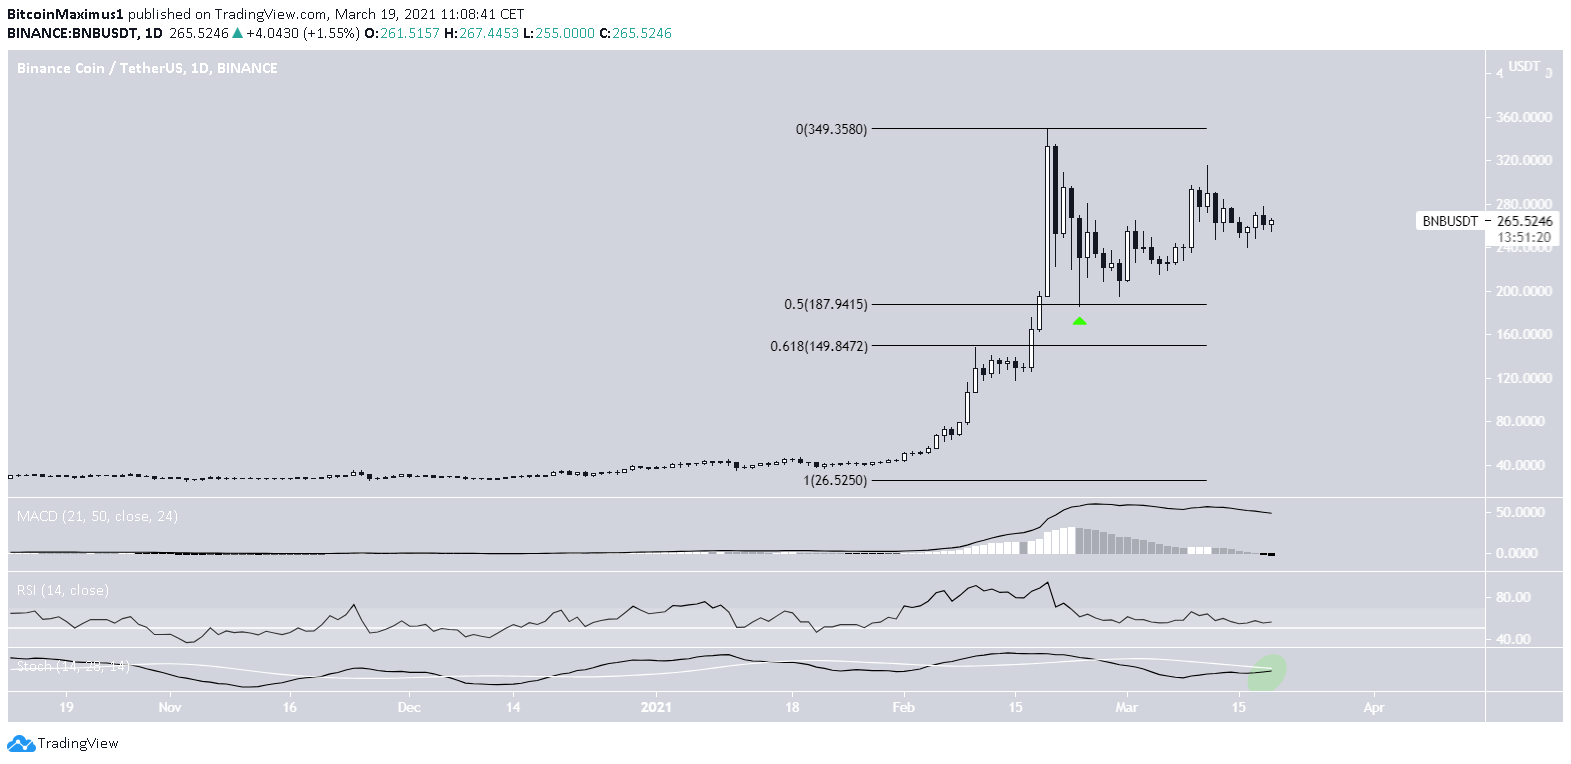
BNB has been increasing since Feb. 23 when it bounced at the 0.5 Fib retracement support.
Since then, it has increased considerably, It’s currently trading near $265.
However, technical indicators are undecided. The MACD is bearish but the RSI is still bullish and trending above 50.
The Stochastic oscillator is close to making a bullish cross. If that occurs, it would likely indicate that the trend is bullish.
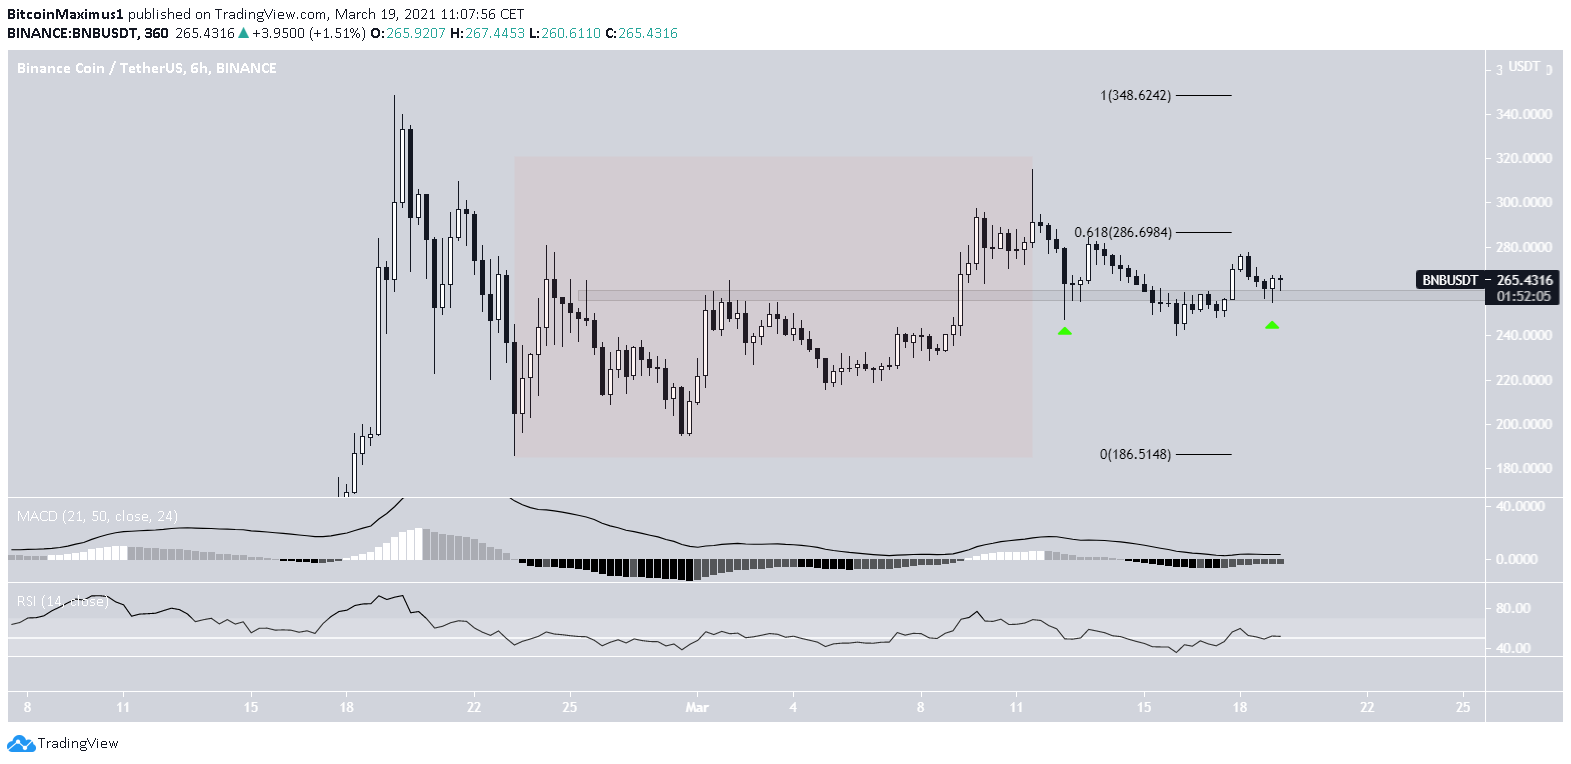
The six-hour chart provides a clearer picture.
BNB has reclaimed the $250 area and validated it as support after.
However, it is still trading below the 0.618 Fib retracement level and the preceding upward move looks corrective.
Therefore, the most likely scenario would have BNB increasing towards its all-time high due to the bullish short-term MACD. Afterward, another drop could take it towards the 0.618 Fib retracement from the previous chart.
Highlights
- There is long-term support at $188 and $150.
- Long-term indicators are undecided, short-term signals are bullish.
PancakeSwap (CAKE)
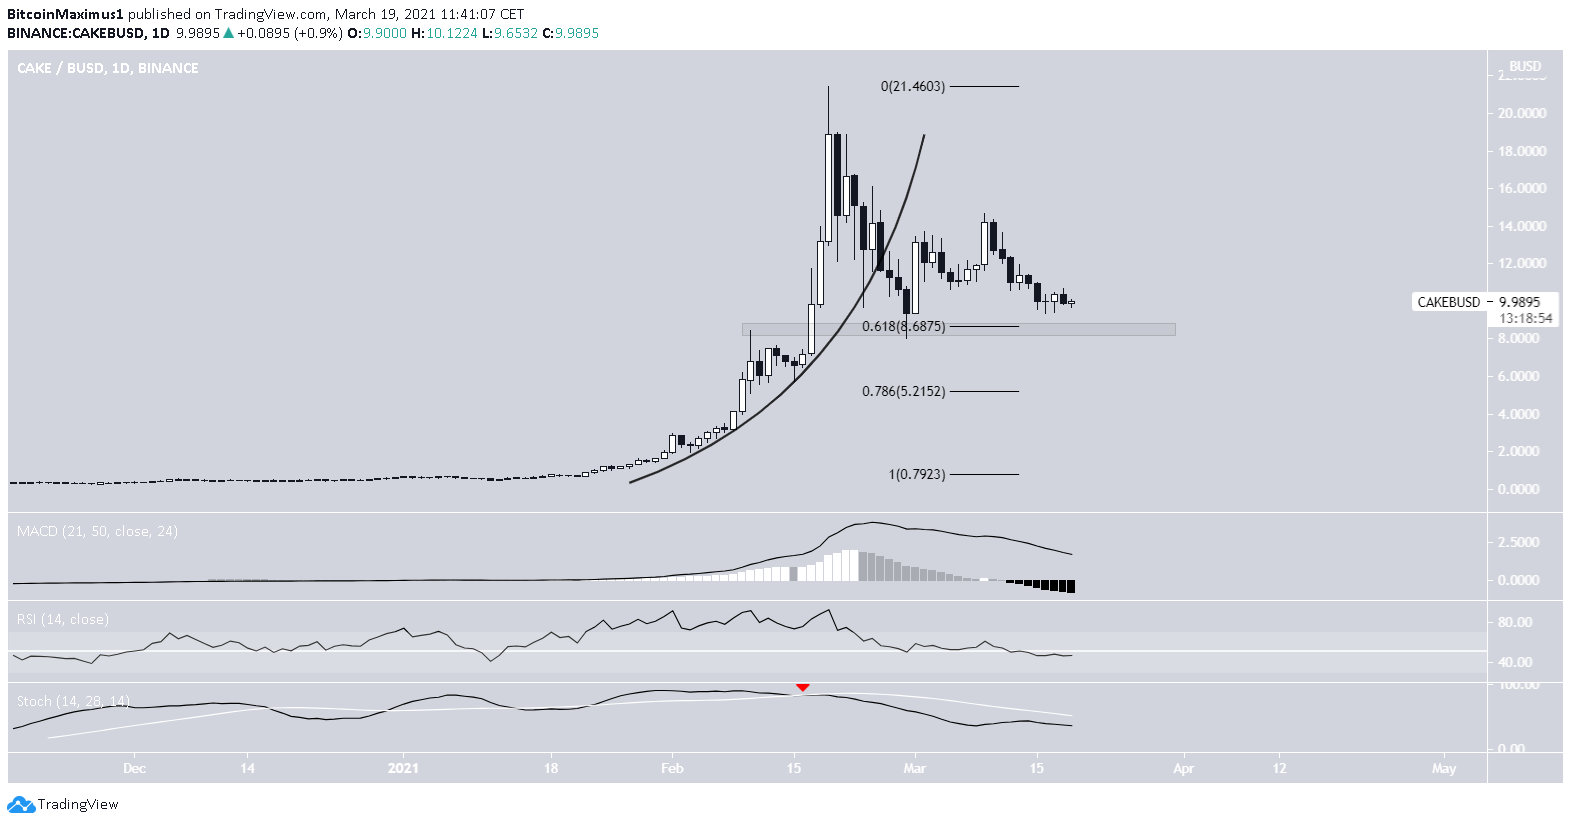
CAKE has been decreasing since reaching an all-time high of $21.45 on Feb. 19. Shortly after, it broke down from a parabolic ascending support line.
Currently, CAKE is trading just above the 0.618 Fib retracement support at $8.70. If CAKE breaks down, the next support area would be found at $5.20
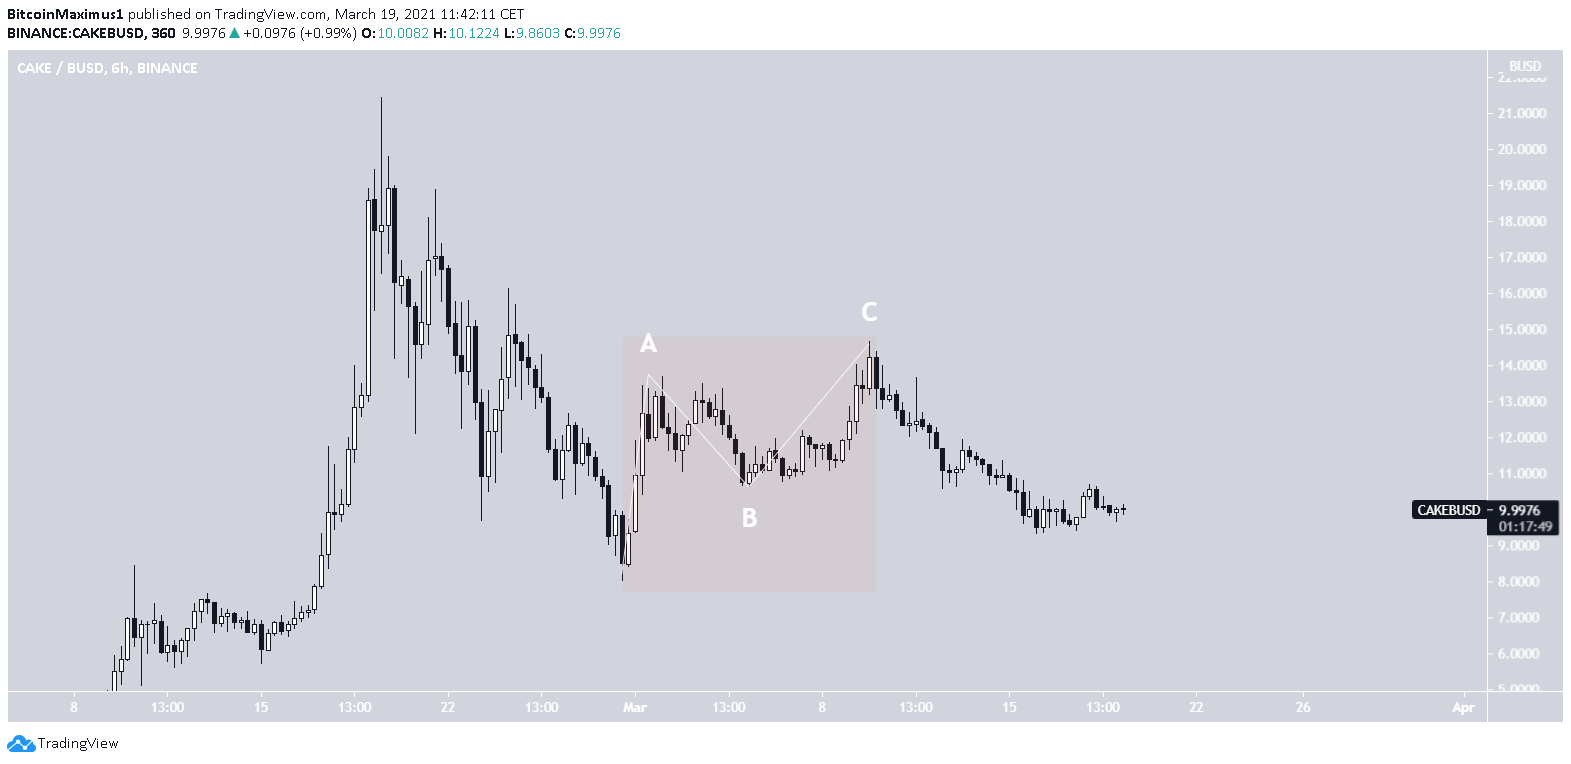
The upward movement looks like an A-B-C corrective structure. Therefore, it’s likely that CAKE breaks down and heads towards the next support area at $5.20.
Highlights
- CAKE has bounced at the $8.70 support area.
- Technical indicators are bearish.
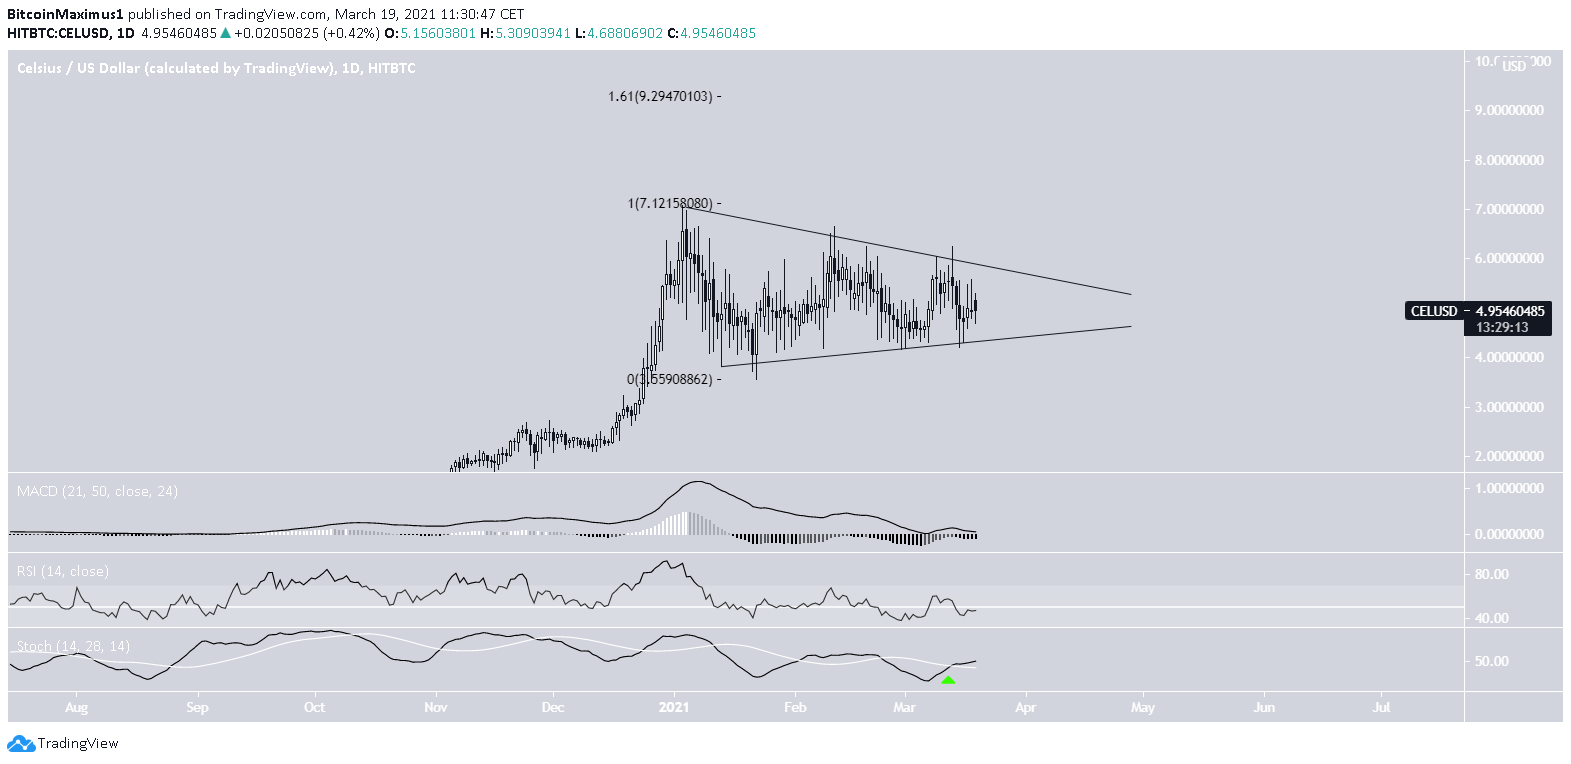
Celsius (CEL)
CEL has been decreasing since an all-time high price of $7.03 was reached on Jan. 3.
The decrease has taken the shape of a symmetrical triangle — normally considered a neutral pattern. Therefore, both a breakout and breakdown are possible.
Technical indicators also fail to confirm the direction of the trend since they are relatively neutral. The Stochastic oscillator is an exception as it has made a bullish cross.
Nevertheless, the triangle is transpiring after an upward movement, so a breakout is slightly more likely.
If one occurs, the next closest resistance would be found at $9.29.
Highlights
- CEL is trading inside a symmetrical triangle.
- The direction of the trend is unclear.
For BeInCrypto’s latest Bitcoin (BTC) analysis, click here.


