


At BeInCrypto, we publish regular price analyses and predictions for the most relevant and popular cryptocurrencies and digital assets. In our March 20 analysis for Binance Coin, we predicted price decreases. The next day, our prediction was validated when prices dropped to a low of nearly $14—a level not reached since Mar 10. After reaching this low, the price began rising. For the Mar 27 prediction of BNB, keep reading below, or if you’re interested in an exchange that does not lie about trading volume check out our Binance exchange review here.
On Mar 24, 2019, the price of Binance Coin reached a high of nearly $18. A gradual drop followed.
The price made a low of nearly $15 on Mar 26. It has been on an uptrend since but has not been able to reach levels experienced during the Mar 24 highs.
Will the price of Binance Coin keep going up or should we prepare for a reversal?
Based on today’s analysis, we believe that BNB is going to reach a top soon. Subsequently, price decreases are likely.
Binance Coin (BNB): Trends and Highlights for March 27, 2019
- The price of Binance Coin has been on a downtrend since Mar 24.
- BNB is trading inside a symmetrical triangle.
- There is significant long-term bearish divergence in the RSI and the MACD.
- There is resistance near $17.
- There are long-term support areas near $11.50 and $9.
- There are short-term support areas
Symmetrical Triangle
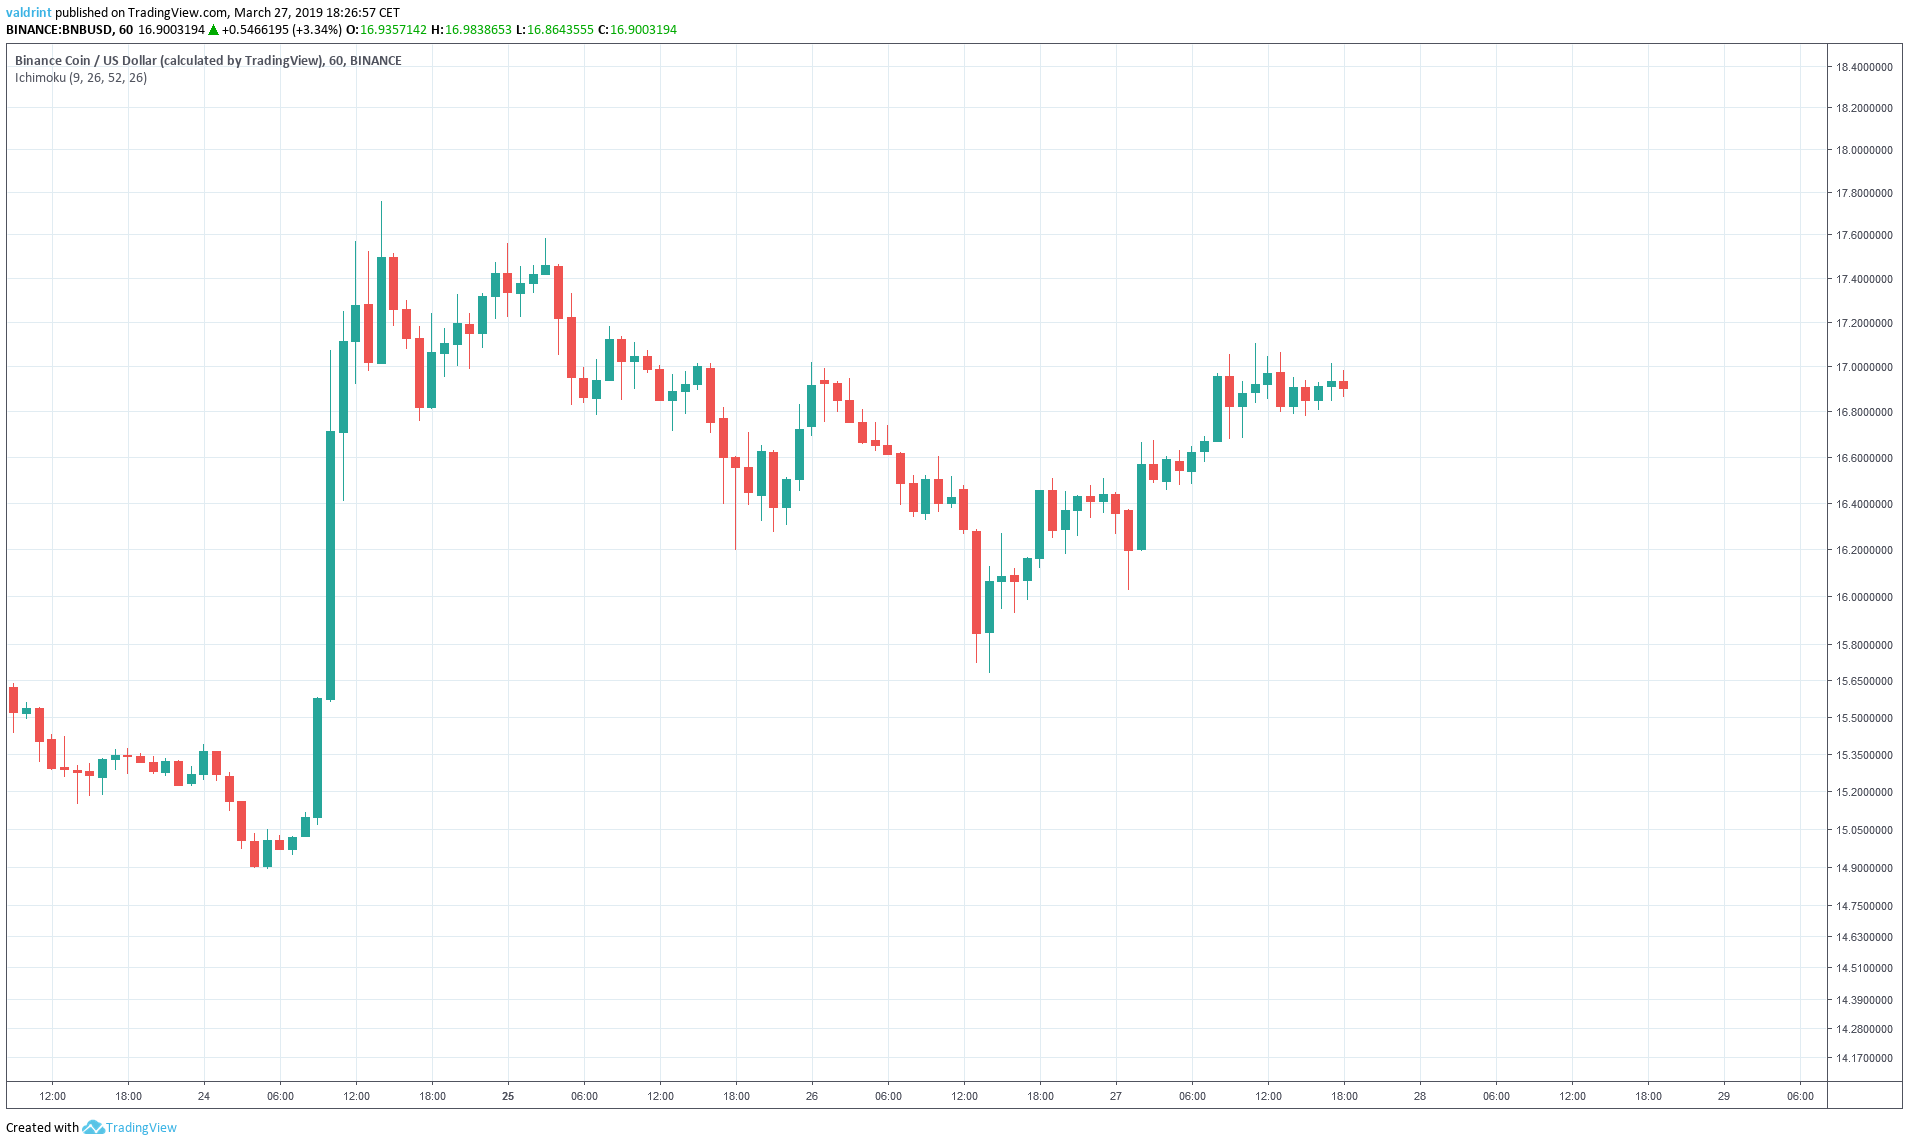
We begin our analysis by tracing the current trading pattern in which Binance Coin is trading. To do this, the price of BNB on Binance is analyzed at one-hour intervals from Mar 23 to Mar 27.
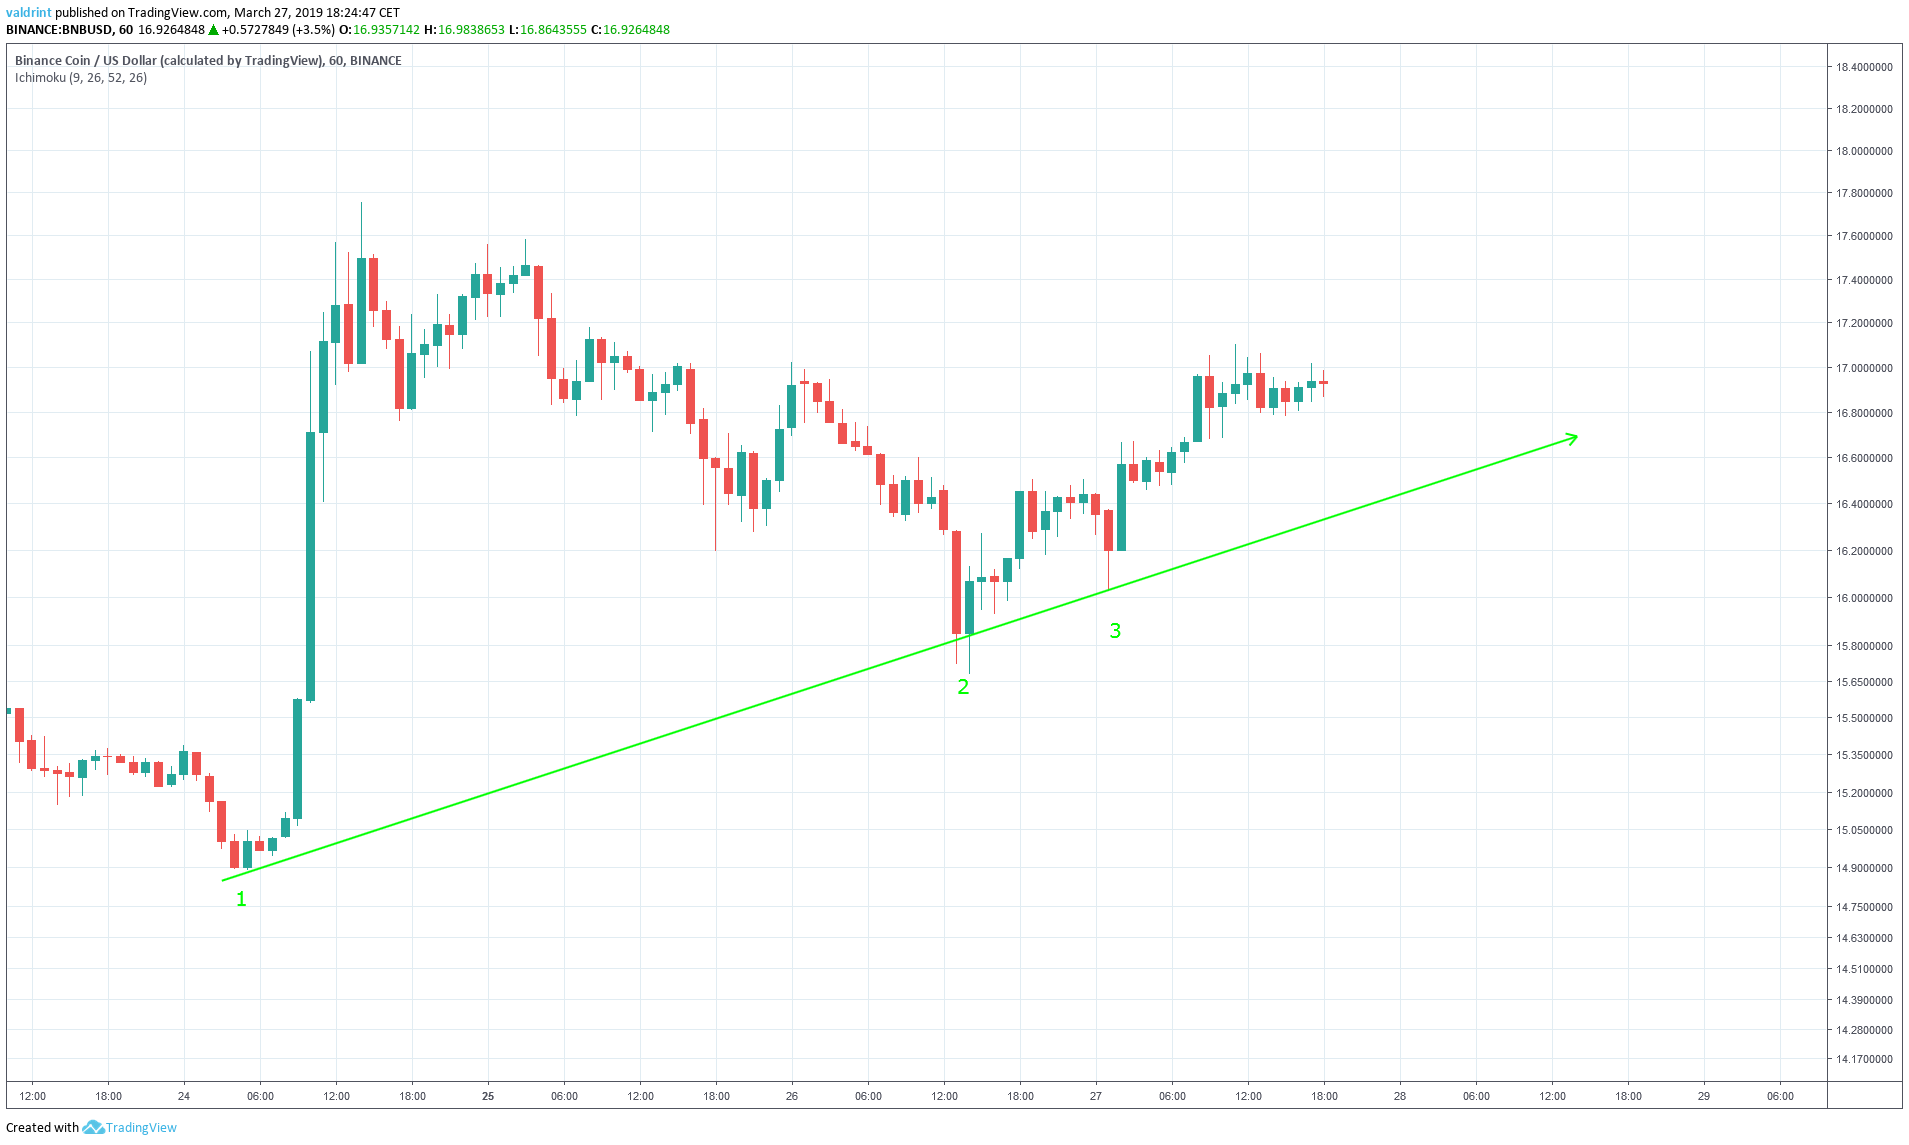
The price made a low of $15.04 on Mar 24 A sharp upward move ensued, followed by a gradual decrease.
Several market cycles have been completed. Each low has been higher than the previous one. Tracing these lows gives us an ascending support line:
The price of BNB made a high of $17.81 on Mar 24. It has been on a gradual downtrend since, making several lower highs. Tracing these highs gives us a descending resistance line.
Similar to the support line, the resistance line acts as a ceiling to price, preventing further upward movement.
The support and resistance lines combine to create a symmetrical triangle as seen below:
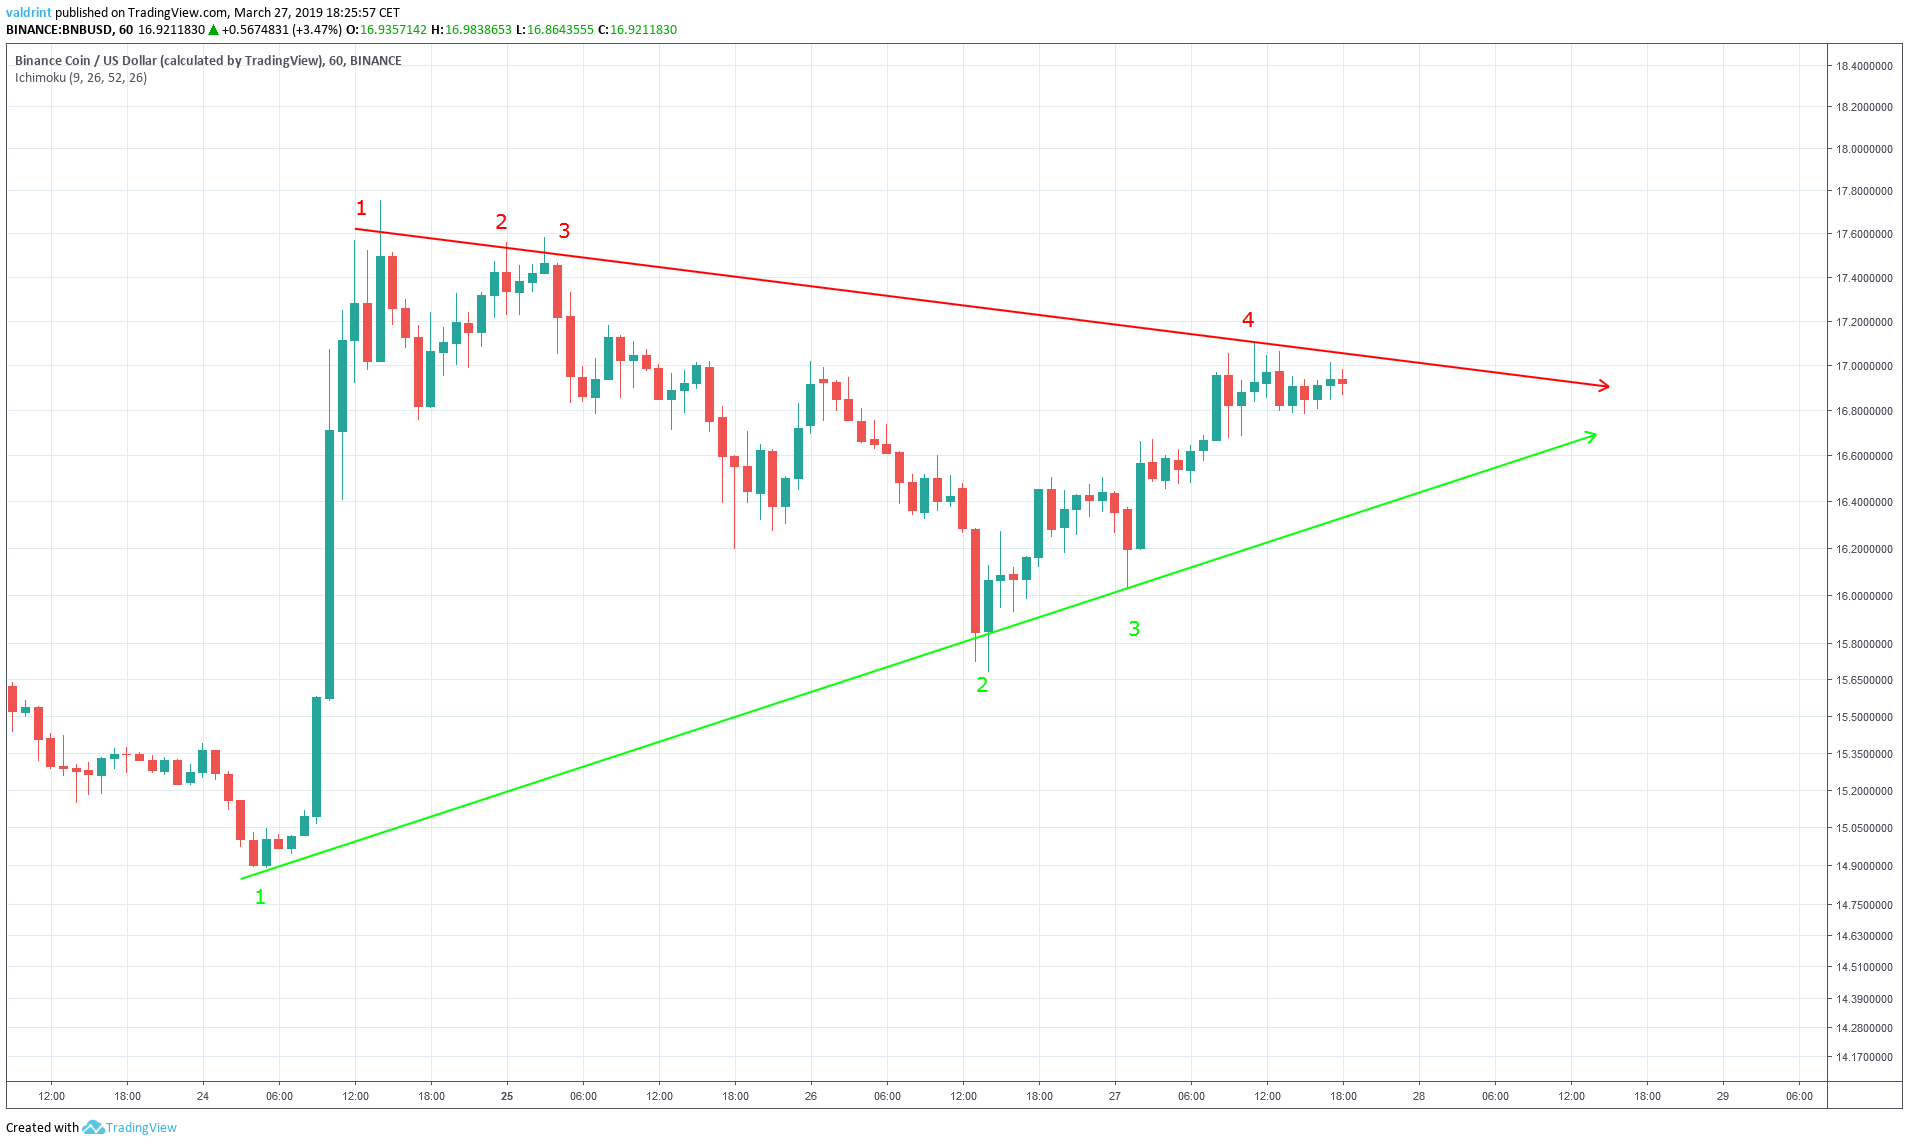
This is a generally neutral pattern. Taken alone, price increases and decreases within the pattern are both likely. Thus as price reaches the resistance line, we might expect a decline back toward support in the near future.
It is likely that the price trades within the confines of the channel until a point of convergence between support and resistance. At that point or sometime prior, a breakout above resistance or breakdown below support is inevitable. When this occurs, a new trading pattern will emerge.
Possible Reversal?
While the trading pattern is helpful, it cannot determine whether we should expect a breakout or breakdown. Price increases or decreases, however, can be better predicted by analyzing a longer time period with technical indicators.
We analyze the price of BNB on Binance on daily intervals from May 15, 2018 to Mar 27, 2019 along with MACD and RSI. Combining MACD and RSI bullish/bearish divergence with support/resistance essentially predicts price fluctuations.
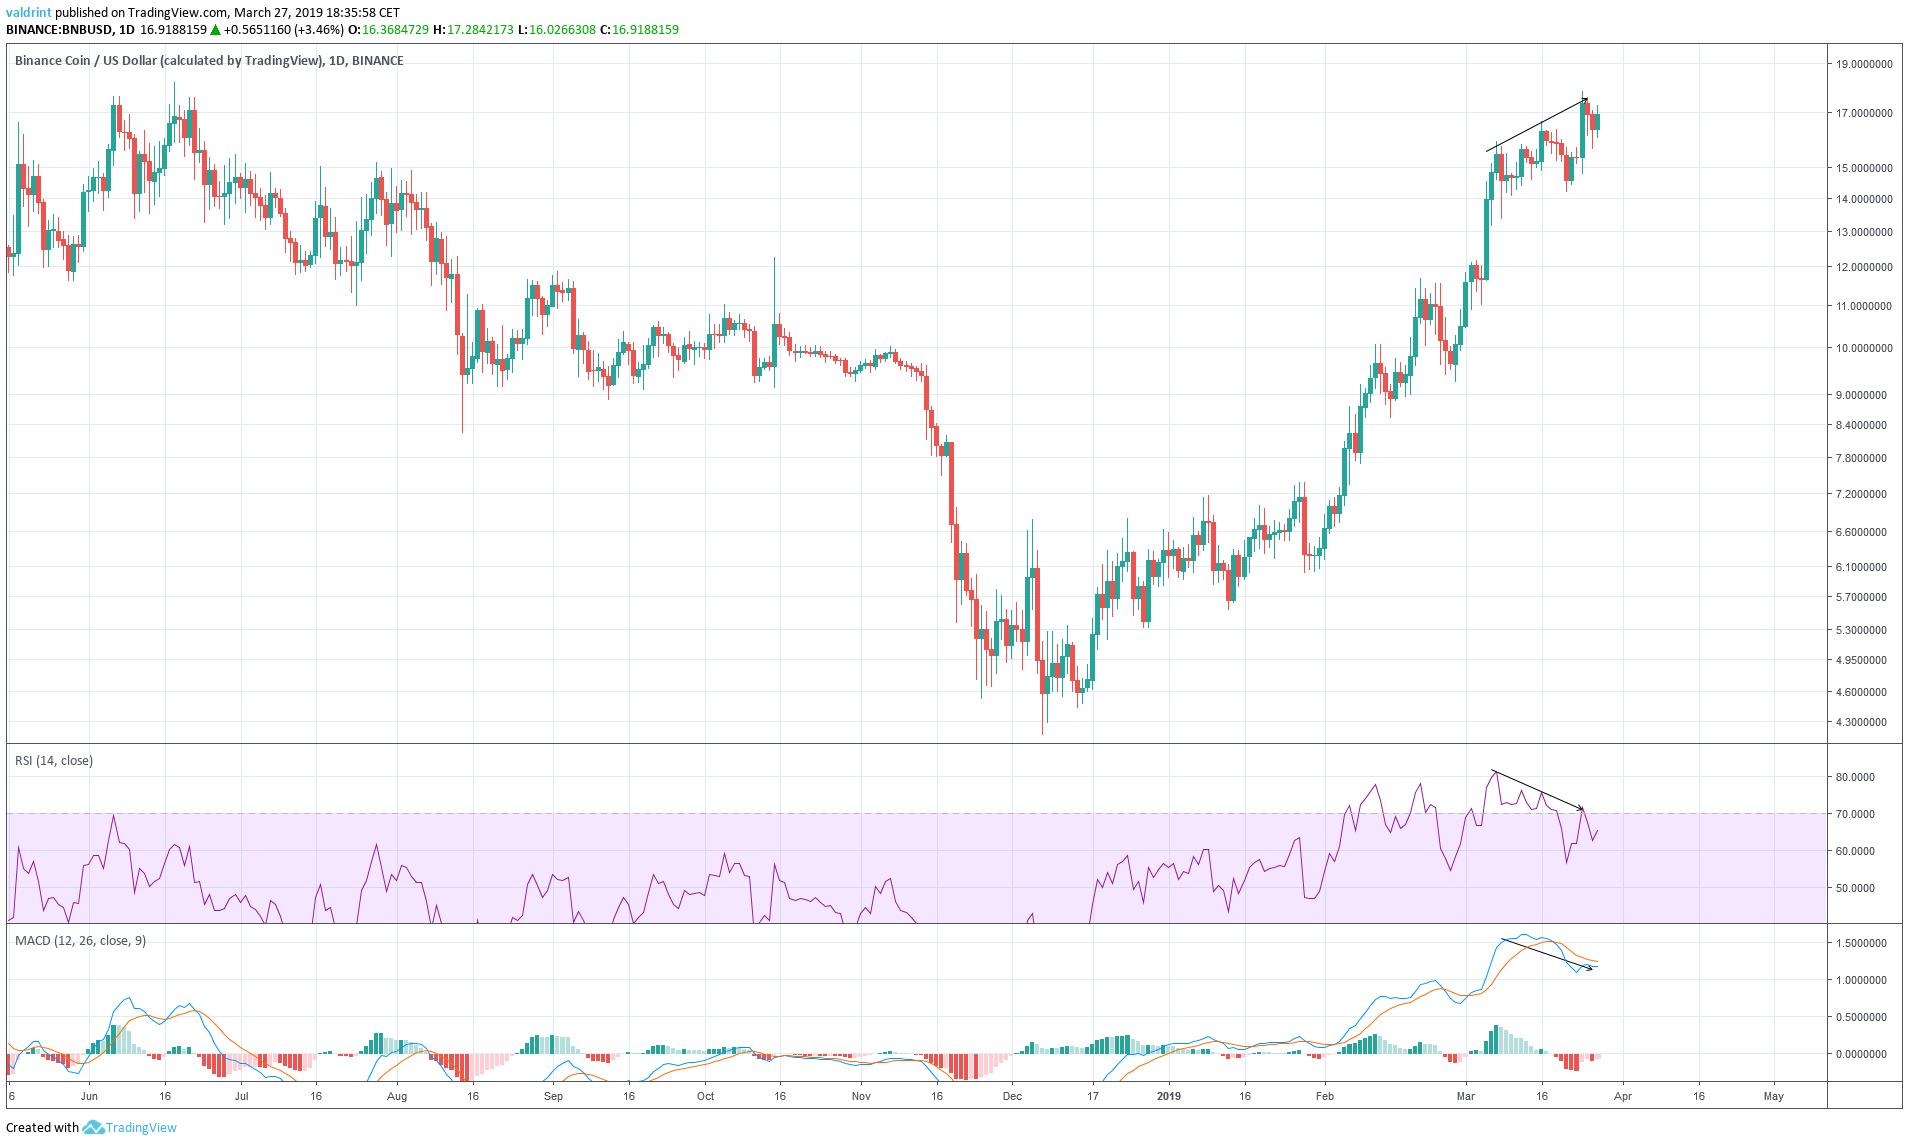
On Mar 7, the price reached a high of $15.71. It has proceeded to generate two higher values of $16.60 and $17.80 on Mar 16 and 24 respectively.
During the same interval, both the MACD and the RSI generated a high on Mar 7. However, they have proceeded to make lower values since.
This is known as bearish divergence and often precedes drops in price. In the case of BNB, it is very significant in value and is occurring in a long-term time-frame.
This is an especially effective predictor of future price decreases if bearish divergence occurs in a bearish timeframe. However, there is no visible long-term pattern. Therefore, we will use resistance areas.
Resistance and Support
Resistance and support lines are created when the price visits the same level several times and are helpful in locating potential reversal areas.
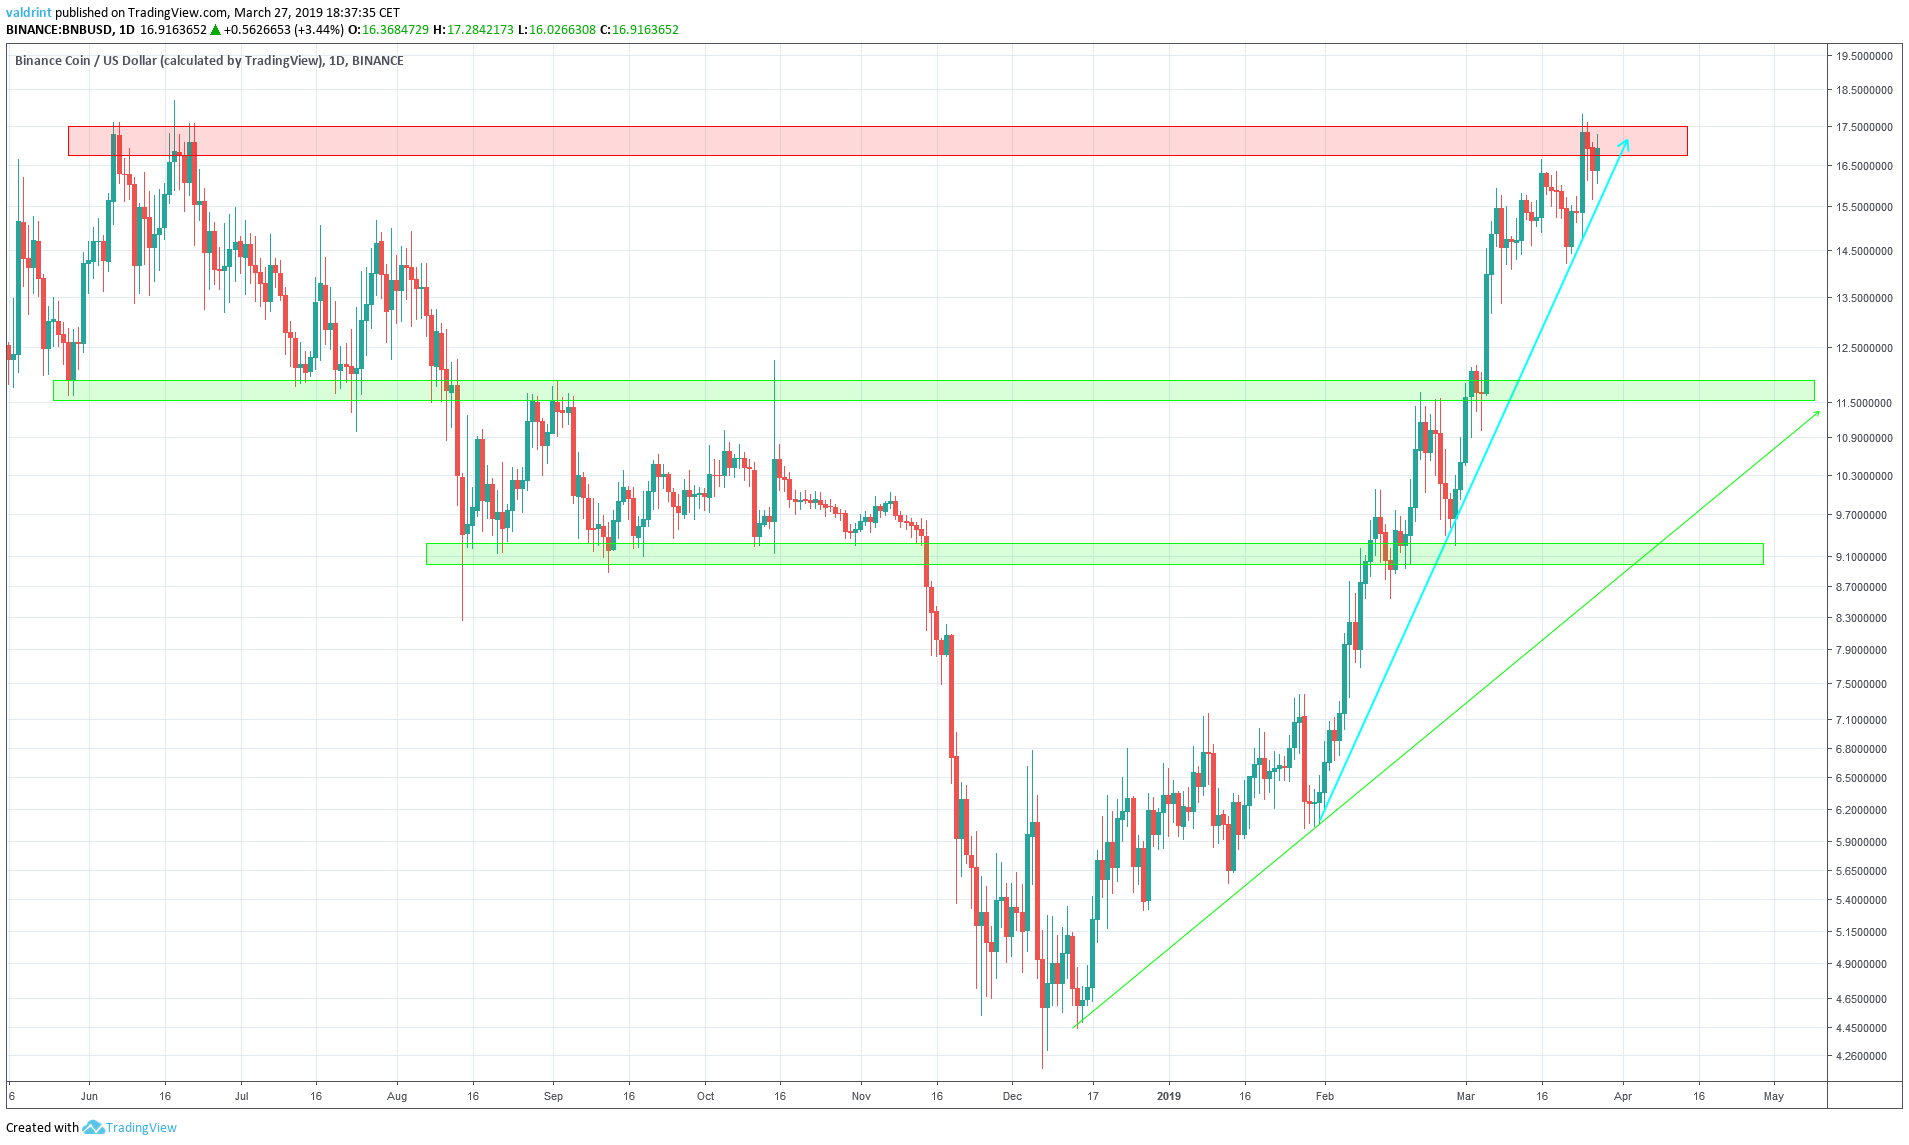
We can see that the price of BNB is currently inside the resistance area near $17. It is a very significant resistance level because it has not been broken in almost a year.
Therefore, the fact that bearish divergence is occurring at a significant resistance area gives further validity to the possibility of a reversal.
Furthermore, we can see that the price is following an extremely steep support line (blue). If the price were to break down from it, rapid decreases could ensue.
While there is a minor support area near $11.60, the first major support level is found near $9.
The use of these indicators shows that it is likely that the price of BNB is very close to reaching a top, but the top may have already been reached on Mar 24. While the possibility of further increases cannot be ruled out, we believe that even if they were to occur they would be short-lived. Price decreases are expected with a possible breakdown leading to rapid price drops toward the $11.60 support. It is unclear whether this support will be reached.
Short-Term Movement
The price of BNB on Binance is analyzed at one-hour intervals from Mar 14 to Mar 27 in order to better visualize possible reversal areas:
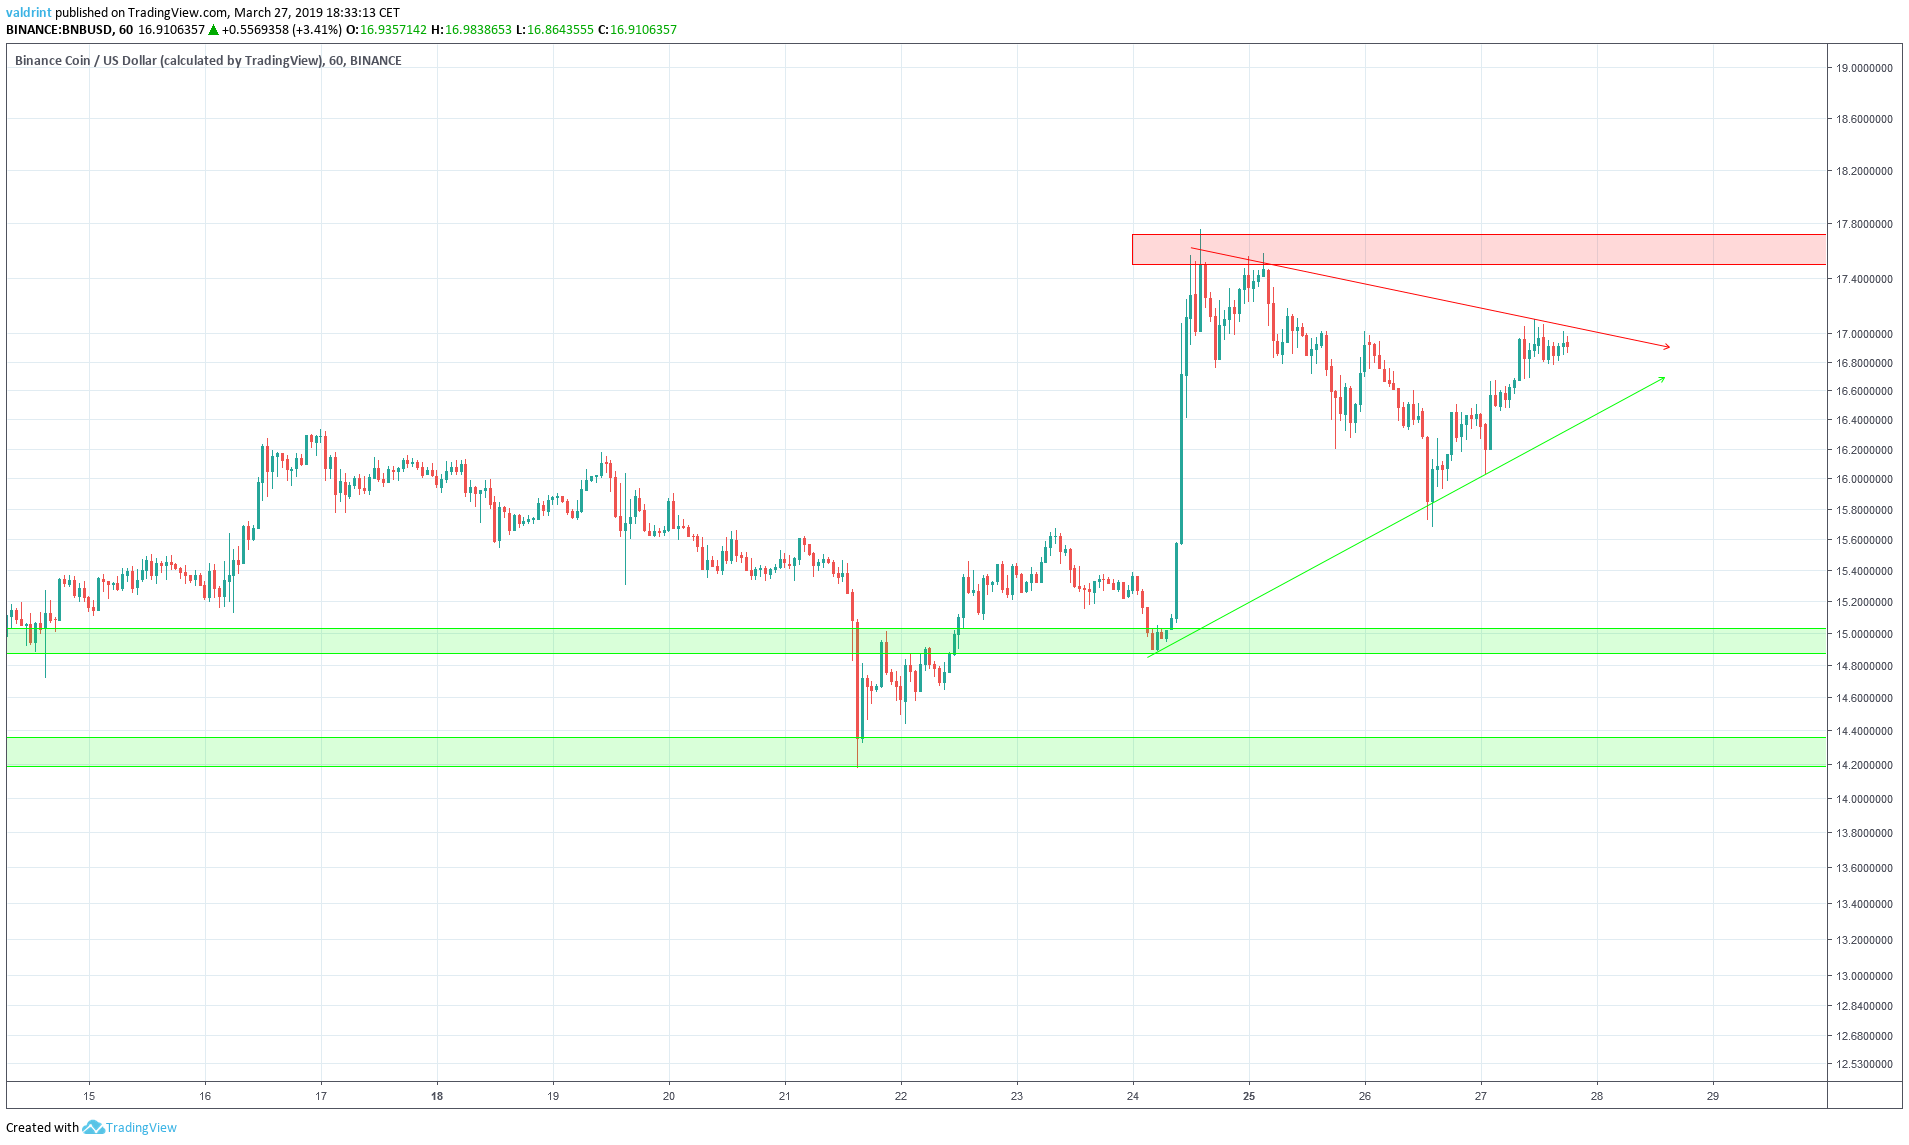
The first resistance area is found near $17. It was created by the recent Mar 24 high. Based on our analysis, it is unlikely that the prices will reach this area in the near future.
The first support area is found near $15, followed by the second one near $14.20. Based on our analysis, it is likely that the price will reach at least one of these areas. Both of these levels appear much more likely than the $11.60 or $9 support areas traced in the previous section. Thus, we believe the price will drop to or below $15 in the coming days.
Summary of Analysis
Based on this analysis, the price is likely to trade within the symmetrical triangle until a breakdown occurs. While it is possible that it will increase, we believe that any further increases be unlikely. If they do occur, they will likely not be very significant. Furthermore, they should be preceded almost immediately by price drops. We believe that the price will drop to or below $15.
OUr prediction will be partially validated if price decreases occur. If the price reaches or breaks $15, the prediction will be fully validated. A breakout above $18 would invalidate the prediction unless followed by immediate drops.
Where do you think Binance Coin will make a top? Let us know your thoughts in the comments below.
Disclaimer: This article is not trading advice and should not be construed as such. Always consult a trained financial professional before investing in cryptocurrencies, as the market is particularly volatile.


