On June 28, the Binance Coin (BNB) price completed a double bottom pattern and has been moving upwards since.
Double Bottom
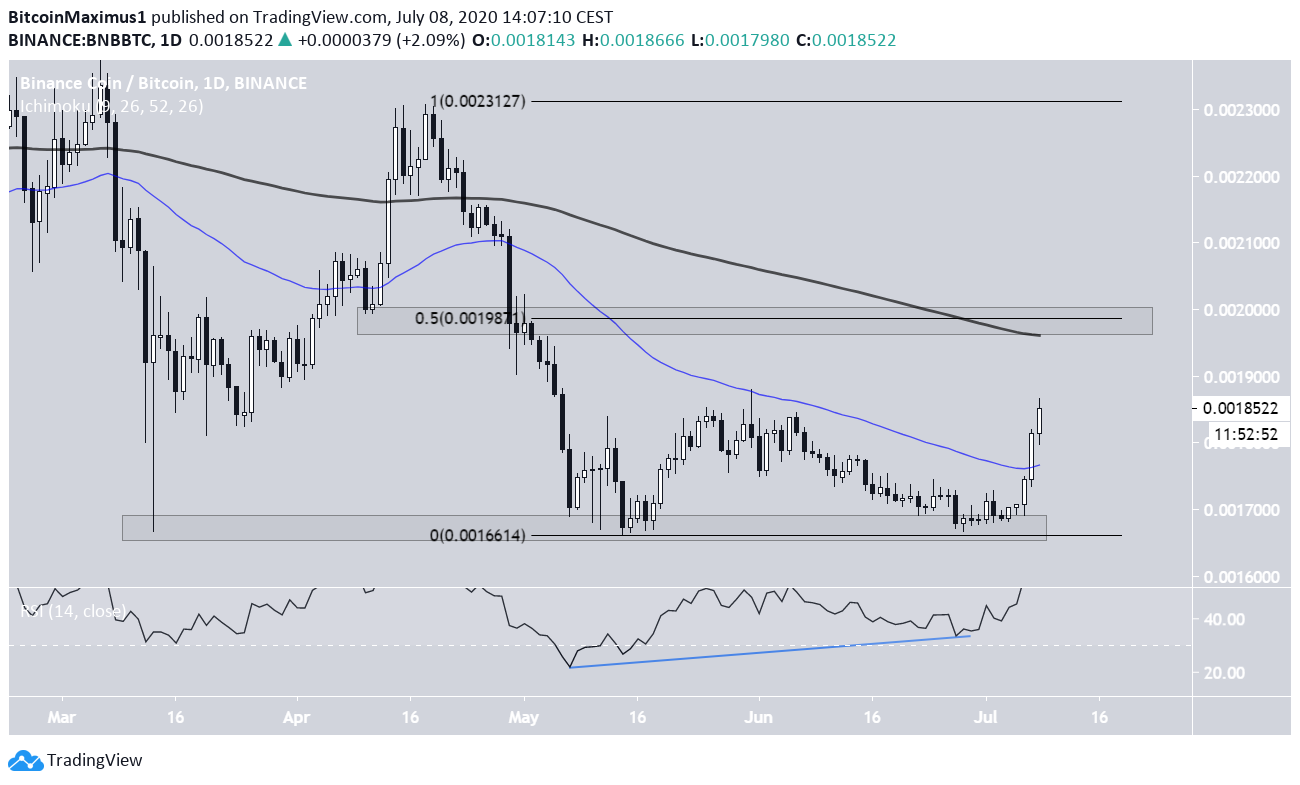
On May 15, the BNB price reached the support area at ฿0.00167. After a very gradual upward move, it returned to the same area on June 28. This effectively created a double bottom, which is a bearish reversal formation.
Furthermore, the RSI has also formed bullish divergence, a sign that the price is likely to move upwards. The rate of increase accelerated on July 6, and BNB has been moving upwards since. Today, it moved above the 50-day moving average (MA), which had previously provided resistance to the price.
The closest resistance area is found at ฿0.002, which is both the 0.5 Fib level of the previous upward move and the 200-day MA.
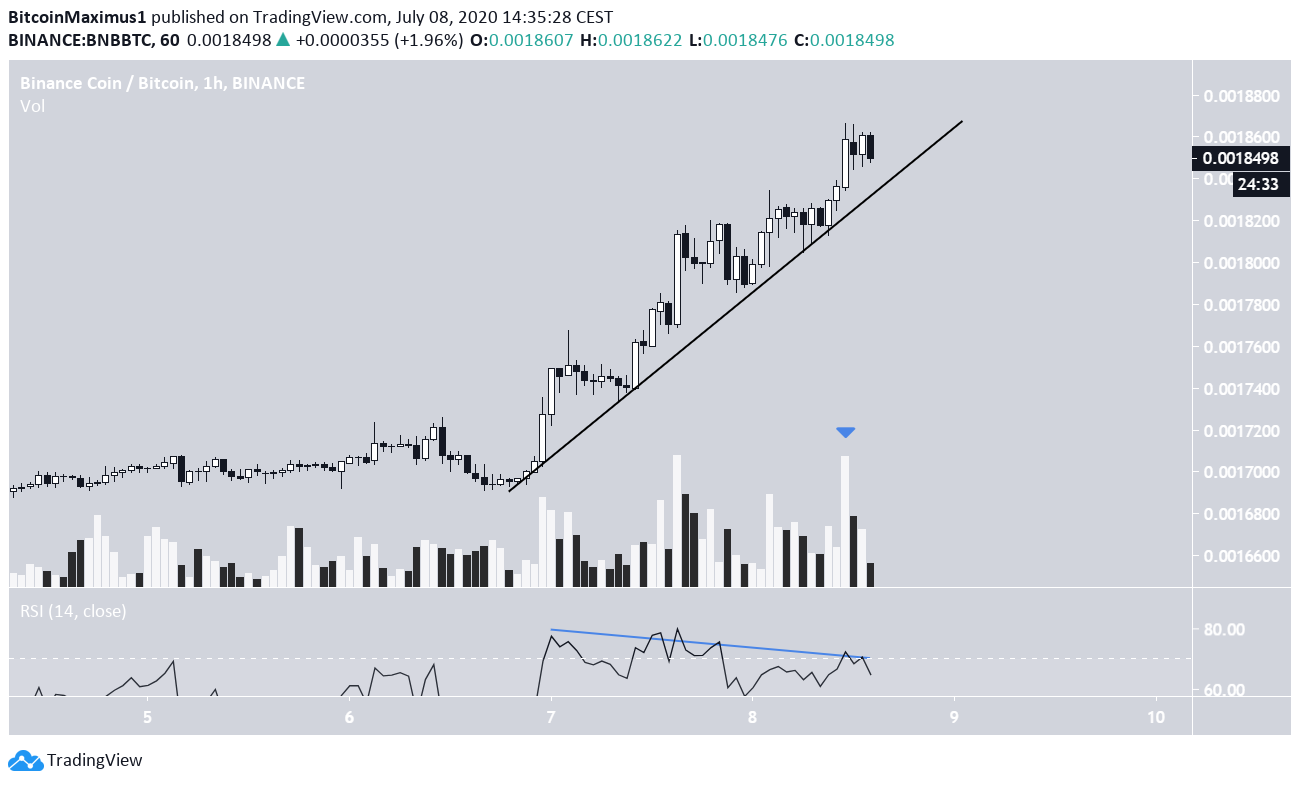
The hourly chart reveals a very steep rising support line, which has been in place since the upward move began. The slope of the line is likely unsustainable in the long-run.
While there is bearish divergence on the RSI, volume was highest during the most recent bullish candlestick, suggesting that the move still has strength.
Therefore, the price will likely continue rising alongside this line until it reaches the previously mentioned ฿0.002 resistance area, before eventually breaking down.
Long-Term Movement
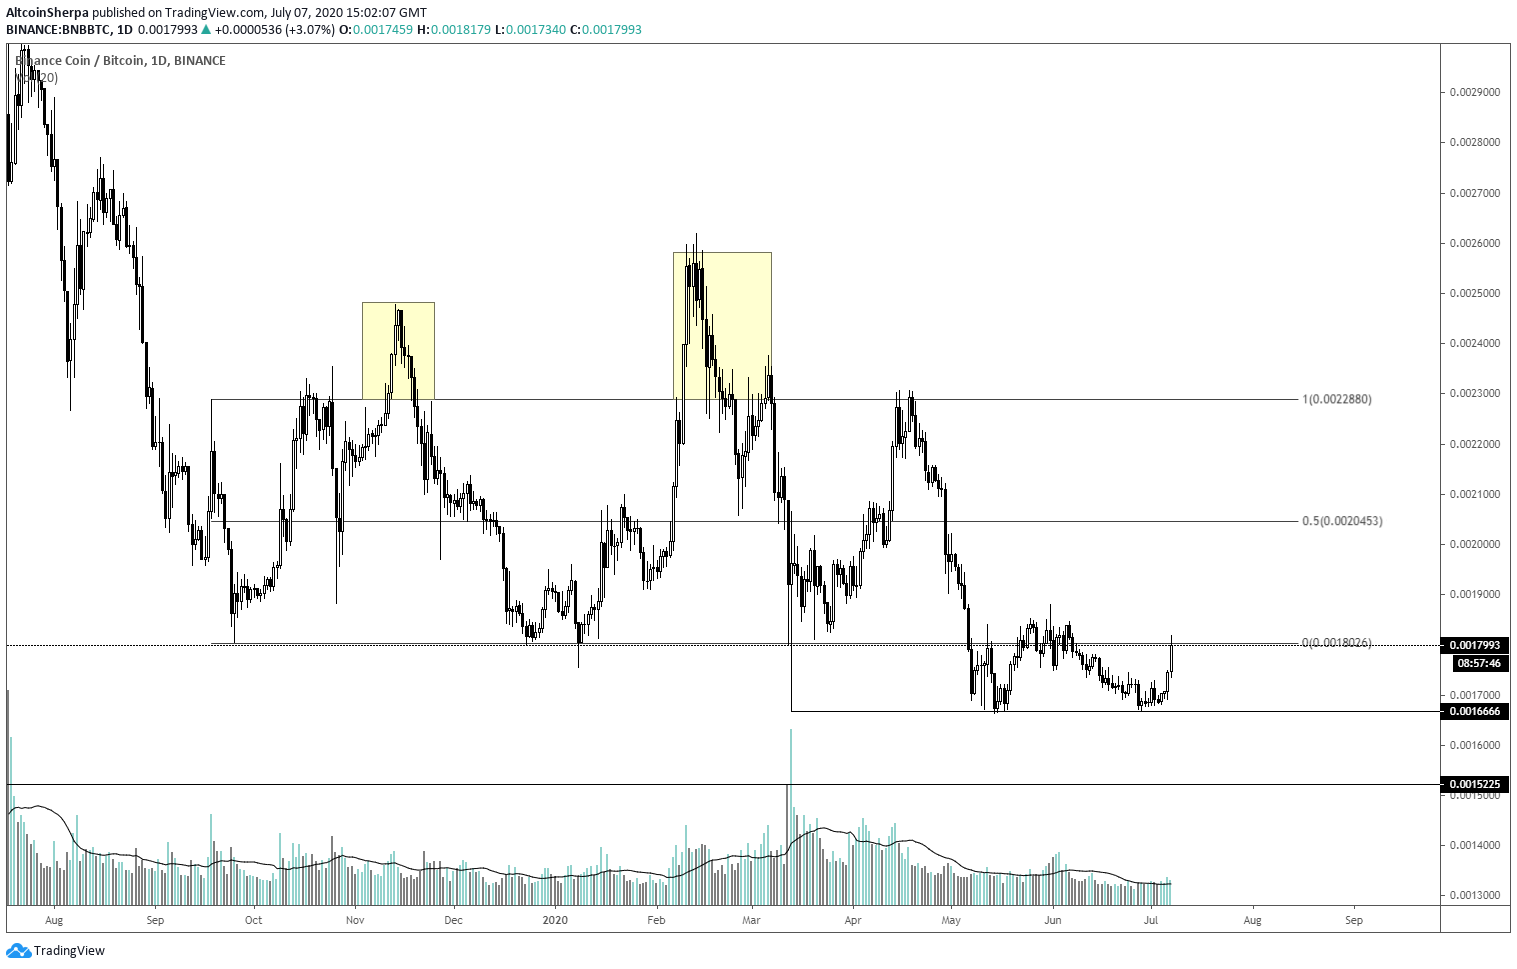
Well-known cryptocurrency trader @Altcoinsherpa tweeted a BNB chart, stating that the price is attempting to return to the range low. If it reclaims it, the move would be extremely bullish.
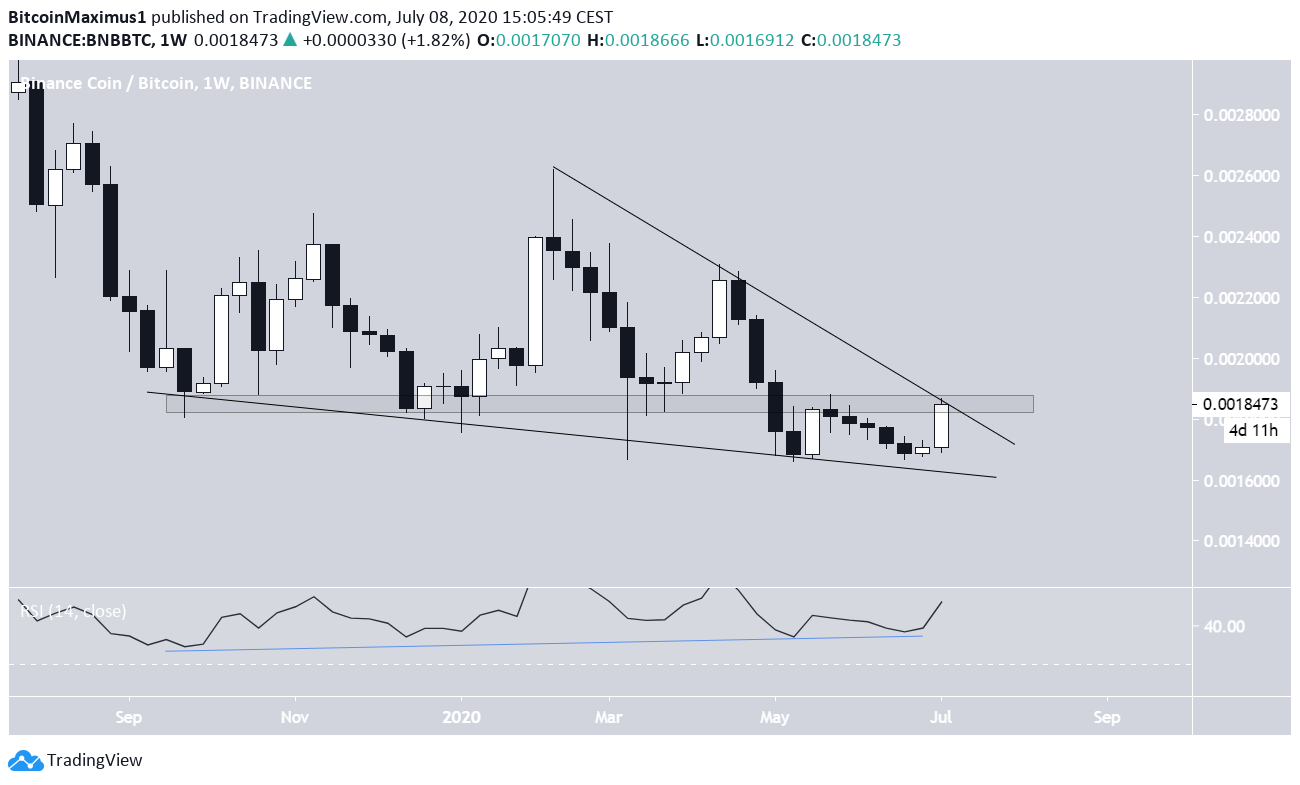
The weekly chart indicates that the price is likely to reclaim this range, found at ฿0.0019. BNB has been trading inside a descending wedge, which is a bullish reversal pattern, since September 2019. Throughout this period, the weekly RSI has been generating bullish divergence.
Once the price breaks out from the wedge, whose resistance line coincides with the range low, it is likely to continue its upward momentum at an accelerated rate.
However, due to the confluence of resistance levels (resistance line and area), it’s possible that BNB will initially be rejected before making another breakout attempt.