
Bittensor (TAO) has been a standout performer in 2024, surging 113.39% year-to-date, making it the top choice among artificial intelligence coins. This impressive run has sparked speculation about whether TAO could reach the $700 mark by the end of October.
However, recent movements in key indicators, such as the Chaikin Money Flow (CMF) and the Relative Strength Index (RSI), suggest a period of volatility ahead. The question remains: will bullish momentum continue, or will the recent cooling-off signal a potential pullback?
TAO Chaikin Money Flow Turned Negative
The TAO Chaikin Money Flow (CMF) is currently at -0.13, which typically signals that more capital is flowing out of the asset than coming in. This negative value can often point to a bearish sentiment, as it reflects that there might be increased selling pressure compared to buying pressure.
The CMF is a technical indicator that evaluates the flow of money by analyzing both price movement and trading volume over a set period. When the CMF is positive, it suggests accumulation or buying strength.
On the other hand, a negative CMF, like the current -0.13 for TAO, indicates distribution or selling strength. Despite this, a negative CMF doesn’t always mean that a price decline is imminent.
Read more: How To Invest in Artificial Intelligence (AI) Cryptocurrencies?
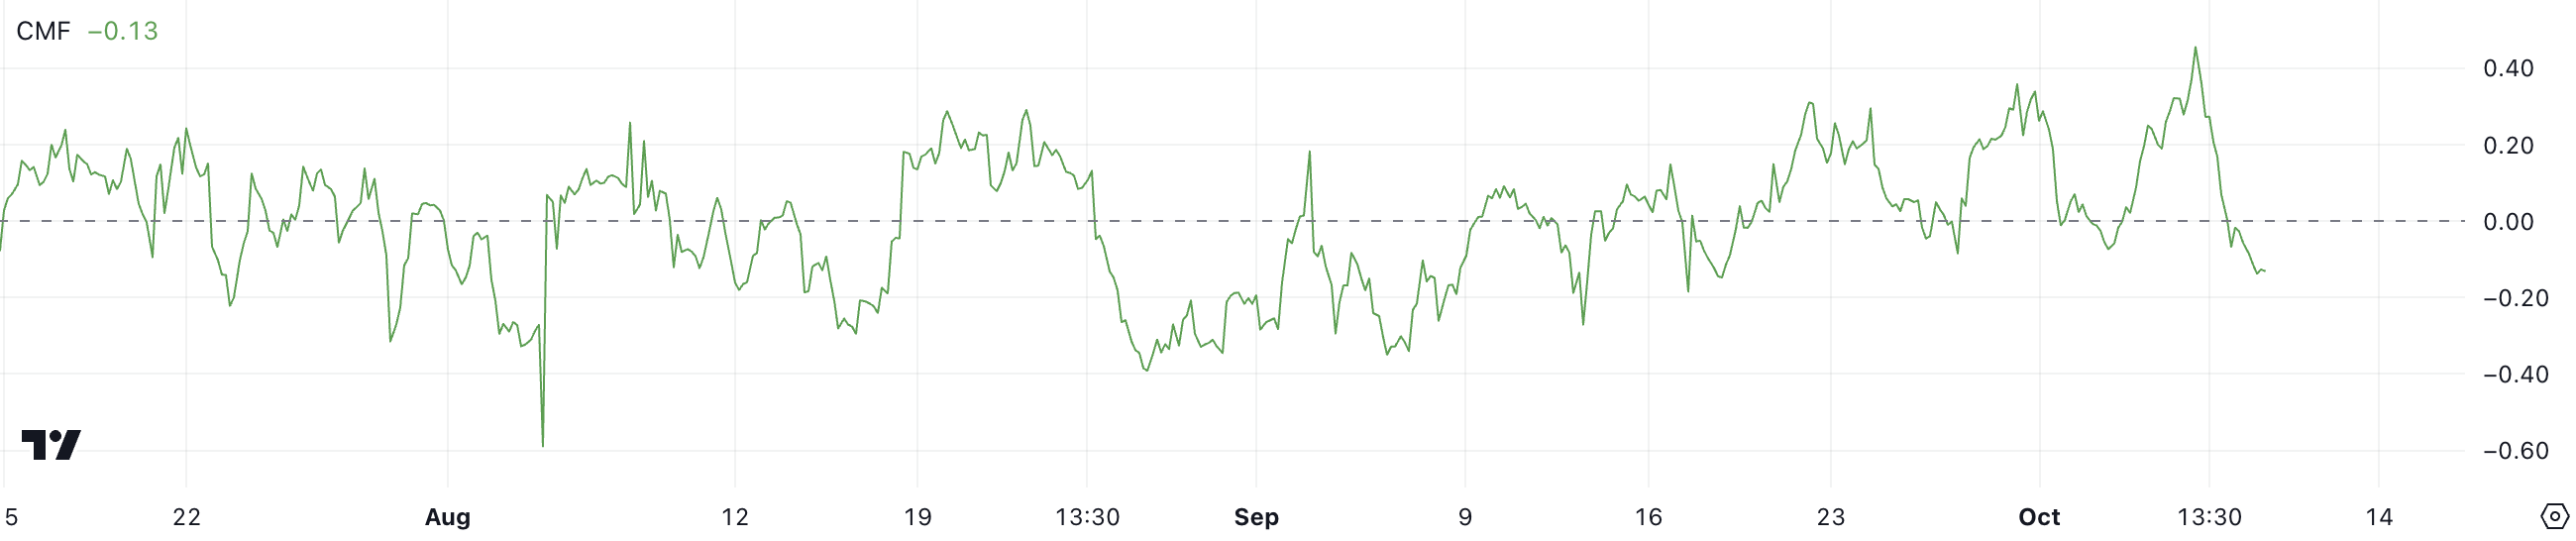
In TAO’s case, there have been times when the CMF dipped into negative territory but its price continued to rise. It’s possible that the current -0.13 is just a temporary fluctuation and not necessarily a sign of a sustained downtrend. However, it is still important to watch this metric closely.
If the CMF continues to fall further into negative territory, it could signal a growing imbalance between buyers and sellers, foreshadowing a larger move downward. In the past, deeper declines in the CMF have led to price corrections, so observing whether the CMF stabilizes or descends further will provide valuable insights into the future direction of TAO’s price action.
Bittensor RSI Shows A Neutral State
The Bittensor Relative Strength Index (RSI) is currently at 49.20, down sharply from 70.10 just two days ago. This drop indicates that the asset has recently moved out of the overbought territory, where it was showing stronger buying pressure, into a more neutral zone.
The RSI is a momentum indicator used to measure the speed and change of price movements. It ranges from 0 to 100, with readings above 70 generally indicating an overbought condition — where the asset may be due for a pullback — and readings below 30 signaling an oversold condition, which could mean the asset is undervalued.
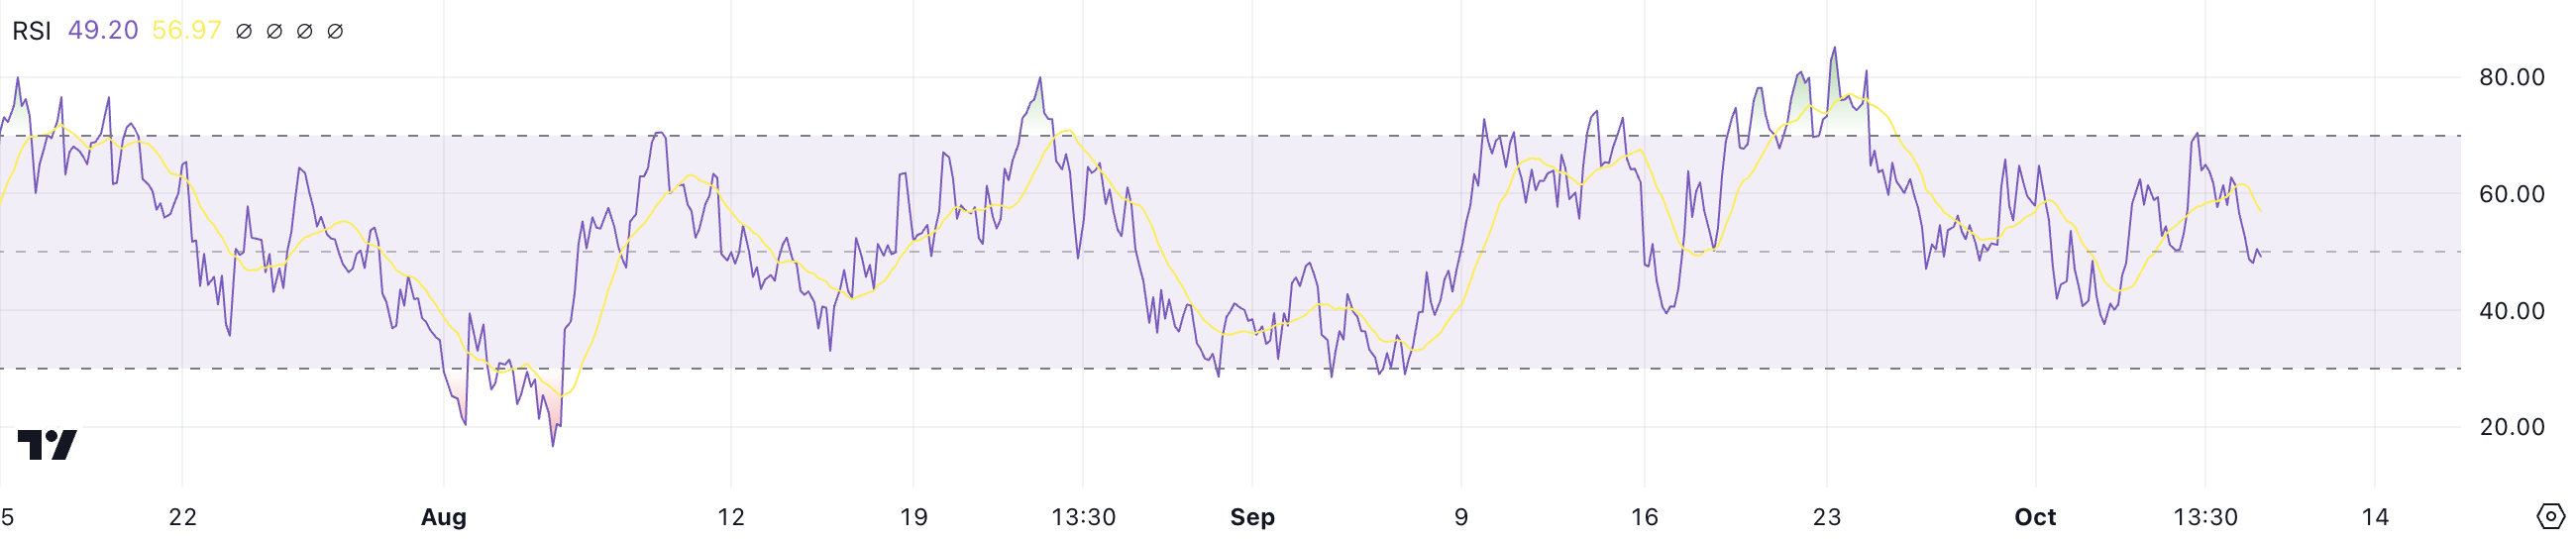
With TAO’s RSI now sitting at 49.20, it suggests neither strong buying nor selling pressure at the moment. Despite the recent dip, this level is often interpreted as neutral.
That means there could still be room for the RSI to climb again before it reaches the overbought threshold. Even though TAO’s price surged over 13% in the last seven days, the current RSI value shows that the asset isn’t yet overextended.
The RSI cooling down from overbought levels could be seen as an opportunity for further price growth. That happens because the market may have reset enough to support additional upward movement. The fact that it’s no longer close to overbought means TAO has the potential for more upside in the near term.
TAO Price Prediction: Is It Possible to Reach $700 During October?
The TAO EMA lines are currently bullish, with the short-term EMAs positioned above the long-term ones, signaling ongoing upward momentum. However, these short-term EMA lines are beginning to turn downward, which is a sign that the momentum may be slowing. If this downward movement continues, it could lead to the formation of a death cross.
Exponential Moving Averages (EMAs) are indicators that smooth out price data by giving more weight to recent prices. That makes them more responsive to changes in the market compared to simple moving averages.
Short-term EMAs help gauge immediate trends, while long-term EMAs provide a broader view of price movement. When the short-term EMAs cross above the long-term EMAs, it signals a bullish trend. When the opposite happens, a bearish trend may emerge.
Read more: Top 9 Artificial Intelligence (AI) Cryptocurrencies in 2024
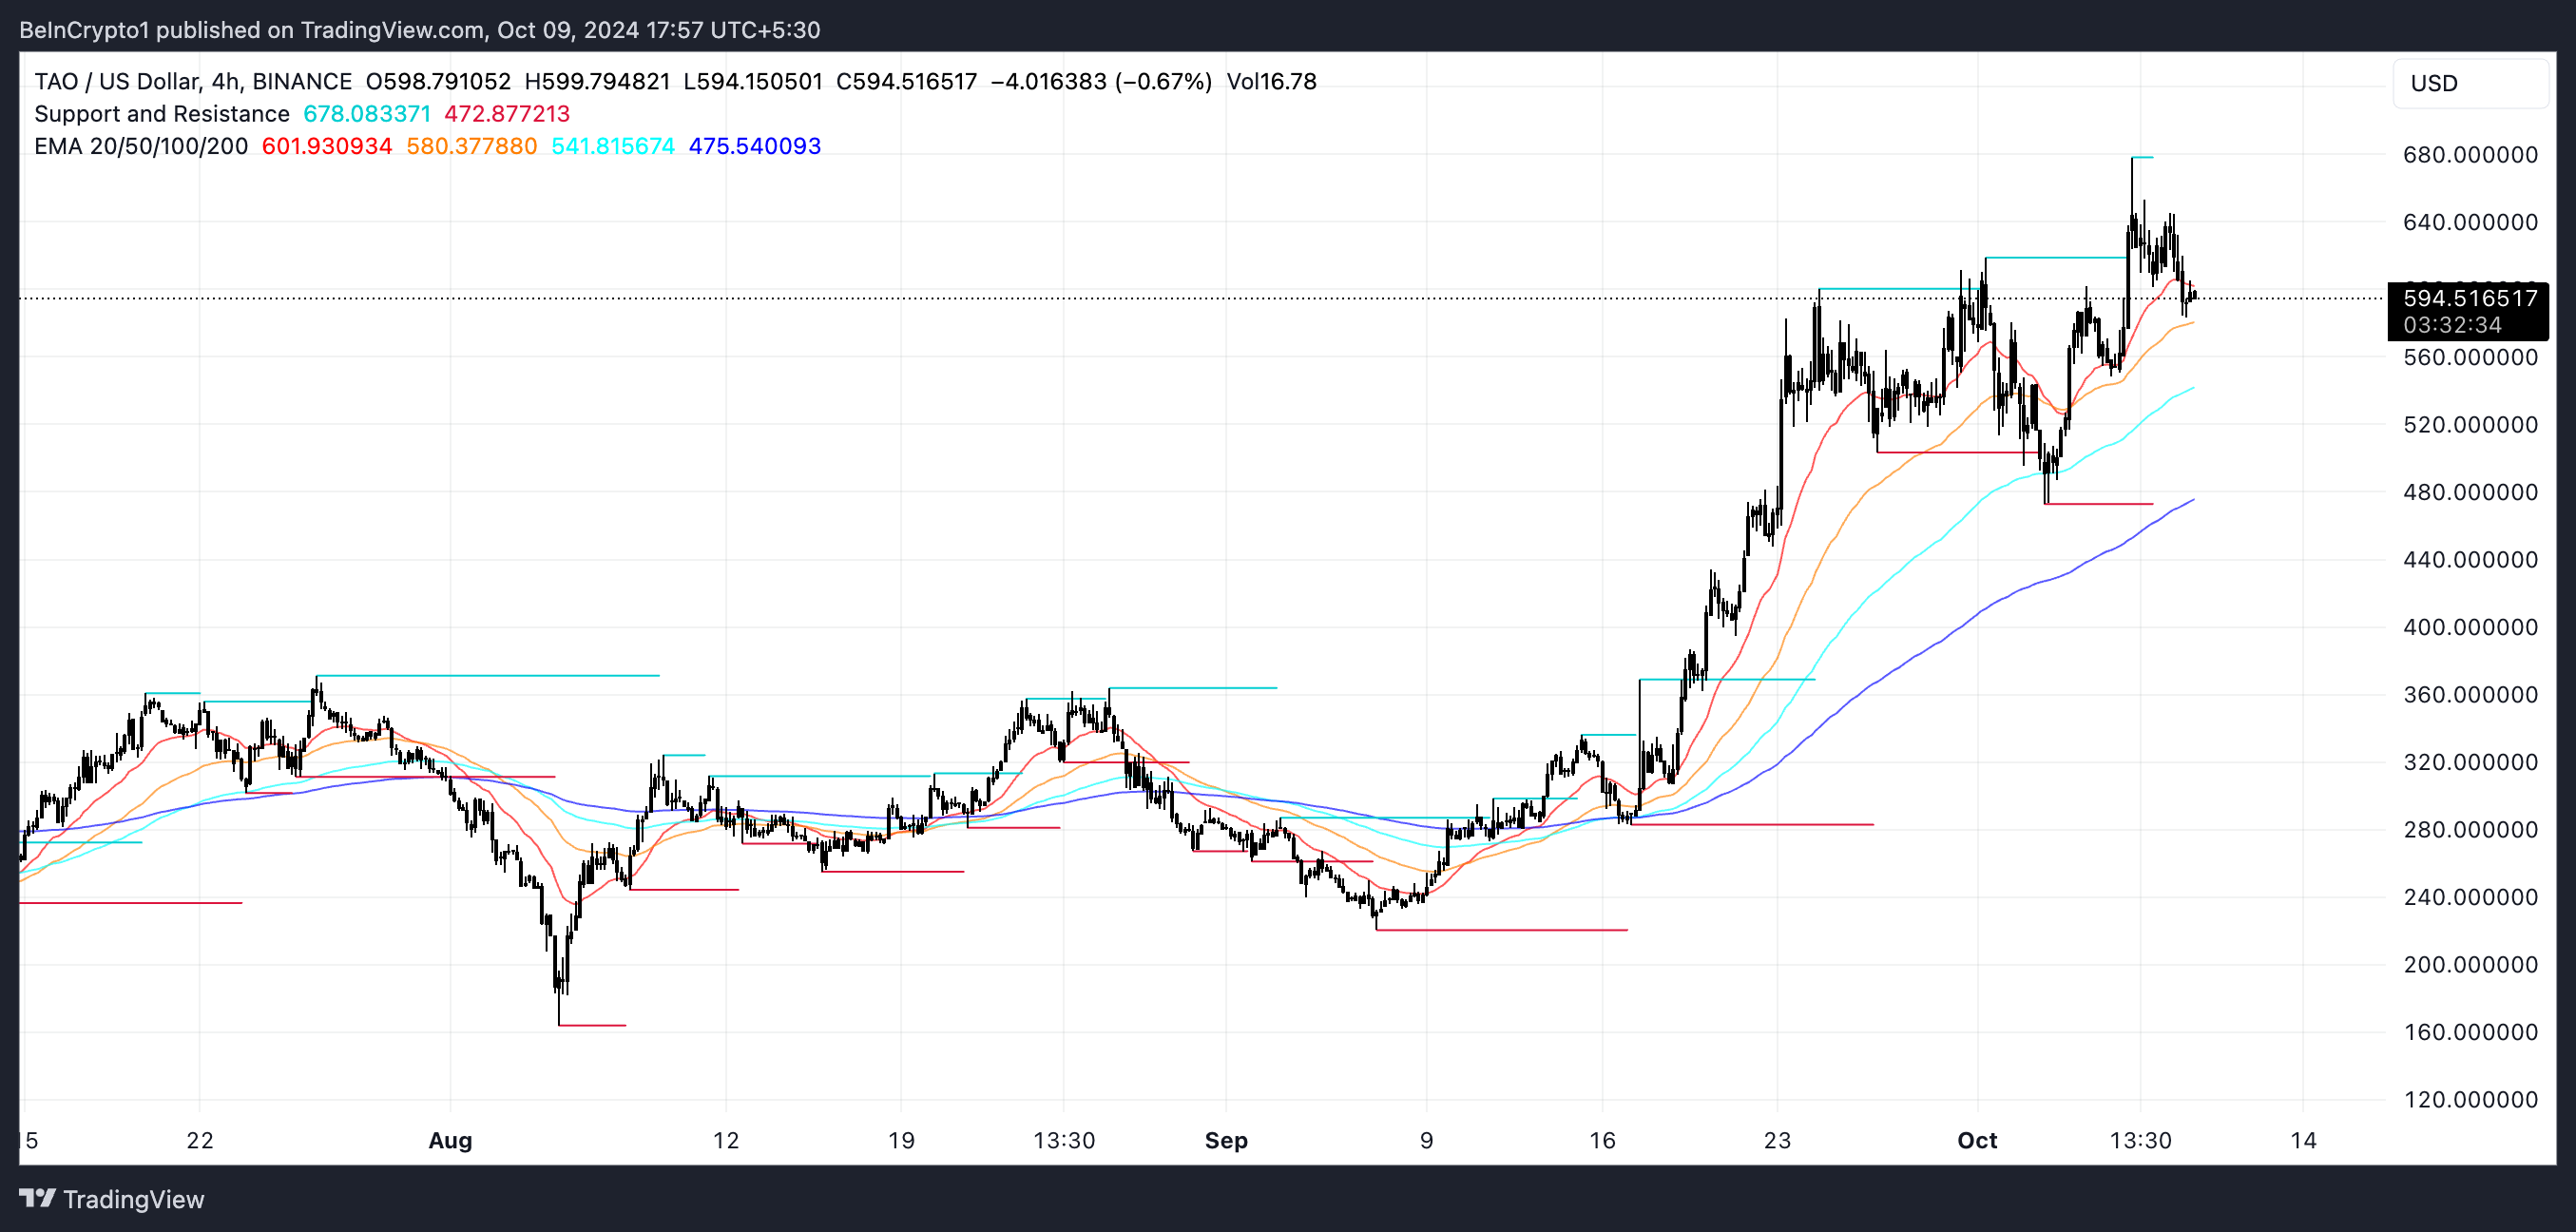
If TAO manages to recover from this potential reversal and the uptrend continues, it will likely test key resistance levels at $600 and $620. Should it break through those levels, TAO could potentially climb further to $678, representing a 15% price increase. A potential climb to $678 could renew interest in the coin, creating a new target of $700 that could be sought during October.
However, if the Chaikin Money Flow (CMF) continues its downward trend, TAO could face a significant price drop. In that scenario, it may test support zones at $503 and even as low as $472. That would lead to a potential 19% price decrease. Both outcomes are highly dependent on whether the current bullish momentum can hold or if selling pressure intensifies.
