


The Bitcoin price increased considerably during the week of March 30-April 6. The price began the week at $5,880 and increased all the way to $7,198 before reaching a close of $6,772.
The price created a bullish candlestick that closed well inside the resistance from the previous long upper-wicks.
Bitcoin’s Weekly Close
Despite the considerable increase that is clearly visible in high time-frames, the BTC price has yet to reach a close above the main resistance area found at $6,900. This level coincides with the 100-week moving average (MA). Until the price successfully moves above this level and flips it as support, we cannot consider the long-term trend bullish.
In addition, the RSI has yet to reach the 50-line and move above it, which would also be a bullish sign.

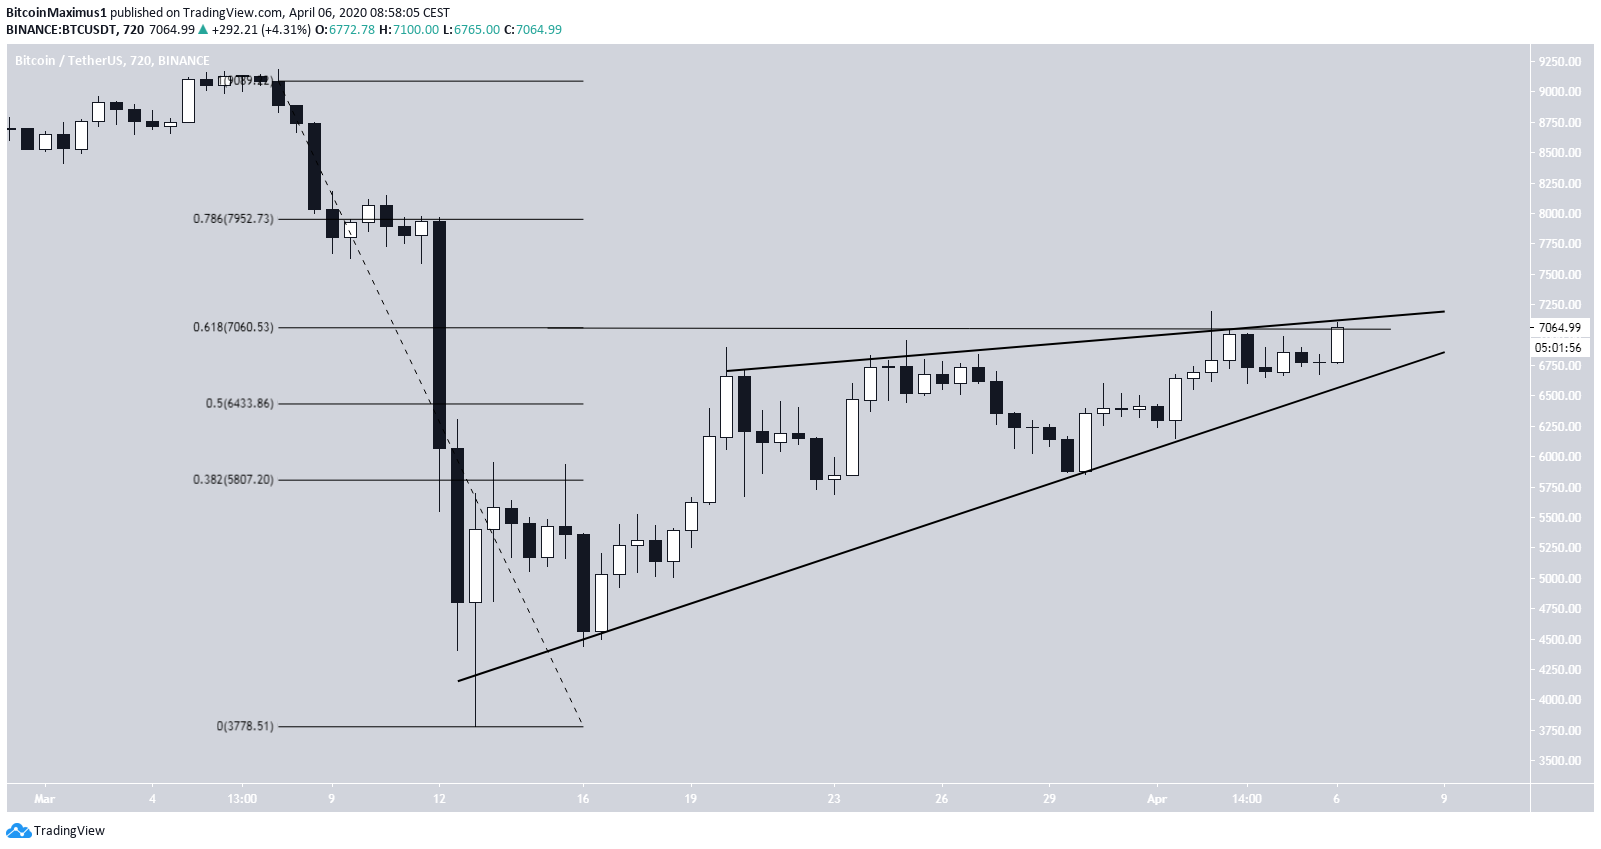
Ascending Wedge
In the medium-term, it definitely seems as if the price is trading inside an ascending wedge. The price has been unable to sustain a breakout once moving above $6,900. This is indicative that the resistance line is ascending and invalidates the previous possibility that the price was trading inside an ascending triangle, which is a bullish pattern.
The retracement has reached the 0.618 Fibonacci level, which is a level that could initiate a reversal, especially considering that the price has created a bearish pattern. However, there is no bearish divergence yet to confirm that a breakdown will occur.
Due to the lack of overhead resistance, a breakout above this level could trigger a rapid price increase towards $8,000. In the current climate, however, that seems unlikely.
Short-Term View
In the short-term, the price has broken out from a symmetrical triangle and is in the process of creating a double-top near $7,200. Furthermore, low time-frames have begun to show bearish divergence in the RSI, a sign that the price wants to move downwards.
Therefore, considering that the price is trading at important resistance levels in high time-frames and has begun to show weakness in short-term, a price decrease is expected.

To conclude, the BTC price has reached an important resistance level in high time-frames but has failed to close above it. It has created bearish reversal patterns in both the medium and the short-term, a sign that the price wants to move downwards. A breakdown from the ascending support line could cause a rapid price decrease towards $6,000.
For those interested in BeInCrypto’s previous Bitcoin analysis, click here.


