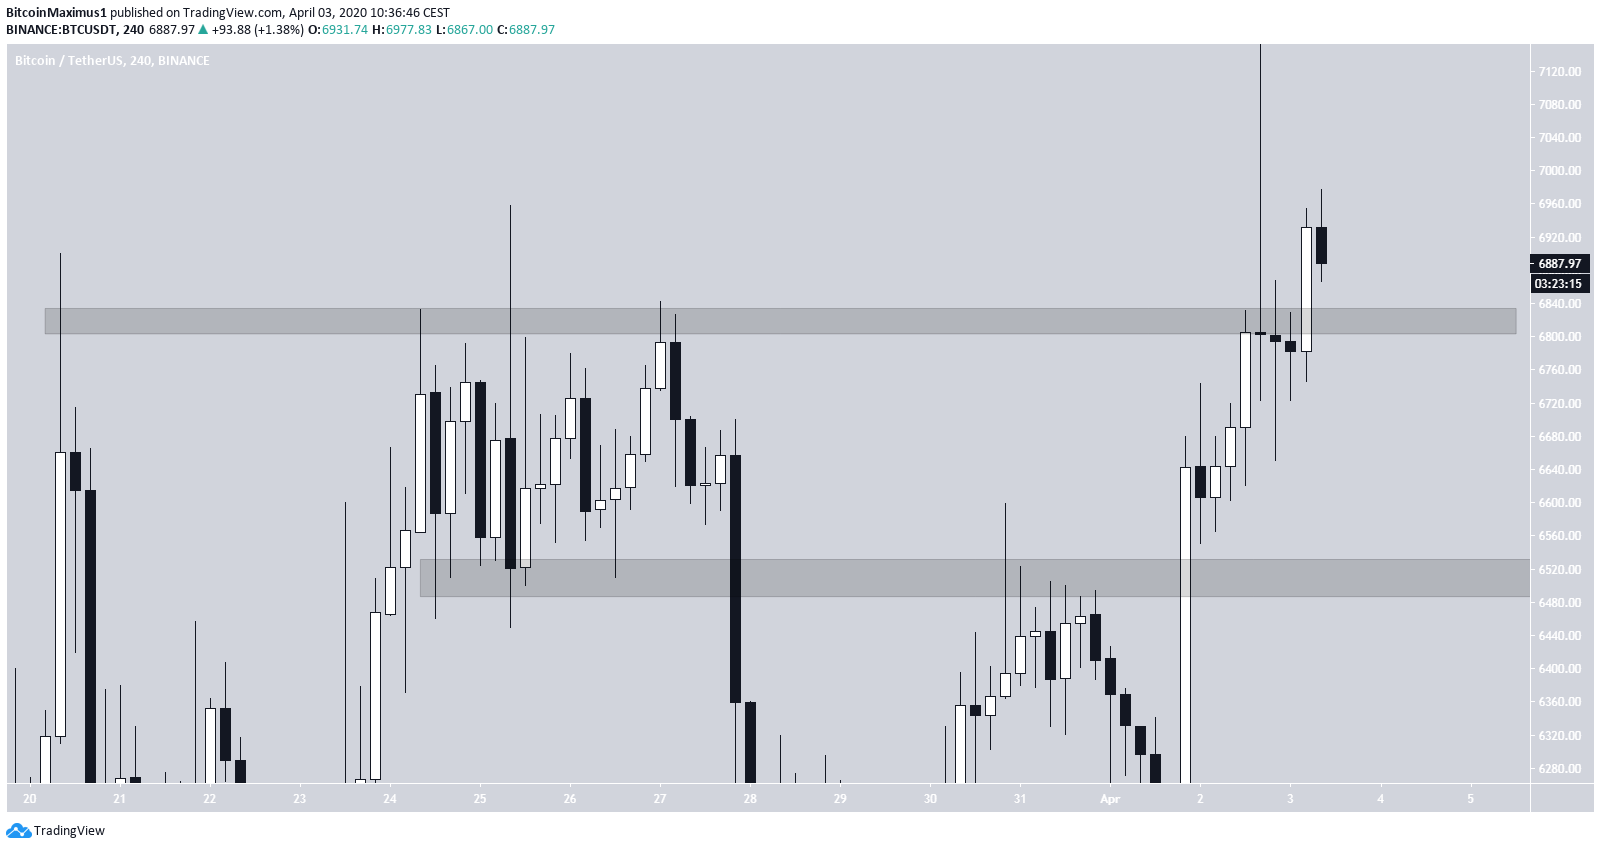
On April 2, the Bitcoin price initiated a very swift upward move, rallying from a low of $6,551 to a high of $7,194. While initially, it seemed that this movement would cause a breakout above the current pattern, the higher prices could not be sustained and BTC reached a close of $6,794, slightly below the main resistance level.
Short-Term Bitcoin Trajectory
In the short-term, the price seems to have successfully flipped the $6,800 level as support. If it is successful in holding on above, it is expected to continue moving upwards.
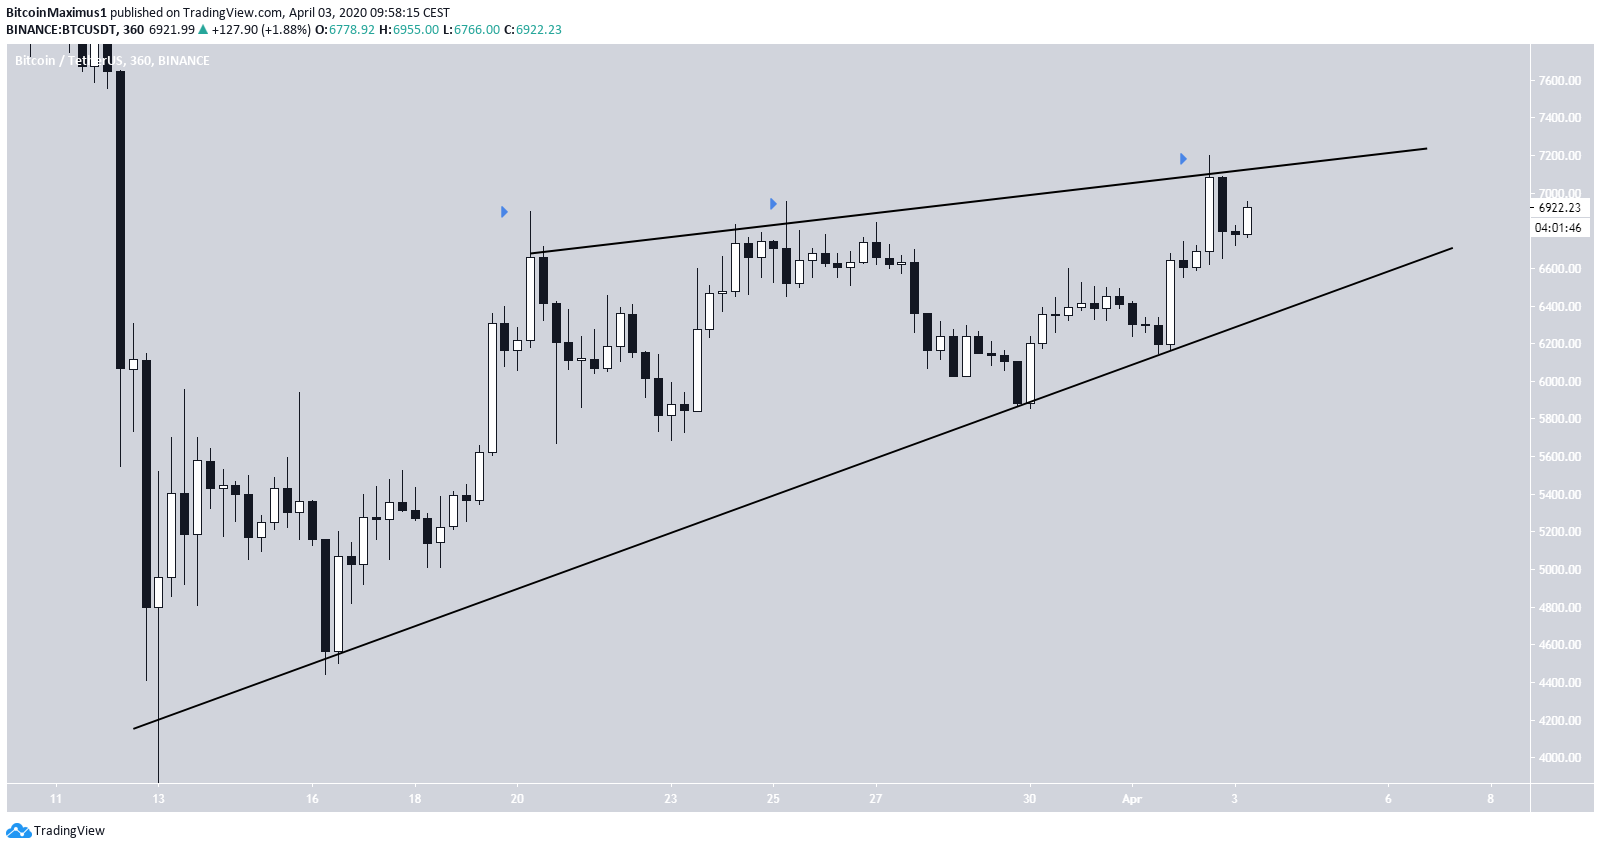
Triangle Or Wedge
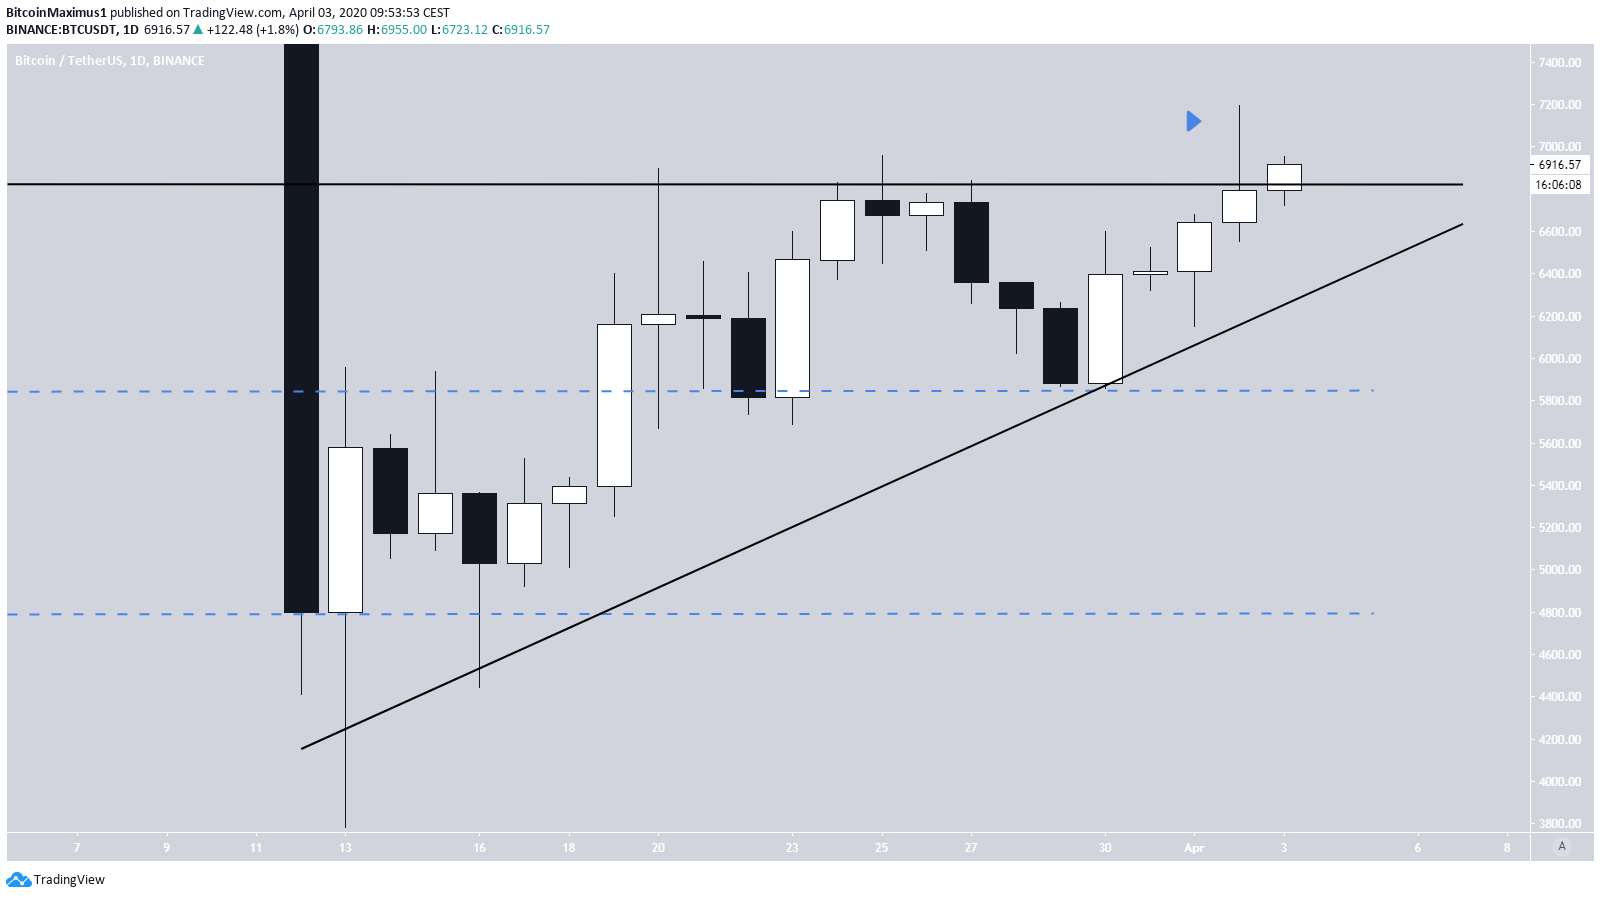
The BTC price is likely trading inside an ascending triangle, having done so since reaching a bottom on March 13. The horizontal resistance line is found at $6,800. Yesterday, while the price increased considerably above it, it failed to reach a close above. Instead, the price created a long upper wick and what resembles a shooting star candlestick, albeit with a bullish close. If the price were to break down from the triangle, the closest support areas are found at $5,800 and $4,800.

Long-Term View
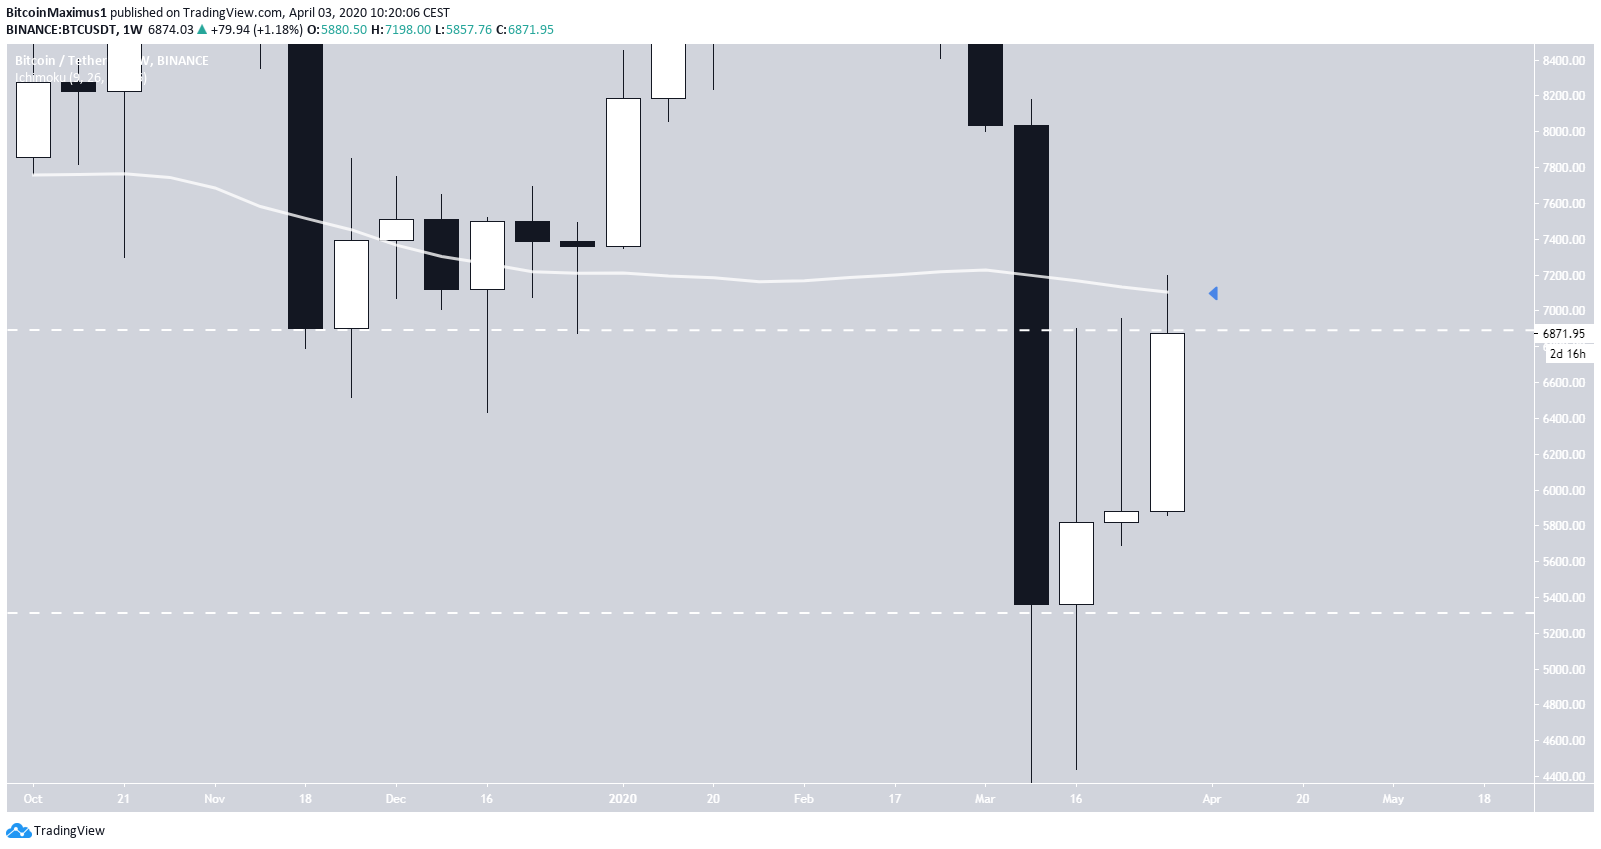
In the long-term, we can see that the price is currently right at a weekly time-frame resistance level. In addition, it is facing resistance from the 100-week moving average (MA). Therefore, until it flips this level as support, the current price movement cannot be considered bullish.
To conclude, the BTC price initiated an upward move on April 2 but failed to close high enough to be considered a breakout. The failure to do so and the current high time-frame resistance that the price is facing makes bias lean slightly bearish. While short-term increases could occur, the high time-frame resistance yet to be cleared is a major hurdle that the price will need to overtake if it is to continue its upward movement.
For those interested in BeInCrypto’s previous Bitcoin analysis, click here.
Disclaimer
In line with the Trust Project guidelines, this price analysis article is for informational purposes only and should not be considered financial or investment advice. BeInCrypto is committed to accurate, unbiased reporting, but market conditions are subject to change without notice. Always conduct your own research and consult with a professional before making any financial decisions. Please note that our Terms and Conditions, Privacy Policy, and Disclaimers have been updated.

Valdrin Tahiri
Valdrin discovered cryptocurrencies while he was getting his MSc in Financial Markets from the Barcelona School of Economics. Shortly after graduating, he began writing for several different cryptocurrency related websites as a freelancer before eventually taking on the role of BeInCrypto's Senior Analyst.
(I do not have a discord and will not contact you first there. Beware of scammers)
READ FULL BIO
Sponsored
Sponsored

