


There is an ever-present debate over whether the current Bitcoin (BTC) price movement is bullish or bearish. While the short and medium-term price movements can remain unpredictable, long-term calculations suggest Bitcoin might eventually reach $1M.
Since Bitcoin has a fixed supply cap of 21 million coins, it is likely immune to the effects of inflation. The same cannot be said for USD. Therefore, the BTC/USD ratio increases at a steady inflation rate. Theoretically, just holding Bitcoin for a year would result in a purchasing power increase as much as the inflation rate, without accounting for any real increases in its price.
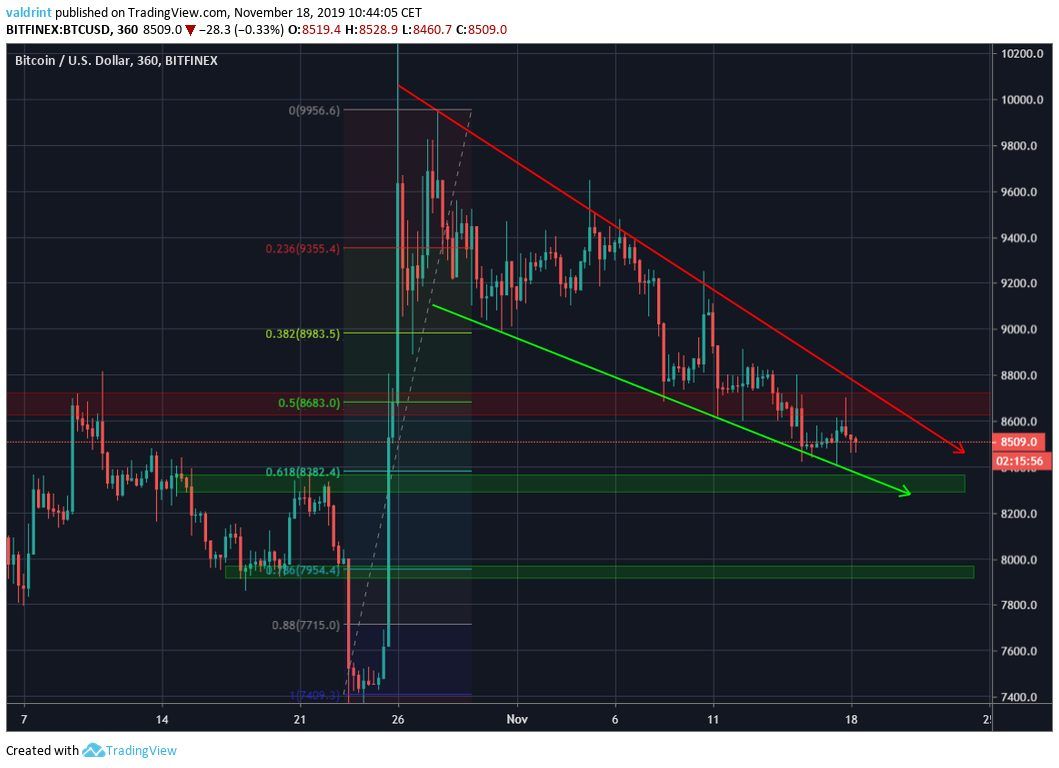
In the short-term, the Bitcoin price has been decreasing since October 25. It is approaching two major support areas that could be successful in reversing the price. Cryptocurrency trader @crediblecrypto stated that the Bitcoin price has almost reached the second major buy zone at $8000-$8300. After the Bitcoin price failed to bounce at $8600, this is the closest area that can provide a reversal.
Almost time…almost. https://t.co/Z9uWVQ1bQ6
— CrediBULL Crypto (@CredibleCrypto) November 18, 2019
Depending on when the Bitcoin price reaches it, a breakdown from the current trading pattern could be required for the price to get there.
Let’s take a closer look at the Bitcoin price movement and see if this decrease is likely.
Bitcoin’s Support Levels
Looking closer at the Bitcoin price movement, we can see that the $8600-$8700 support level (0.5 Fib) has turned to resistance, as evidenced by the creation of a bearish shooting star. However, we feel that the second buy zone can be divided into two more specific buy areas:
- $8000
- $8300.
A breakdown below the $8300 area would likely initiate a rapid decrease towards $8000. It would also indicate that the descending wedge has been broken.
Double Bottom
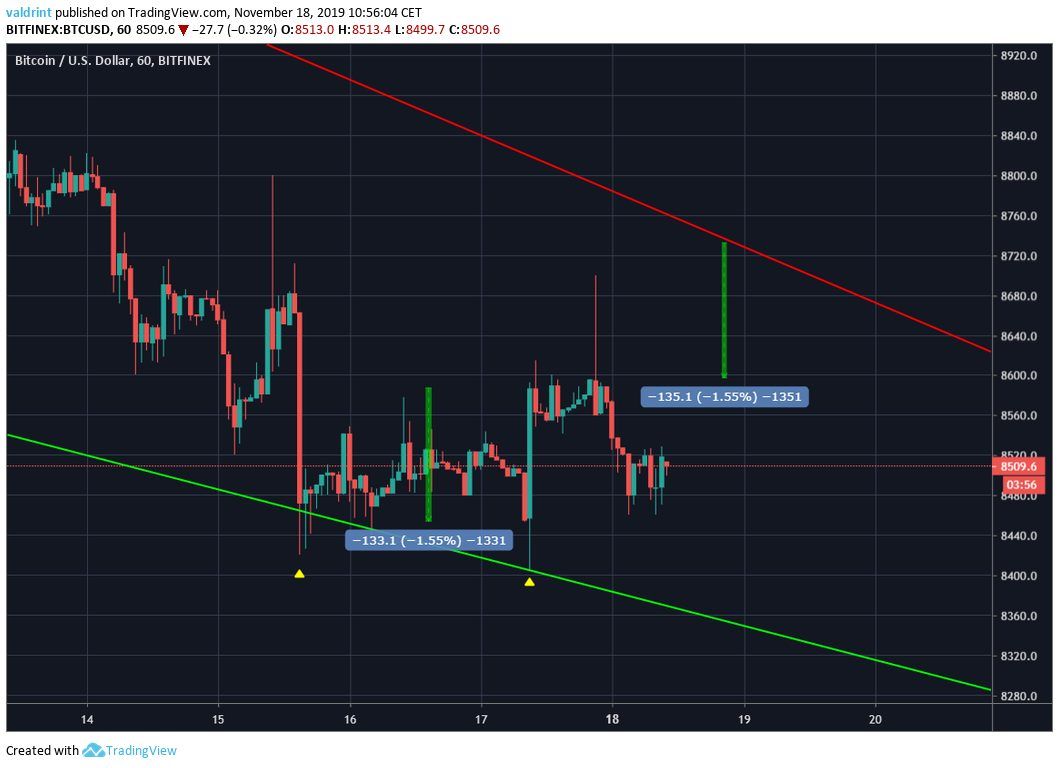
Looking closer at the Bitcoin price movement, we can see that BTC made a double bottom at $8400 — which was combined with long lower wicks. The second bottom was characterized by a bullish engulfing candlestick.
Based on the height of the pattern, a breakout from this range would likely take us to $8700.
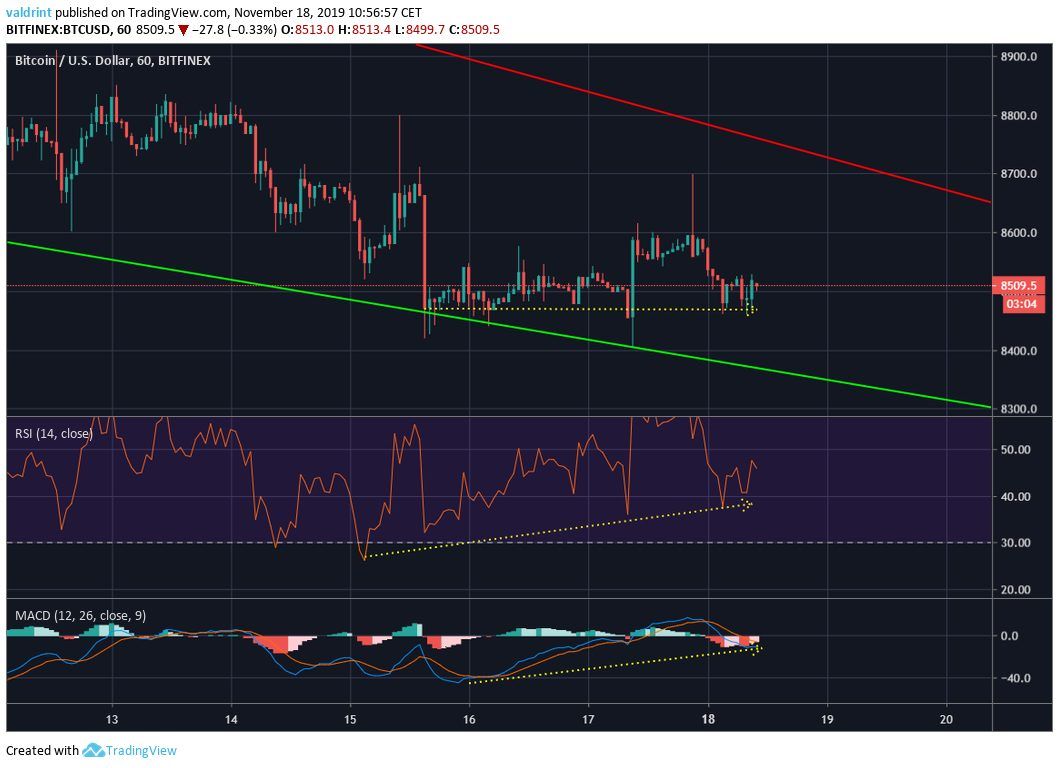
Also, both the RSI and MACD show a growing bullish divergence. This suggests that an upward move is in store and that Bitcoin will likely reach the resistance line of the wedge. Thus, a breakout cannot be ruled out.
Disclaimer: This article is not trading advice and should not be construed as such. Always consult a trained financial professional before investing in cryptocurrencies, as the market is particularly volatile.
Did you know you can trade sign-up to trade Bitcoin and many leading altcoins with a multiplier of up to 100x on a safe and secure exchange with the lowest fees — with only an email address? Well, now you do! Click here to get started on StormGain!


