


The Bitcoin price has been increasing without a significant retracement since March 13. However, the decrease beginning on April 13 might have been the first phase of a longer-term downward move.
Well-known trader @CryptoDonAlt outlined a BTC chart and stated that he believes this to be the most bearish close throughout this entire rally that began on March 13. In addition, he outlined three long-term support levels, assigned to one class of traders each. There is the:
- Support for bulls: $6,250
- Support for range nerds: $5,200
- Support for “bear tards”: $4,100
$BTC update:
This is the most bearish close we've had in this entire rally.
If there was ever a signal for bears to come out again, this is as good as it gets, so it would make sense for things to calm down and pull back from here.Supports outlined, let's see where it goes. pic.twitter.com/aIOie3P7e2
— DonAlt (@CryptoDonAlt) April 13, 2020
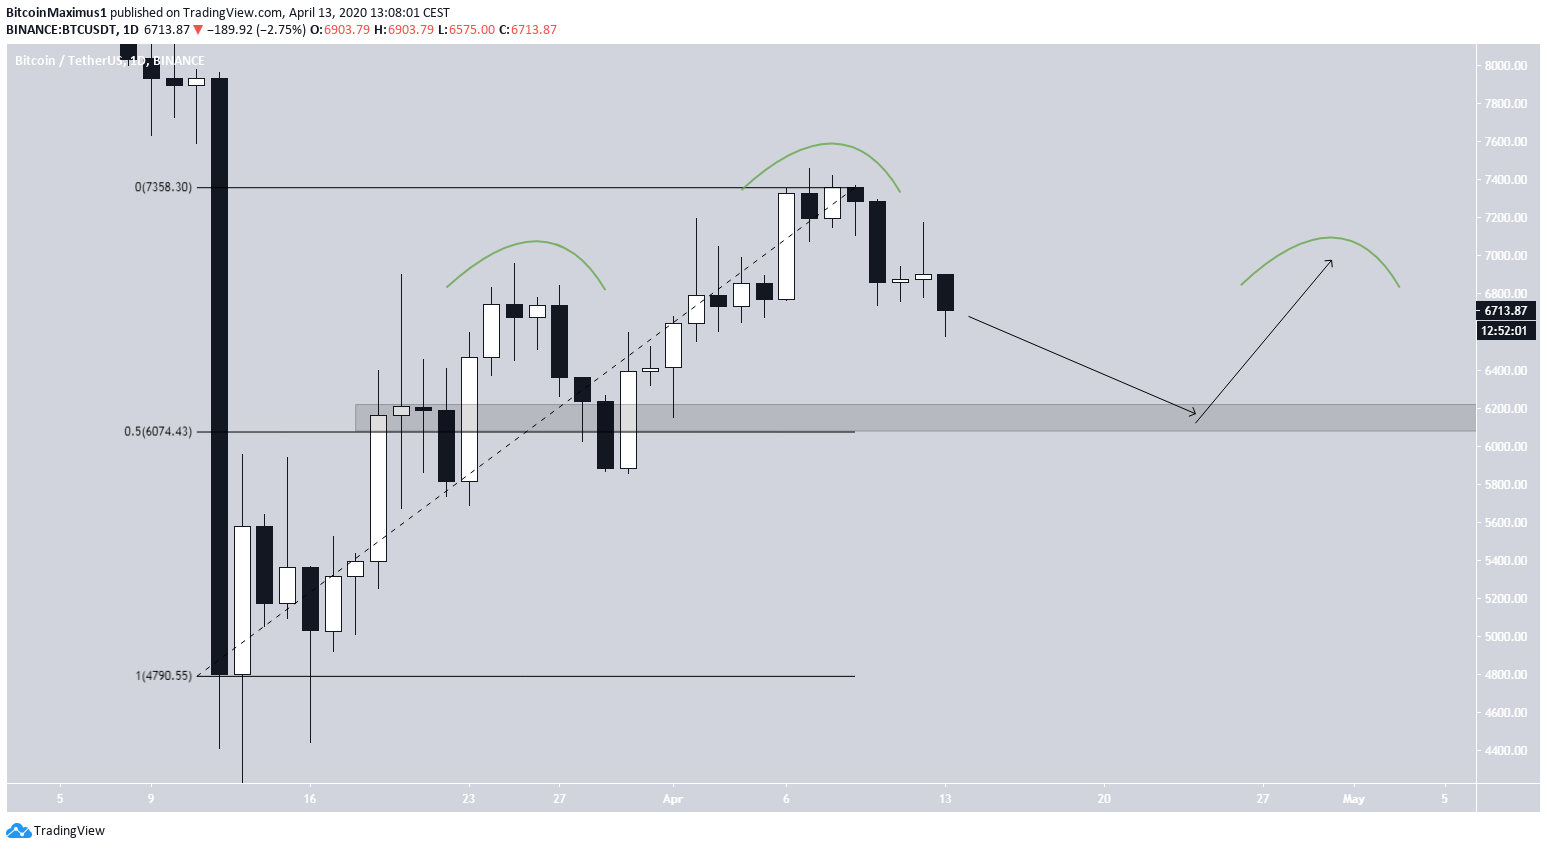
In the analysis, we will refer to them as the bullish, neutral and bearish close. Let’s take a closer look at the price movement and see where this is going.
Bullish Support
It is clearly visible that last week the price was rejected by the $6,800 level, which is crucial for the bulls to reclaim in order to keep the hopes of a continued upward move alive.
The first support area is found at $6,250. It is created by the long-term movement throughout June-November 2018.
Furthermore, once the price began an upward move in March 2019, it did not retest this area as resistance. In addition, during the March 20 drop, this area did not act as support. This reduces its importance, since the price has twice moved above/below it without validating it.
However, due to its close proximity, a bounce at this support level would likely serve as a higher low that causes the price to move higher.
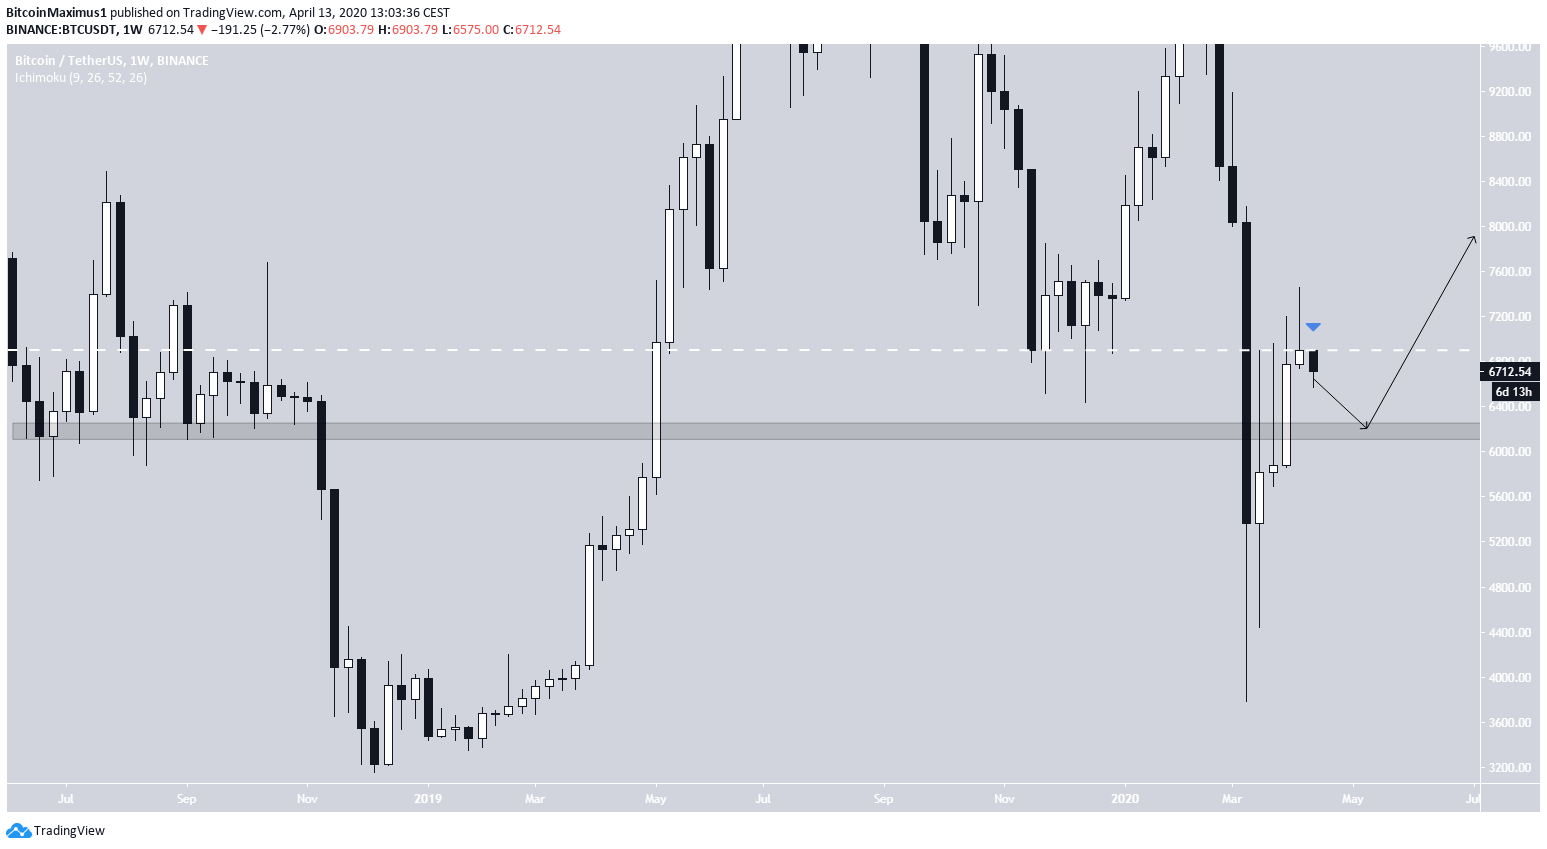
The support area represents the 0.5 Fib level of the entire previous upward move. Considering the two prior highs, a bounce at this area could serve as the neckline that afterwards completed the right shoulder of a head and shoulders (H&S) pattern. This would likely cause a breakdown afterwards.
Therefore, it seems unlikely that the price will bounce at $6,250. If it does, that would likely lead to another high prior to a decrease rather than it being the actual bottom.
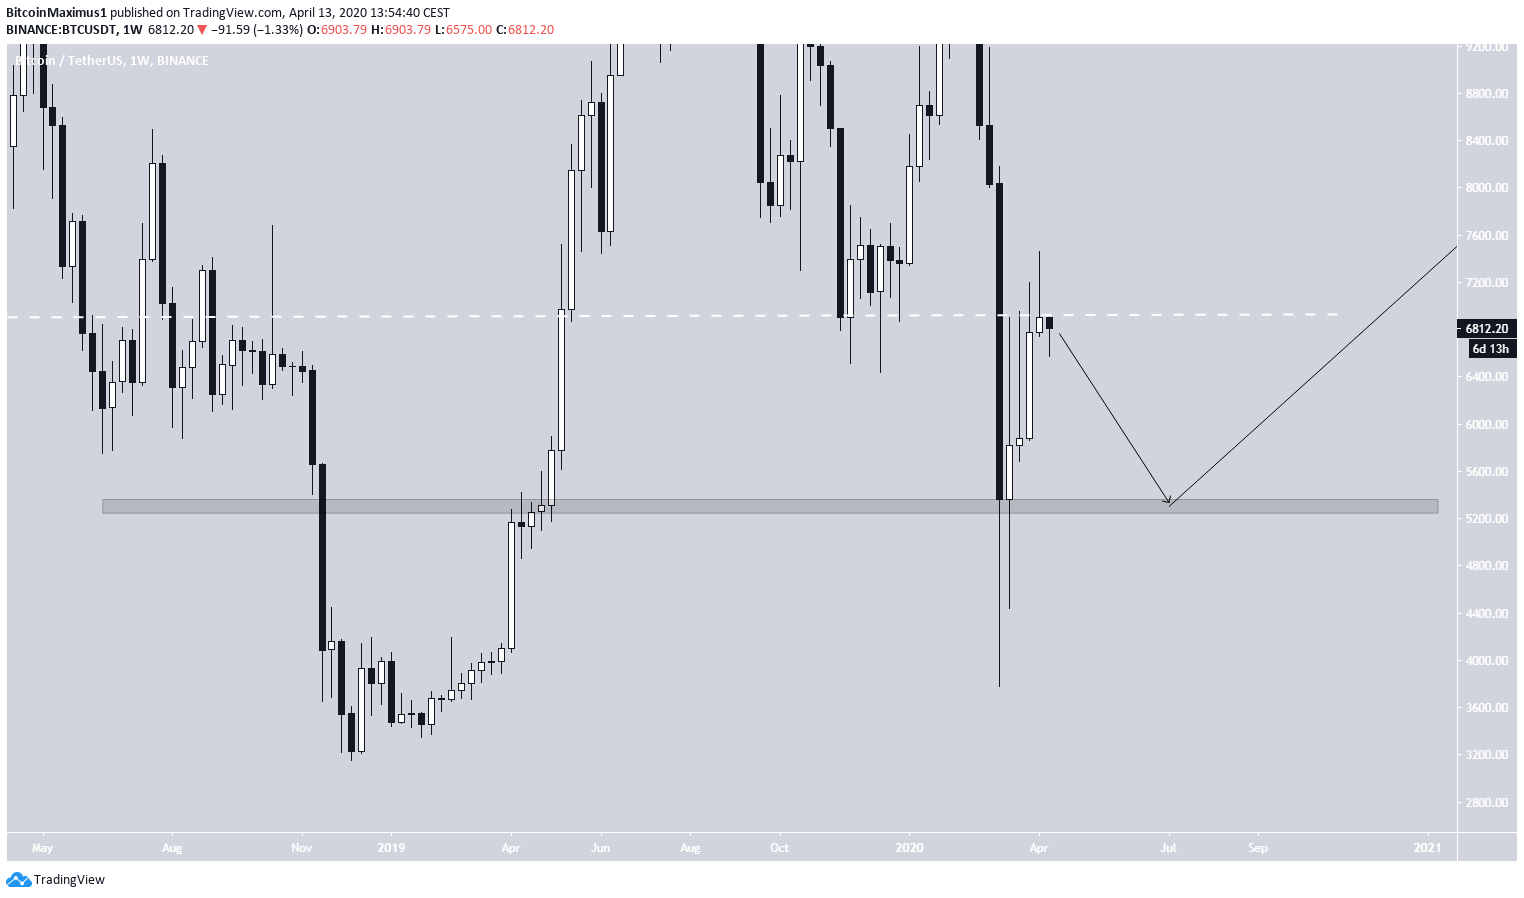
Neutral Support
The second possibility is that the price finds support at $5,400. This could be known as the double-bottom scenario, since a decrease to that level would entail a double bottom when looking at the weekly closing prices. We have outlined this possibility using a trading range in yesterday’s article.
This support area is more minor when compared to the first one since it was created later, during the upward move that began in March 2019. However, the price reacted to it during the way down in March 2020.
Therefore, it is entirely possible that the price makes a double/triple bottom at this level before beginning an upward move.
If the price were to bounce at this level, that would more likely be the beginning of a new upward move than a short-term upward move as was the case in the previous example.
Bearish Support
In the bearish possibility, the price would decrease all the way to $4,100, right at the resistance area of the price movement from January-March 2019.
This is the most bearish possibility, both since it represents the lowest low and the implications for the future movement. If BTC were to decrease all the way to this support area, it would be possible that it decreases further and creates a lower low. Even if it were to bounce, it would likely initiate a very long period of accumulation.
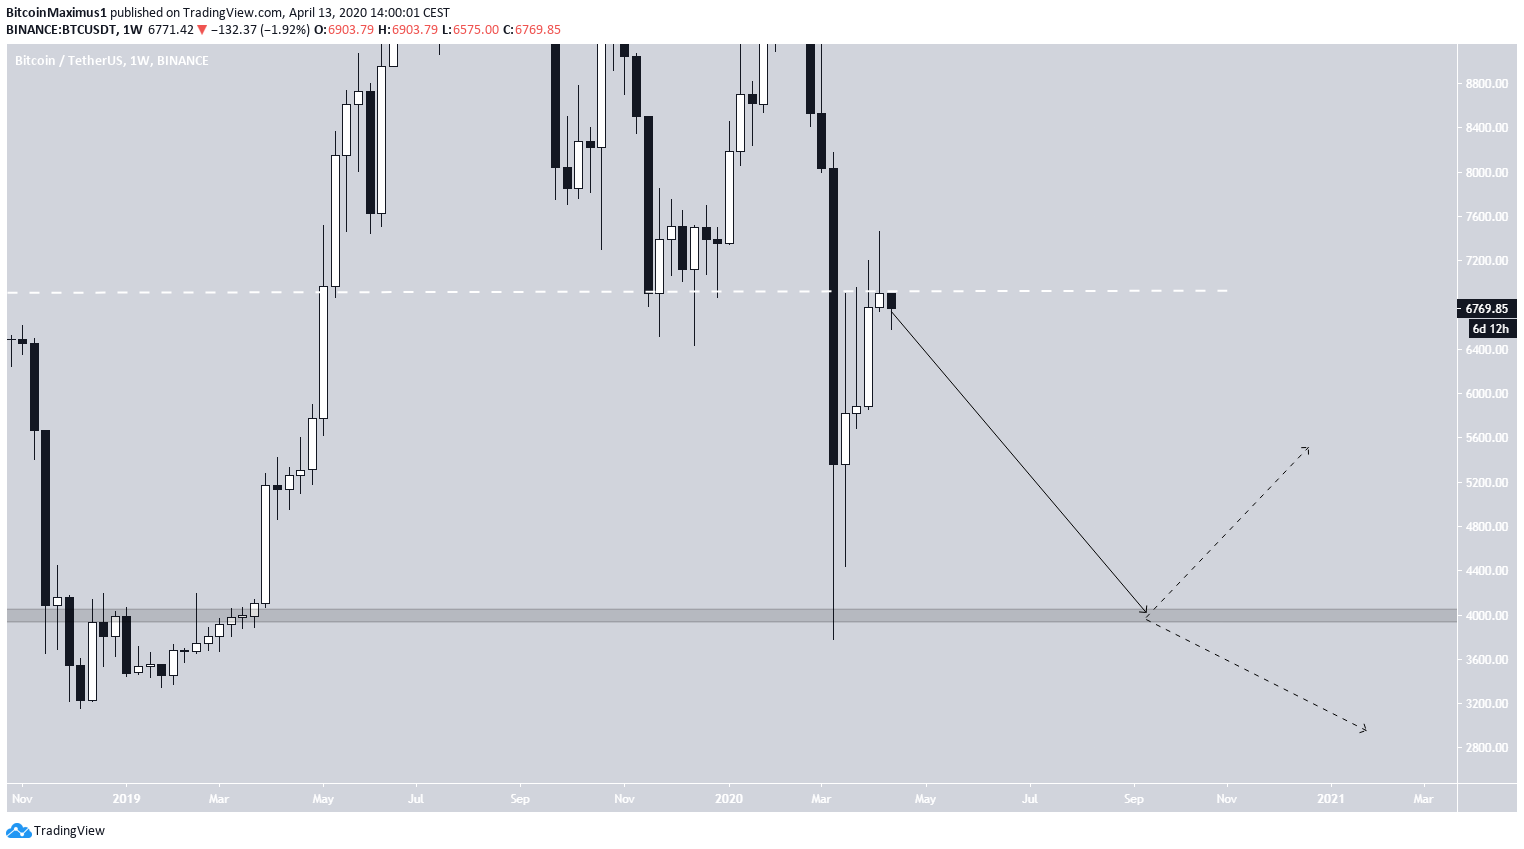
Therefore, if the price were to decrease all the way to $4,000, it could mean that the bottom is not yet in.


