Bitcoin (BTC) Price Highlights
- There is support at $7800 and $6800.
- The Bitcoin price is possibly trading inside a symmetrical triangle.
- BTC is expected to increase prior to the May block-reward halving.
Will the Bitcoin price reverse near the current level or are lower lows still to come? Keep reading below if you are interested in finding out.$BTC Weekly
— Posty (@PostyXBT) March 9, 2020
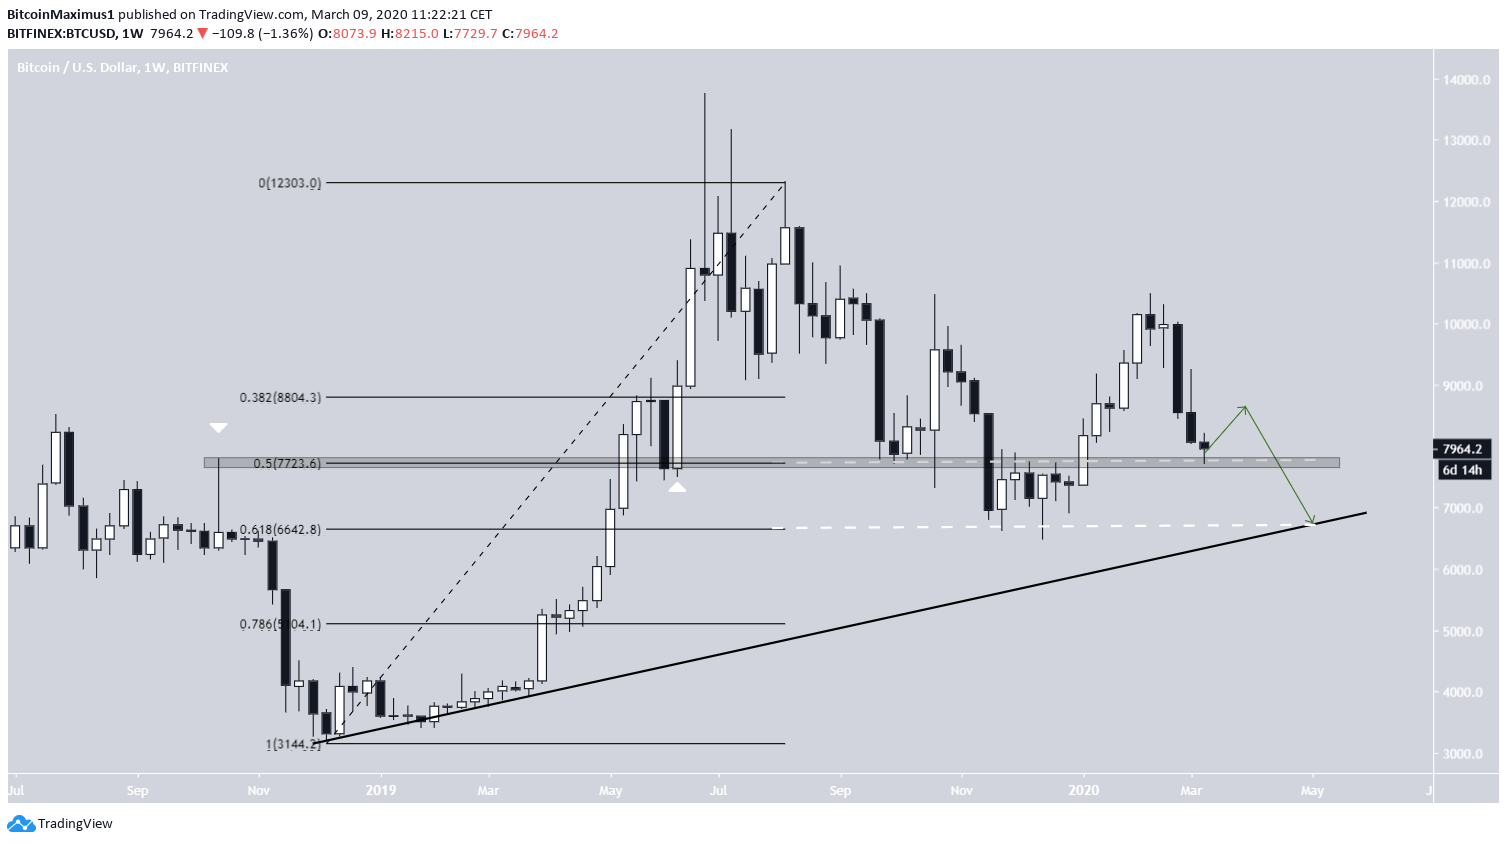
Another terrible weekly candle meaning we've now tapped $7.7k support much sooner than expected.
If price wants to make a higher low on the macro, this is where it would do imo.
The last line of support is $6.8k.
I'm buying some here regardless for the long term. pic.twitter.com/FmfAUyX3Bb
Symmetrical Triangle
 Zooming in slightly, we can see that the current support area is also the 0.5 Fib level of the entire price increase.
The next support area is the 0.618 level at $6700, which is also very close to the January open — making it a support level in the monthly time-frame. In April, it will coincide with the ascending support line drawn for the bottom.
Therefore, the most likely place for a trend reversal would be at $6700-$6900. A decrease below it would likely take the place to $5000.
 To conclude, the Bitcoin price has been rapidly decreasing over the past two weeks. While a relief rally is expected, we are expecting the price to eventually make another low near $6700-$6900.
Disclaimer
In line with the Trust Project guidelines, this price analysis article is for informational purposes only and should not be considered financial or investment advice. BeInCrypto is committed to accurate, unbiased reporting, but market conditions are subject to change without notice. Always conduct your own research and consult with a professional before making any financial decisions. Please note that our Terms and Conditions, Privacy Policy, and Disclaimers have been updated.

