


On Sept. 24, the Bitcoin (BTC) price created its first higher low since the Sept. 4 drop with a bullish engulfing candlestick. It is possible that this was the beginning of a new upward movement for BTC.
Bullish Engulfing Candlestick
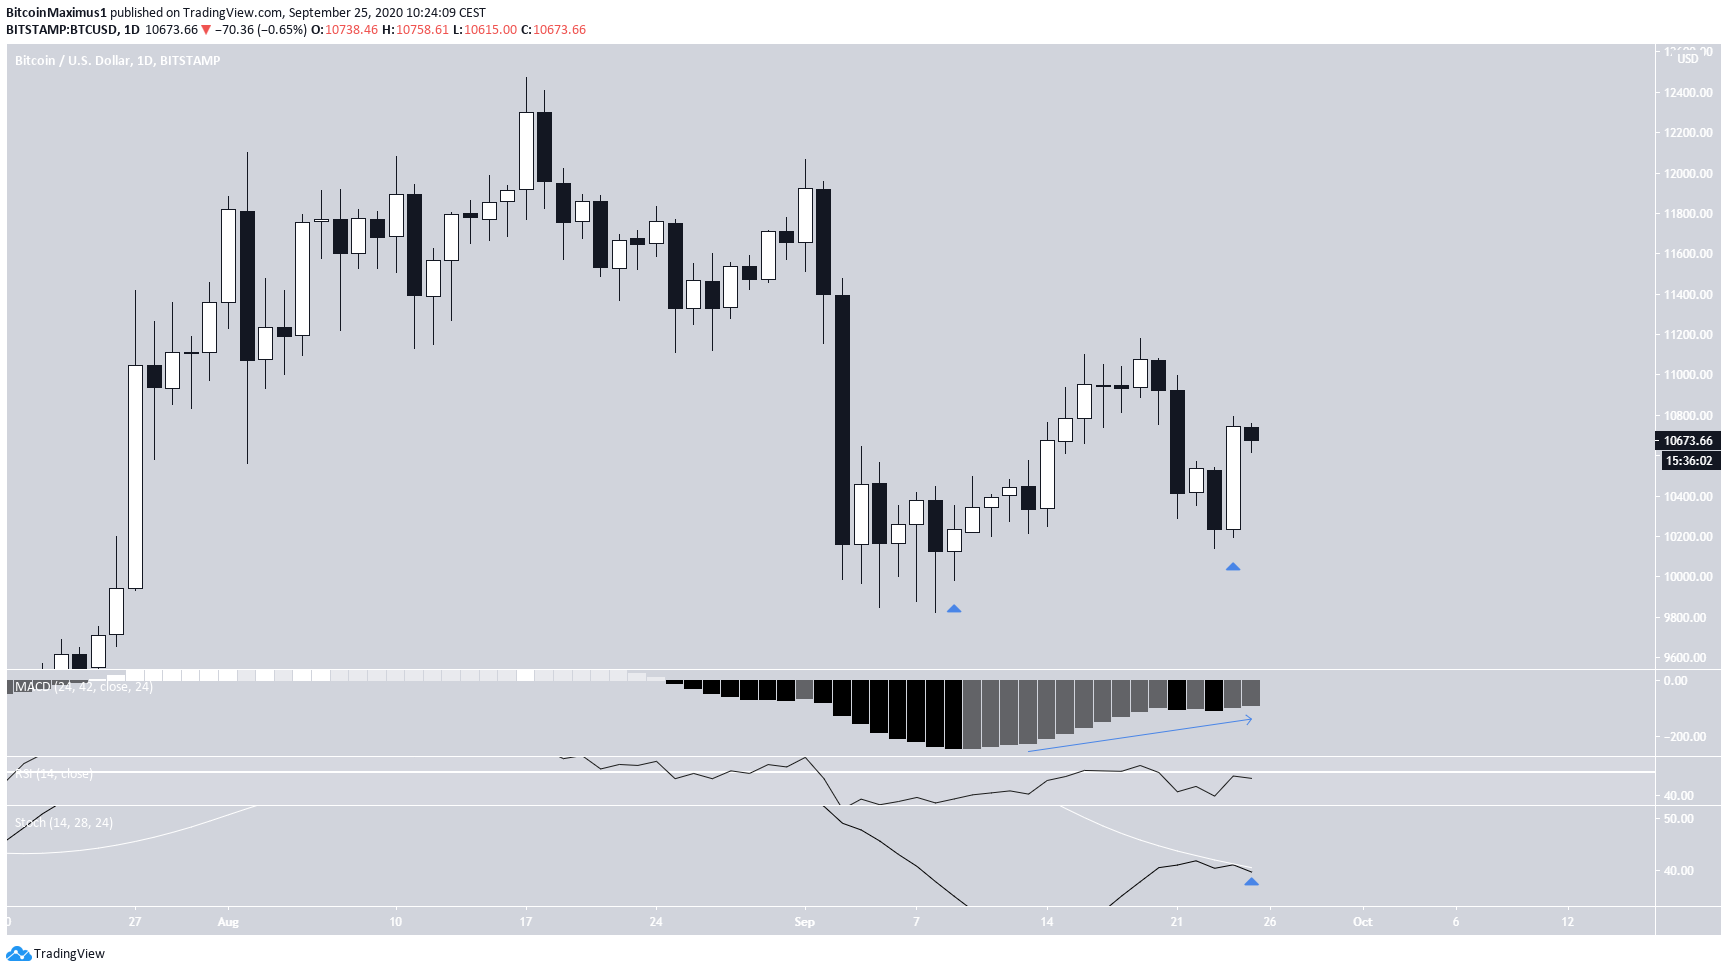
On Sept. 24, the Bitcoin price created a bullish engulfing candlestick, increasing from a low of $10,193 to a high of $10,795. This also created the first higher low since the Sept. 4 drop.
Despite this increase, technical indicators have yet to confirm the uptrend. While the MACD is increasing, it has not moved to positive territory yet and the RSI is below 50.
In addition, the Stochastic Oscillator has yet to make a bullish cross, which would go a long way in confirming the upward trend.
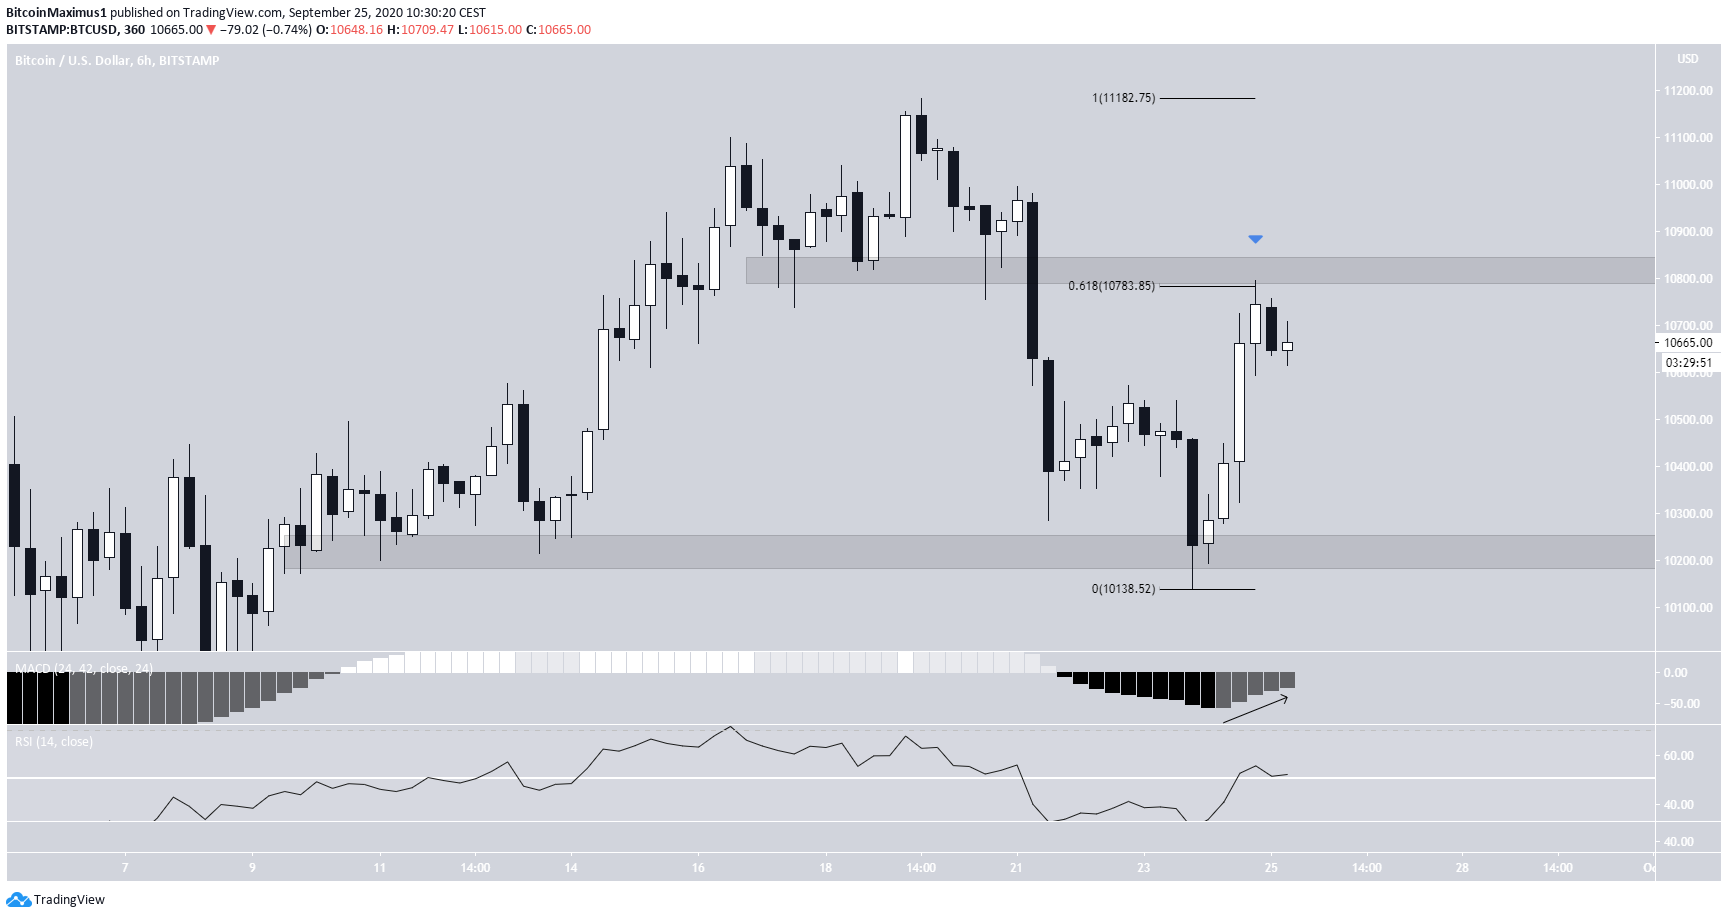
The shorter-term six-hour chart also suggests that the upward trend is not yet confirmed. The increase only reached the 0.618 Fib level of the previous downward move at $10,783, just below the $10,800 area, which previously acted as support and is now expected to act as resistance. This makes it possible that the movement was a retracement in response to the prior decrease. If so, the closest support area is found at $10,200.
Technical indicators are turning bullish. The MACD is moving upwards and the RSI is above 50. However, the former has not yet crossed into positive territory.
Short-Term Outline
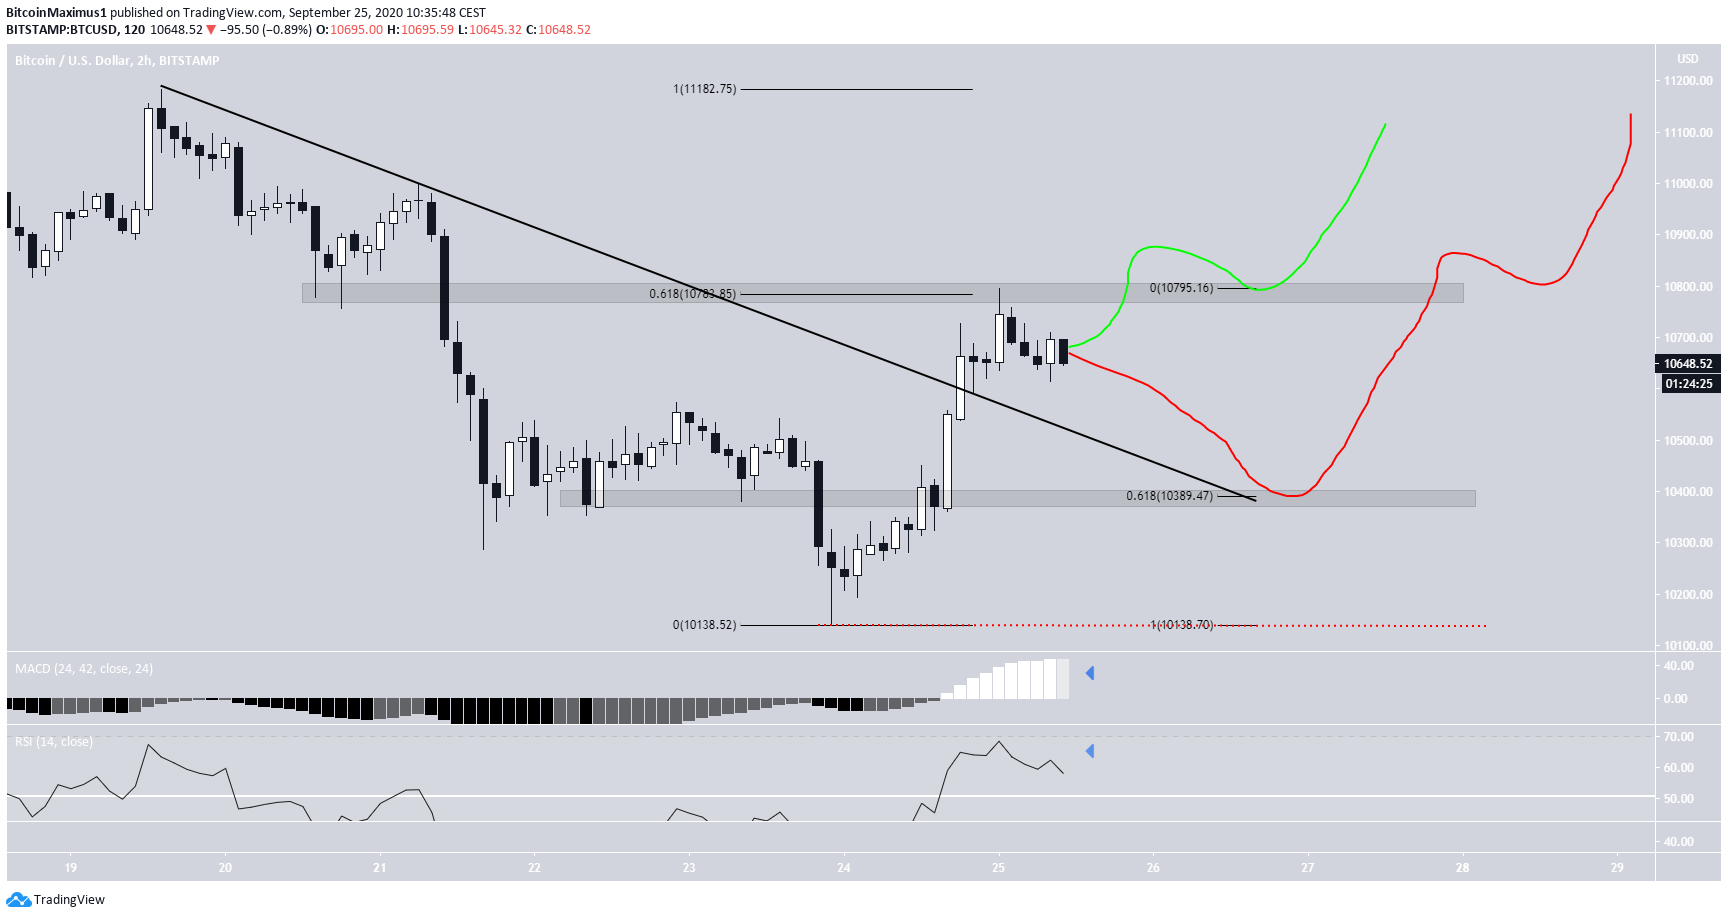
The increase in the two-hour chart shows that this could be the beginning of an upward move. The price has broken out from a descending resistance line, the MACD is positive and the RSI is moving upwards without generating bearish divergence.
The two most likely options are:
- A breakout above the $10,800 area and its validation as support before the price continues upwards (shown in green below);
- A decrease towards $10,400 before continuation above $10,800 (red).
At the time of writing, the second possibility looks more likely.
If the $10,400 area fails to hold, it would significantly decrease the chance of this being an upward move, and a decrease below the $10,138 low would confirm that it is not.
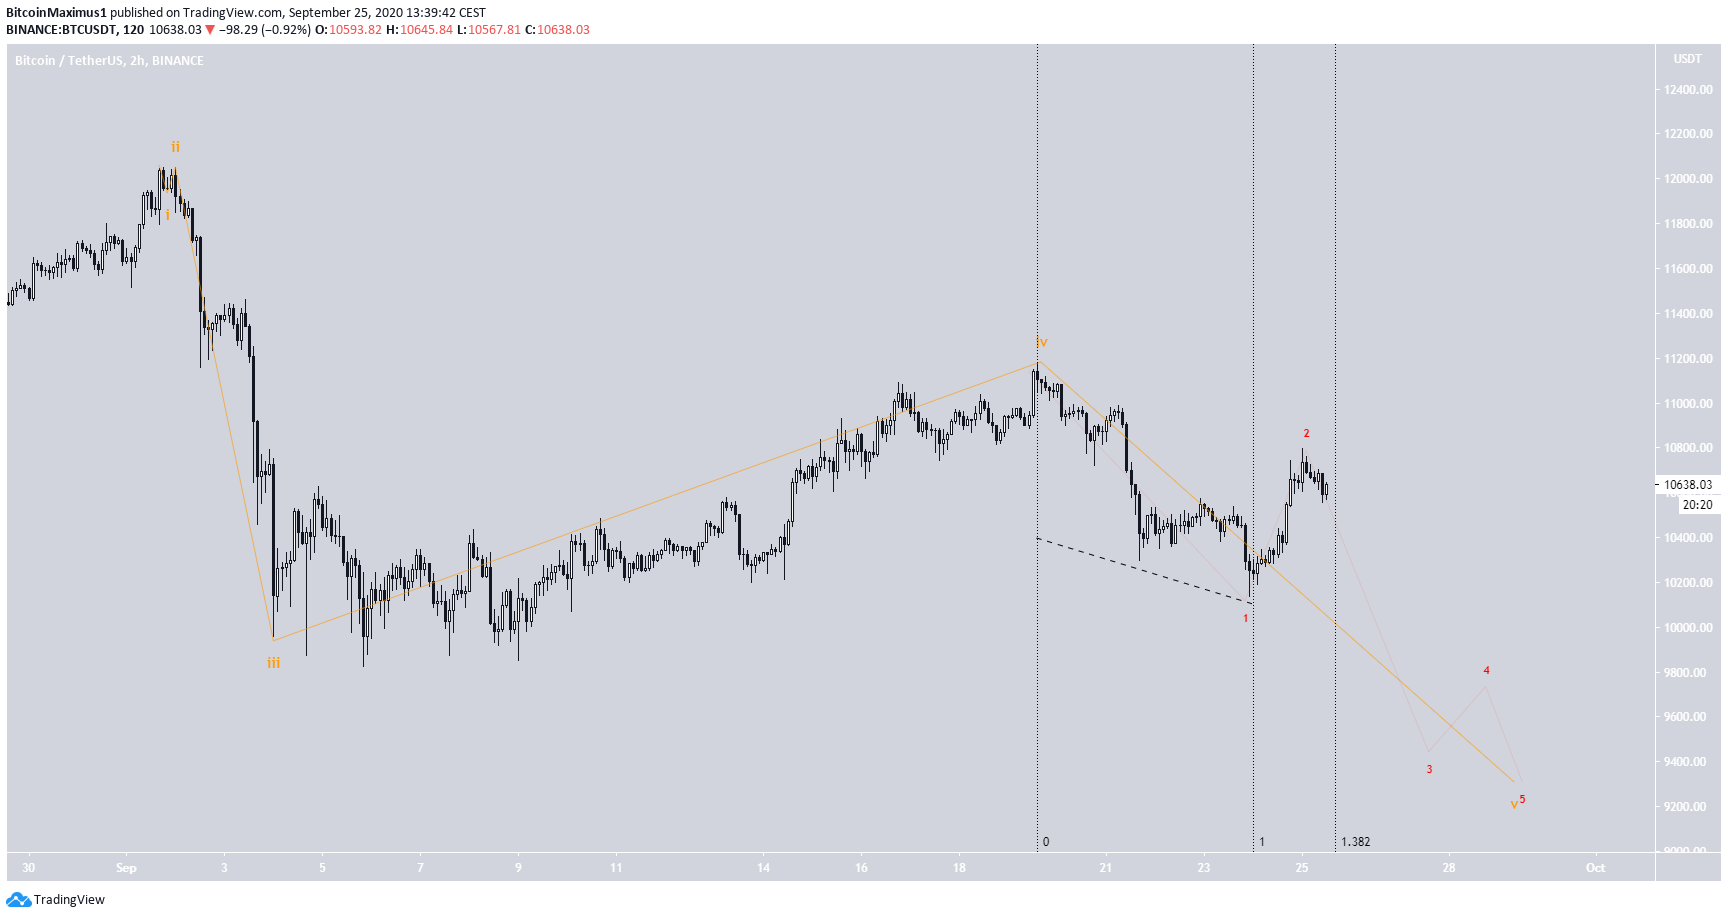
Wave Count
The recent BTC movement, especially yesterday’s increase, make it likely that the price began a bullish impulse (shown in orange below) on Sept. 9.
If so, the price has completed the first wave and its correction (red), and has now begun wave 3. This count would be invalidated with a decrease below the Sept. 23 low at $10,136.
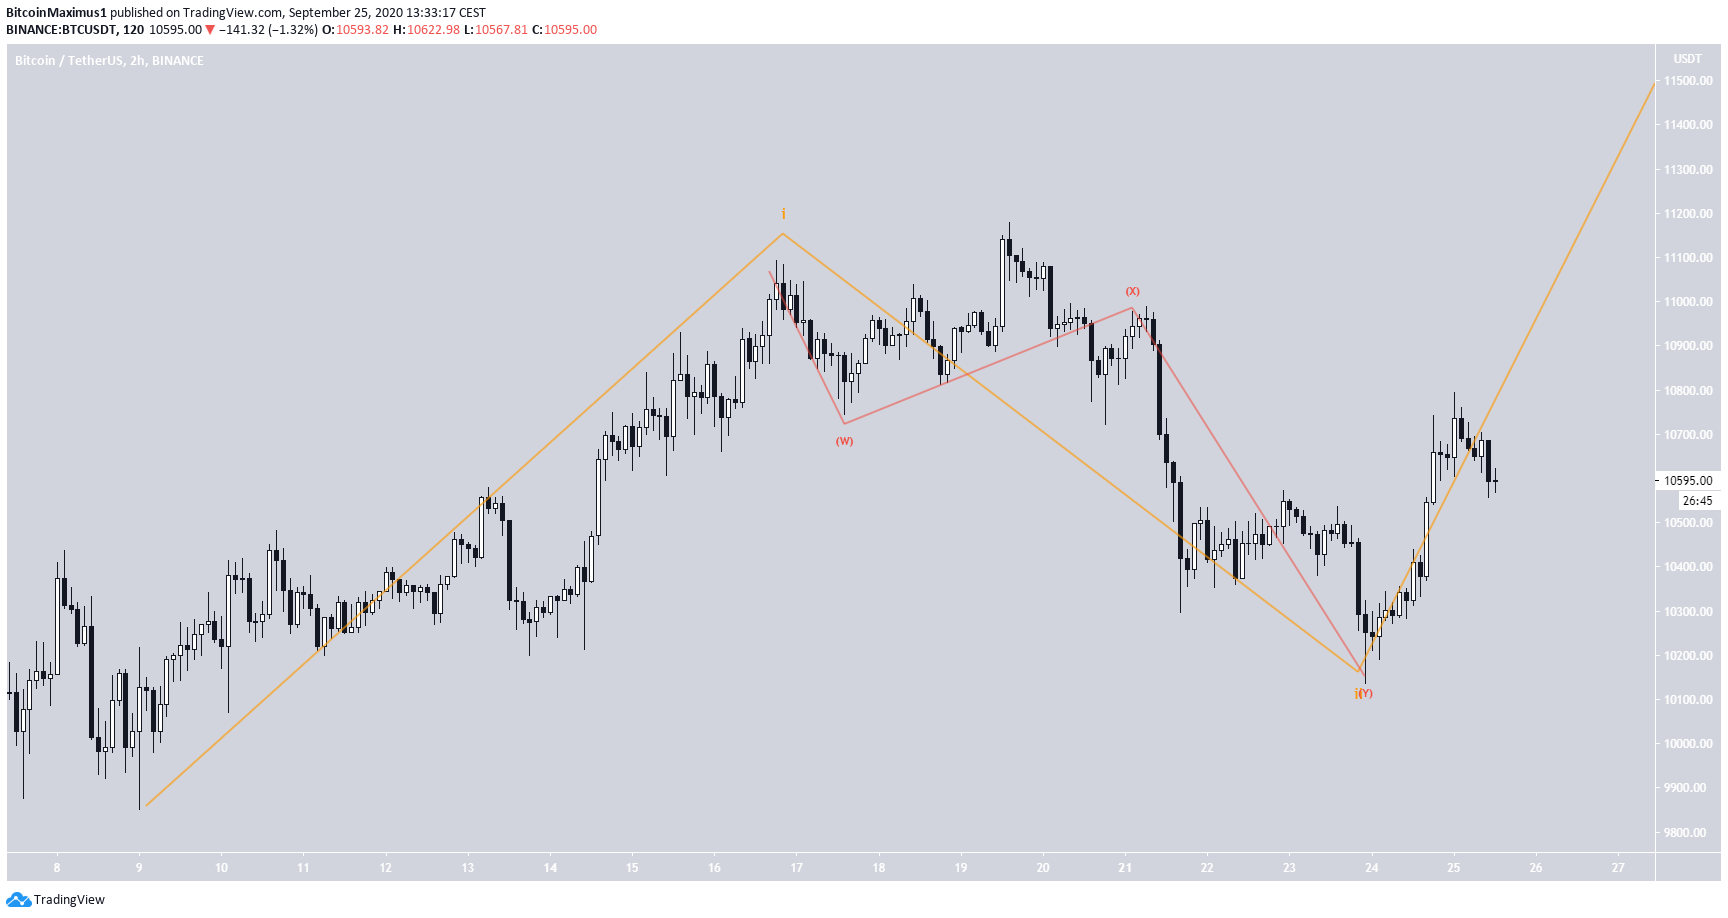
There is a bearish possibility, in which the previous increase was part of wave 4, and yesterday’s increase was sub-wave 2 of a bearish impulse (in red below). However, the correction was too short to be considered such and the count does not fit well with the longer-term movement, making it unlikely that this is the correct count, unless the price breaks down below $10,136.
To conclude, unless the BTC price decreases below $10,136, it is likely that it has begun a bullish impulse.
For BeInCrypto’s previous Bitcoin analysis, click here!


