![Bitcoin’s Current Upward Move Could Go As High As $9600 [Premium Analysis]](/_mfes/post/_next/image/?url=https%3A%2F%2Fassets.beincrypto.com%2Fimg%2FfEIAqDrySfyOIAxCytPgq-jTgxo%3D%2Fsmart%2Fc9fd4a21806d41908b4d6f92c2cb053e&w=1920&q=75)
The Bitcoin price could soon initiate another upward wave that takes it as high as $9600. This increase would be the fifth wave in a five-wave Elliott formation.
Highlights
- The Bitcoin price has broken out above a significant resistance line.
- It is possibly in the fourth wave of a five-wave Elliott formation.
- The fifth wave could go as high as $9600.
Trader Benjamin Blunt outlined a Bitcoin price chart in which the price completed a fifth wave near $9600, before retracing in order to complete the right shoulder of an inverse head and shoulders (H&S) pattern. Afterward, he predicts an accelerated rate of increase.
from a macro point of view i think we head up to that horizontal resistance at 9.6k to complete a 5 wave rise, then get a decent pullback before the big run up to new highs can occur.
another thing ive noticed is people are just too damn scared to say those 3 important words pic.twitter.com/ngmpvOpiJ3
— Bluntz (@Bluntz_Capital) January 20, 2020
Let’s take a closer look at the Bitcoin price movement and see if this prediction is likely to come to fruition.
Bitcoin Resistance Slope
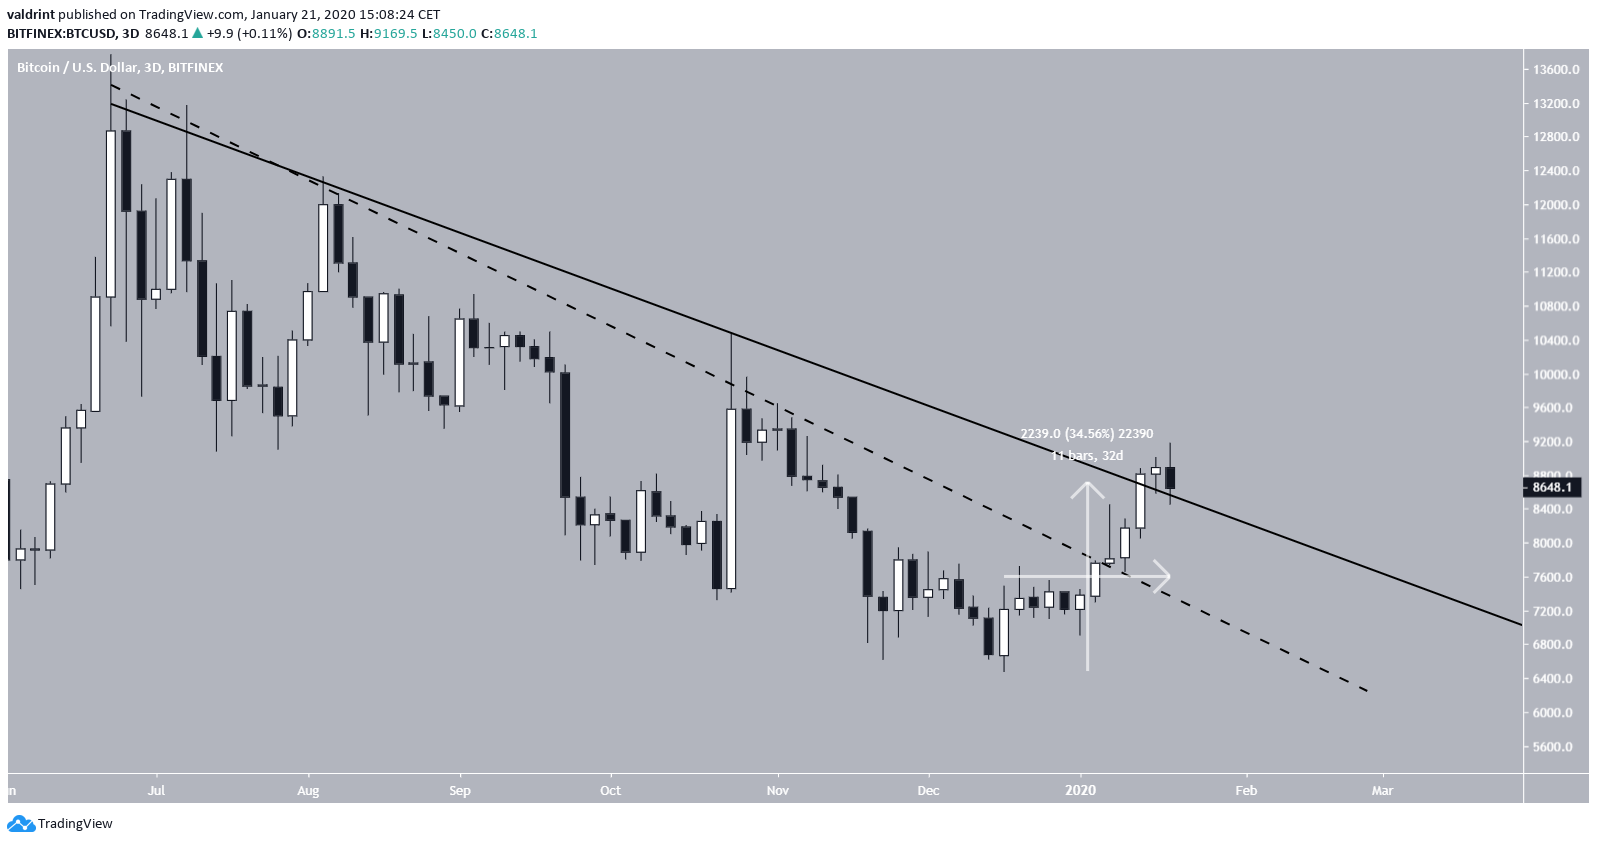
The Bitcoin price had been following a descending resistance line since reaching a high of $13,764 on June 24, 2019. While it seems as if the price has definitely broken out above the resistance line, we are not completely sure as to what the exact slope of the line is. Thus, the breakout either happened on January 4 or 16.
But, what is certain is the strength of the current upward move. Since December 18, 2019, the BTC price has increased by 34.5%, causing the aforementioned breakout.
Five Wave Elliott Formation
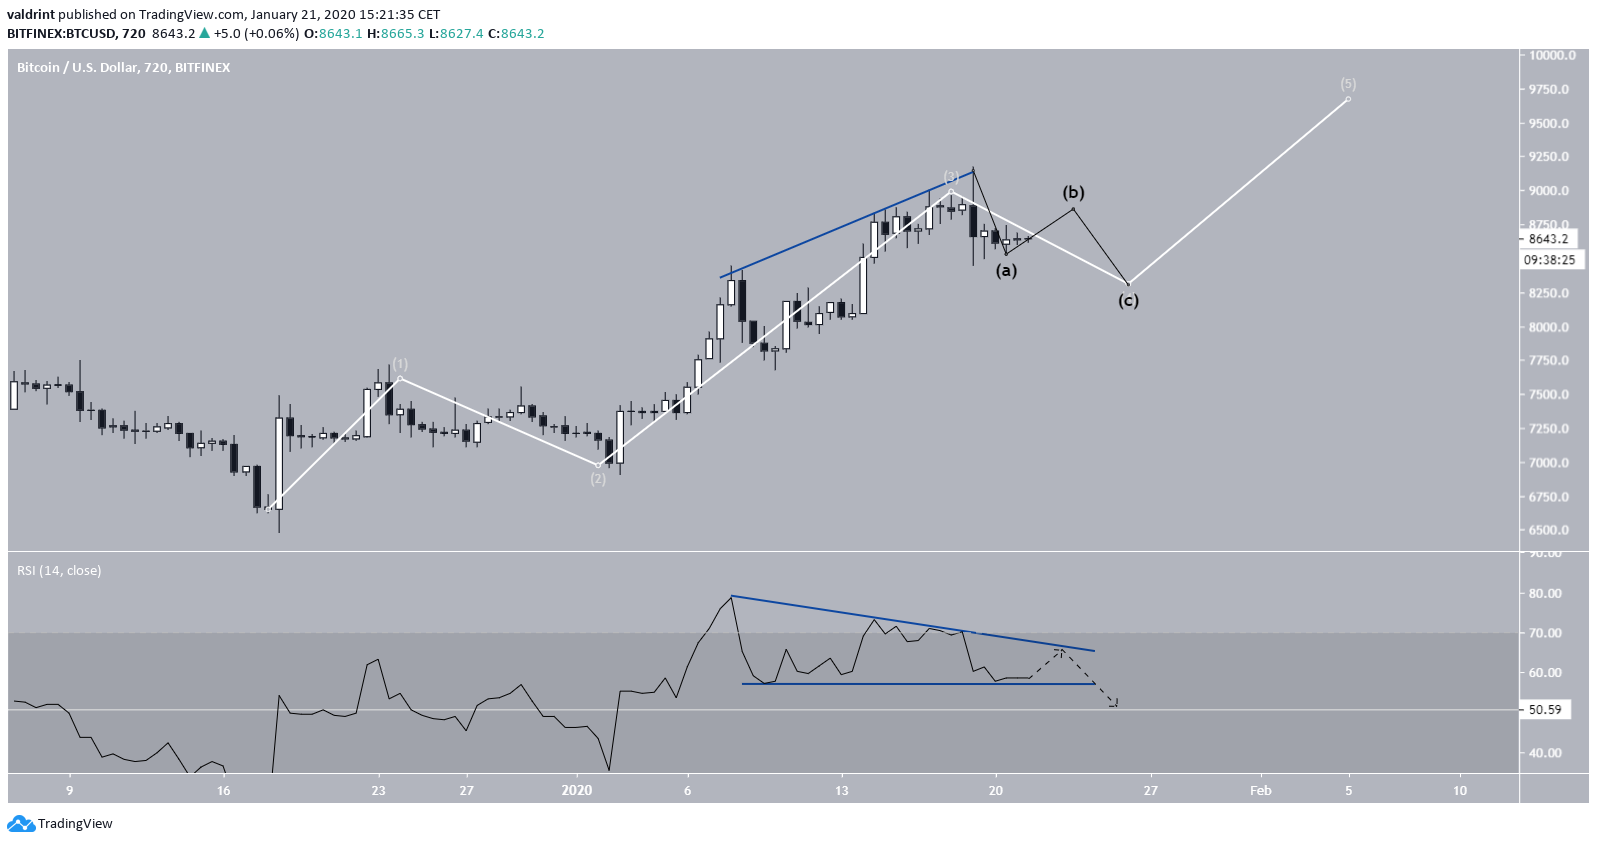
The tweet outlined a five-wave Elliott formation, in which the price is currently completing the fourth wave, which is a bearish one.
This hypothesis fits with the 12-hour RSI. In the period from January 7-20, the RSI generated bearish divergence. The ensuing price decrease created a horizontal support line in the RSI and in turn a descending triangle. Therefore, we could definitely see a price increase that causes the RSI to touch the descending resistance line followed by a breakdown that would complete the fourth wave.
Afterward, the price could begin the fifth wave, which according to the tweet can go as high as $9600. The RSI weakness fits with this hypothesis since as the formation is nearing its end, weakness is to be expected.
Bitcoin Inverse Head and Shoulders
We stated that the tweet outlines the $9600 area as the top for the fifth wave. This seems reasonable since that is a significant resistance area.
Afterward, the price could complete the right shoulder of an inverse H&S pattern near $7600. An A-B-C correction could take the price directly to this area, completing the five-wave formation and the inverse H&S.
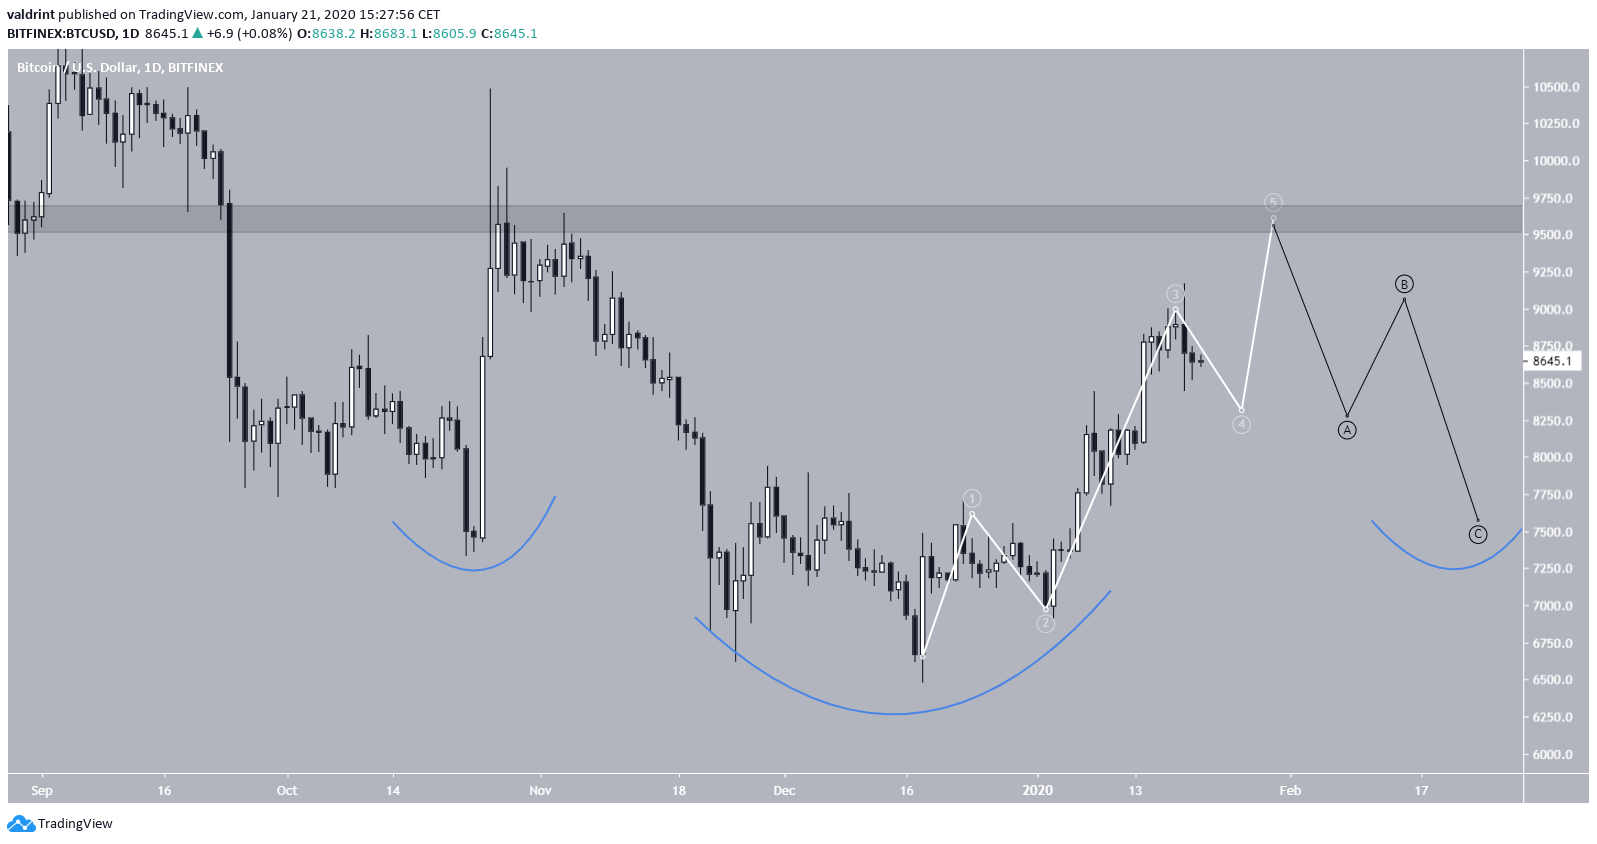
To conclude, the Bitcoin price recently broke out above a significant resistance line that had been in place for roughly six months. It seems to be in the fourth wave of a five-wave Elliott formation, which would take the price as high as $9600. Afterward, a corrective period is expected.
