


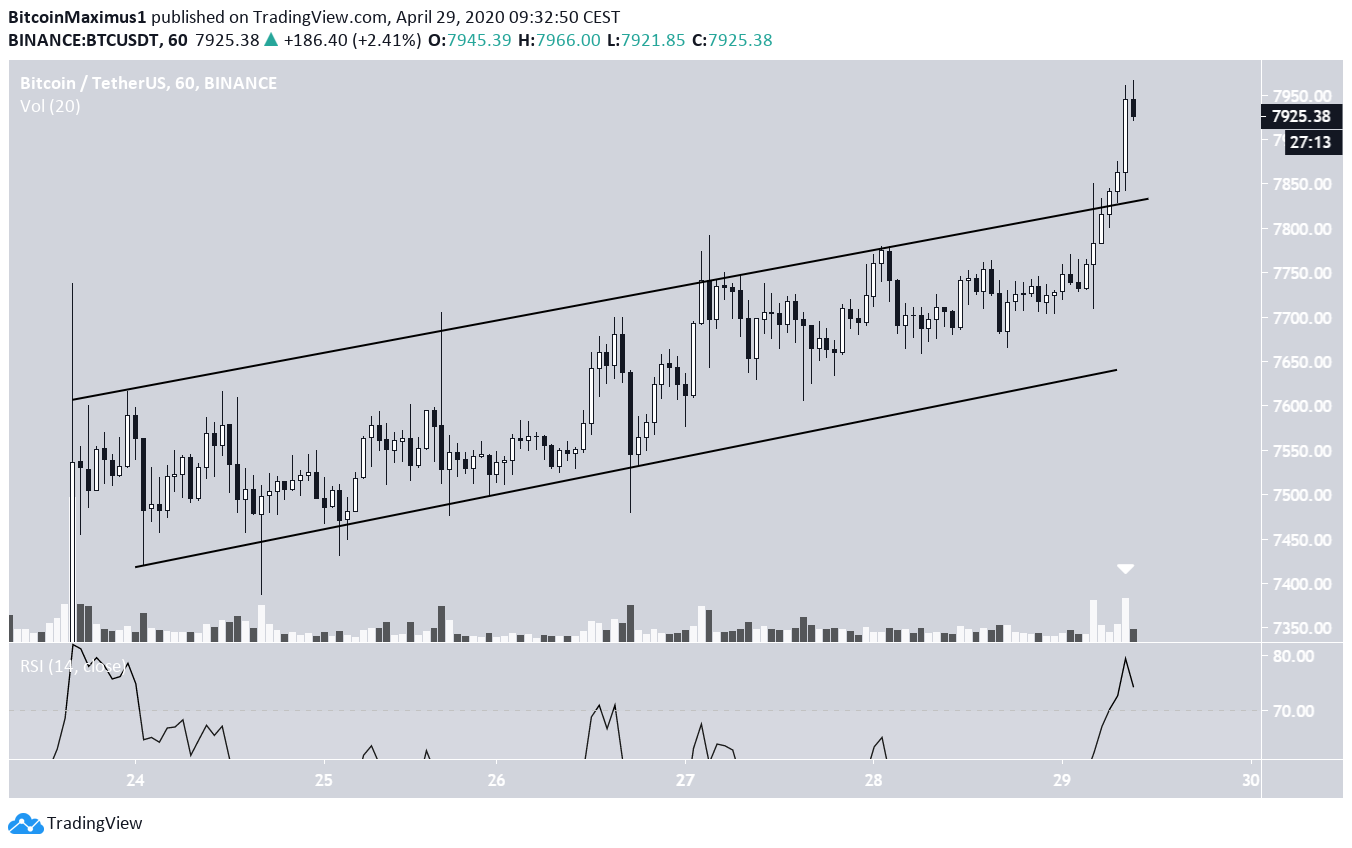
On April 29, the Bitcoin (BTC) price broke out from a short-term ascending channel that had been in place for the past five days. The price reached a high of $7966 before decreasing slightly.
Bitcoin’s Breakout
After five unsuccessful attempts at moving above the resistance line, the Bitcoin price finally managed to move above it on its sixth try. The breakout transpired with higher than average volume. Since then, the price has yet to validate the resistance line it just broke out from as support.
While the hourly RSI is deep into overbought territory, it has yet to generate any type of bearish divergence — indicating that the upward move might continue.
Long-Term Ascending Channel
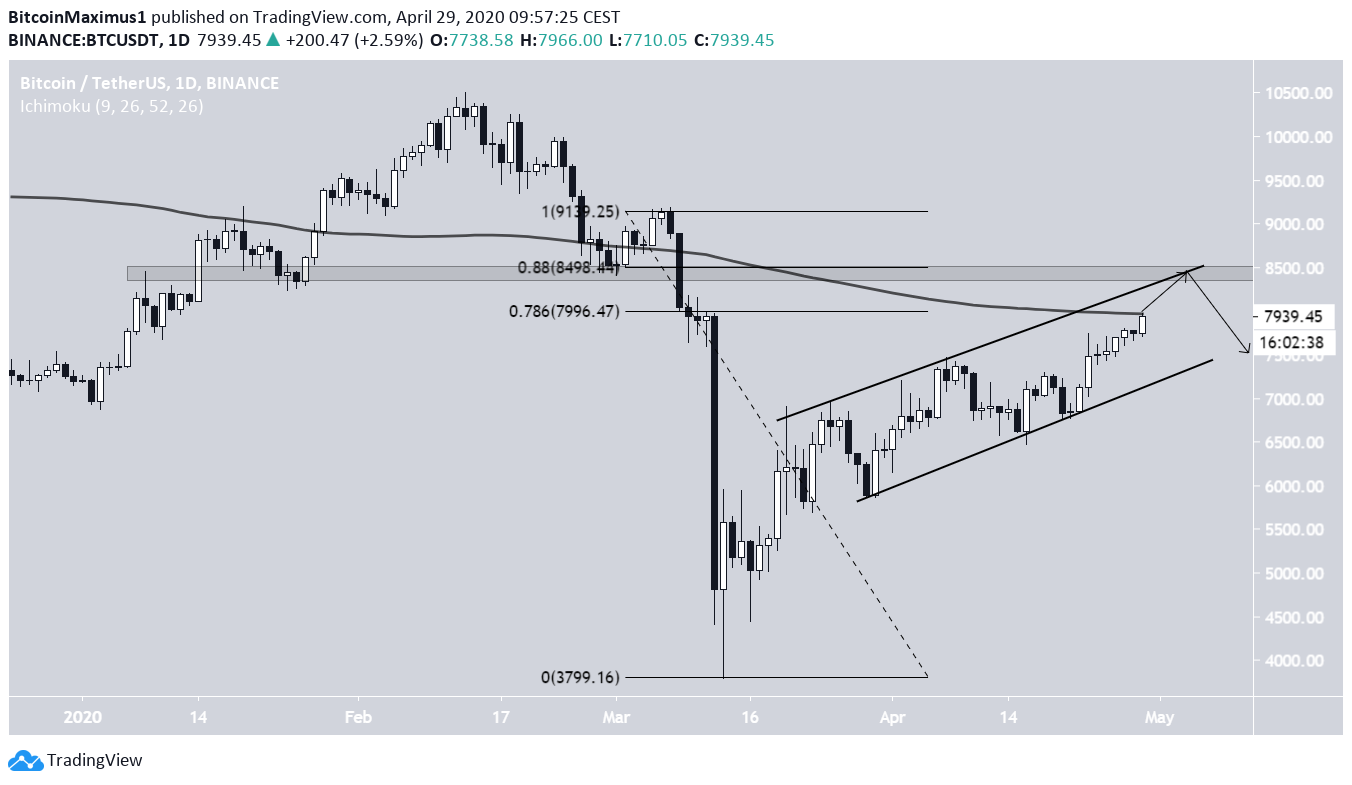
The Bitcoin price is also trading inside a longer-term ascending channel, having been doing so since March 20. At the time of writing, the price was trading very close to several resistance levels, them being:
- The 0.786 Fib level of the previous decrease
- The 200-day moving average (MA)
- The resistance line of the channel
Therefore, it is possible that the BTC price reverses at the current level while decreasing towards the support line. On the other hand, the next resistance area is found between $8400-$8500. This is the highest level that BTC can increase while its price movement is still considered a retracement.
A breakout above this level would indicate that BTC has begun a new upward move.
Wave Count
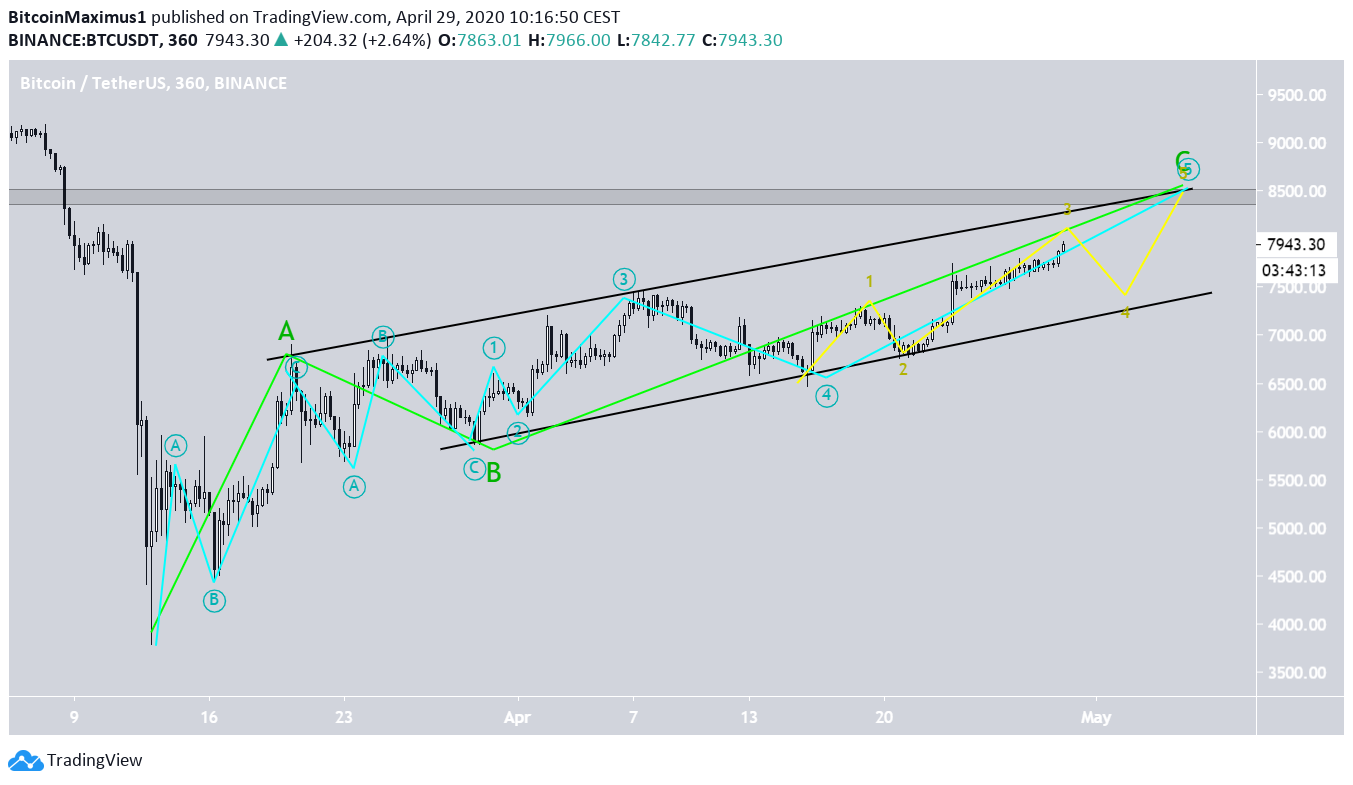
The long-term wave count for Bitcoin suggests that this is the fourth wave in a five-wave downward Elliott formation. Therefore, it indicates that the price will soon reach a top and drop towards new lows.
This fourth wave is transpiring with an A-B-C formation (green), which has a 3-3-5 wave count (blue). If so, the BTC price is currently in its fifth sub-wave — meaning it is very close to reaching a top.
The fifth sub-wave is also transpiring inside a five-wave Elliott formation (yellow), in which the price is likely in the third wave. Therefore, the most likely move would be a retrace towards no lower than $7500 — the top of the first wave — followed by an upward move towards $8500.
For those interested in BeInCrypto’s previous Bitcoin analysis, click here.


