The Bitcoin price just completed a Bart pattern to the downside and is in the process of completing another one. The latter could take the price to $7200 or below.
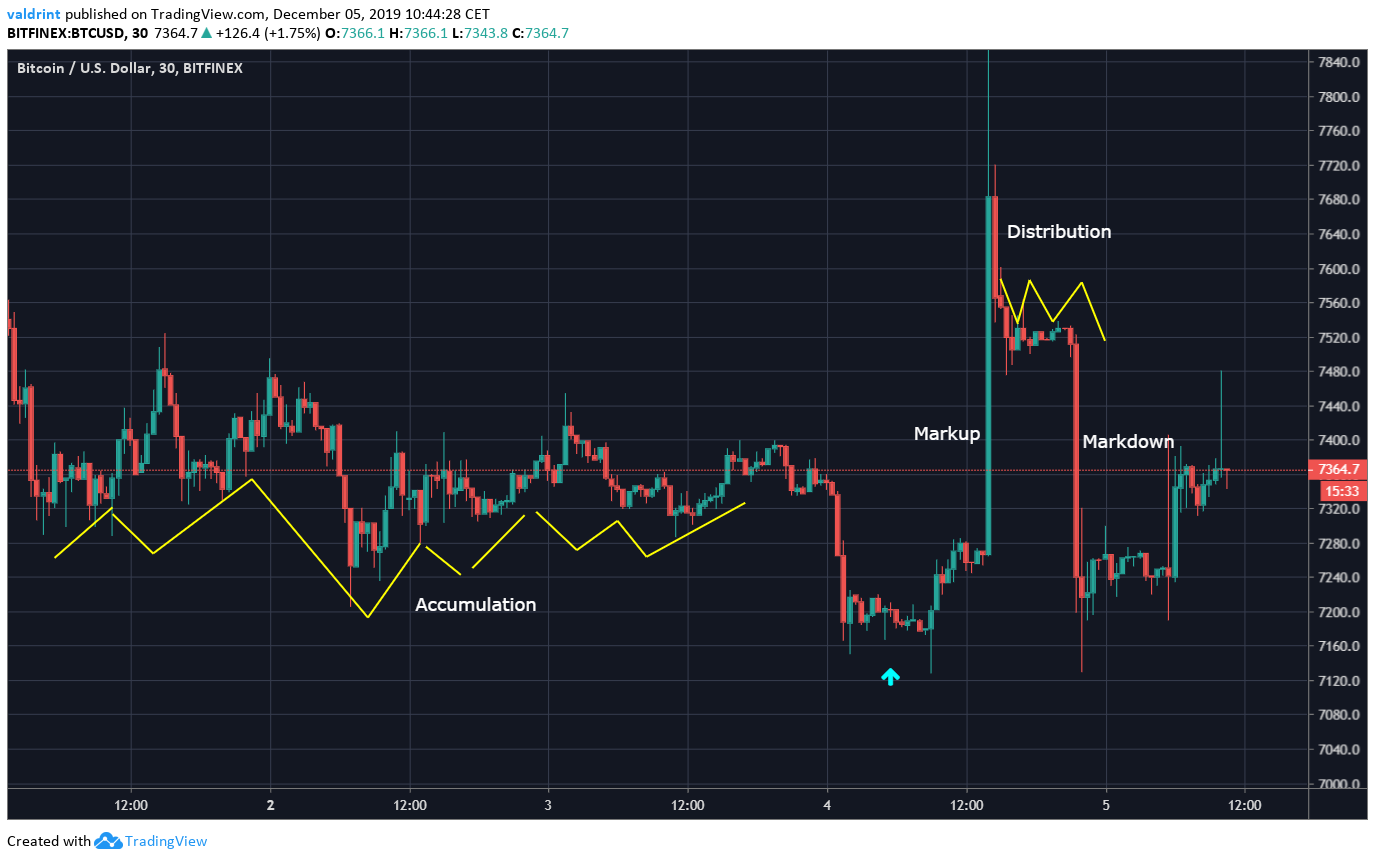
On December 4, the Bitcoin price initiated a rapid upward movement, which could have been caused by a massive transfer of Tether to the OKEx exchange. However, it retraced completely — successfully completing a Bart pattern. The swiftness of the upward move followed by a complete retracement caused many to call for market manipulation.
Another possible explanation for the movement is the creation of the Bart pattern. Full-time trader @coinzada outlined the swiftness of the decrease, suggesting that Bitcoin bulls did not even have a chance to enjoy the pumped prices.
https://twitter.com/coinzada/status/1202330890845773826
What will happen to the price afterward? Will we see a similar pump in the future? Continue reading below and find out.
Short-Term Bitcoin Bart Pattern
The Bart pattern is created when a sudden move in one direction is followed by sideways movement and, subsequently, by another significant move in the other direction. It usually has four phases:- Accumulation
- Markup
- Distribution
- Markdown
 The current pattern was slightly irregular because of the price decrease after the accumulation phase. However, since the lower levels could not be sustained, the Bitcoin price initiated an even more rapid upward movement — successfully completing the ”markup” phase.
Reverse Bart?
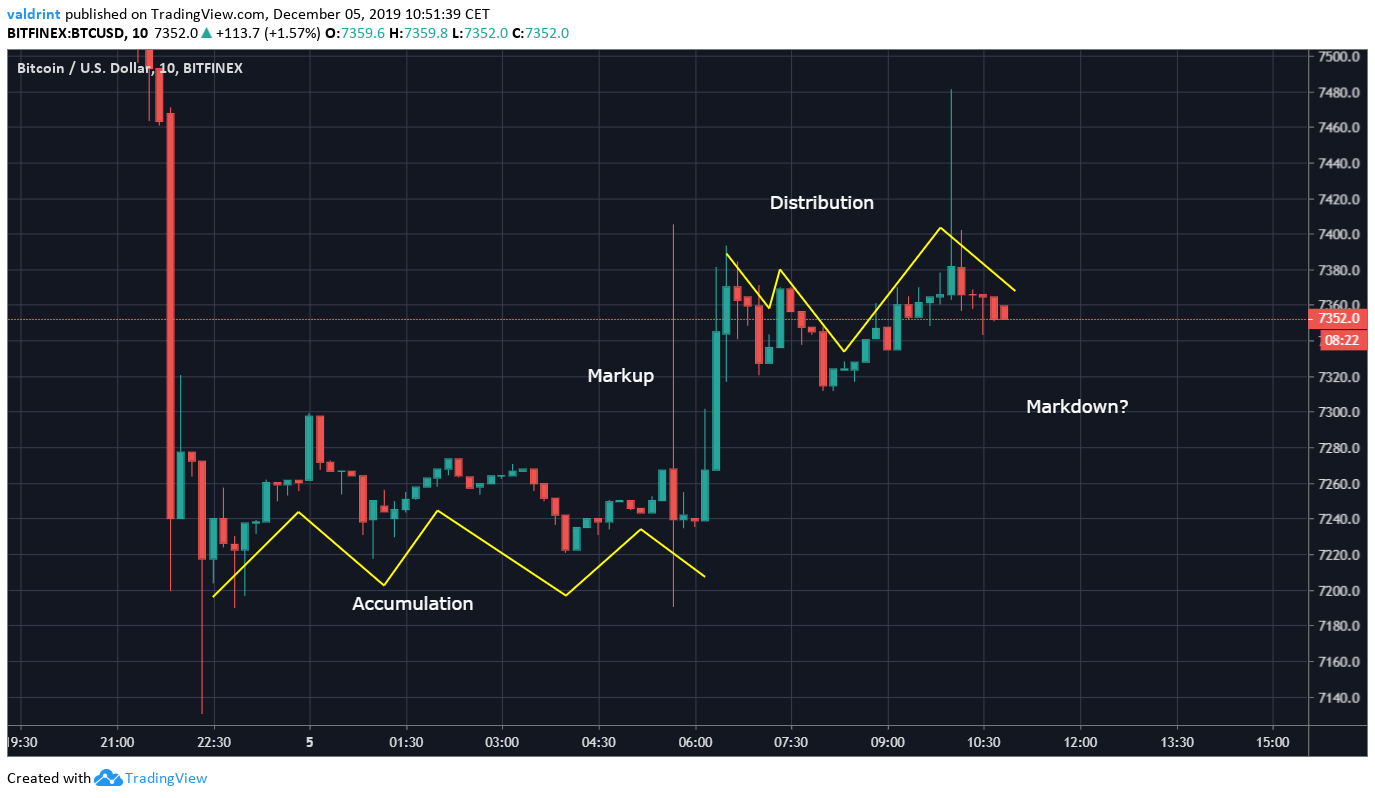
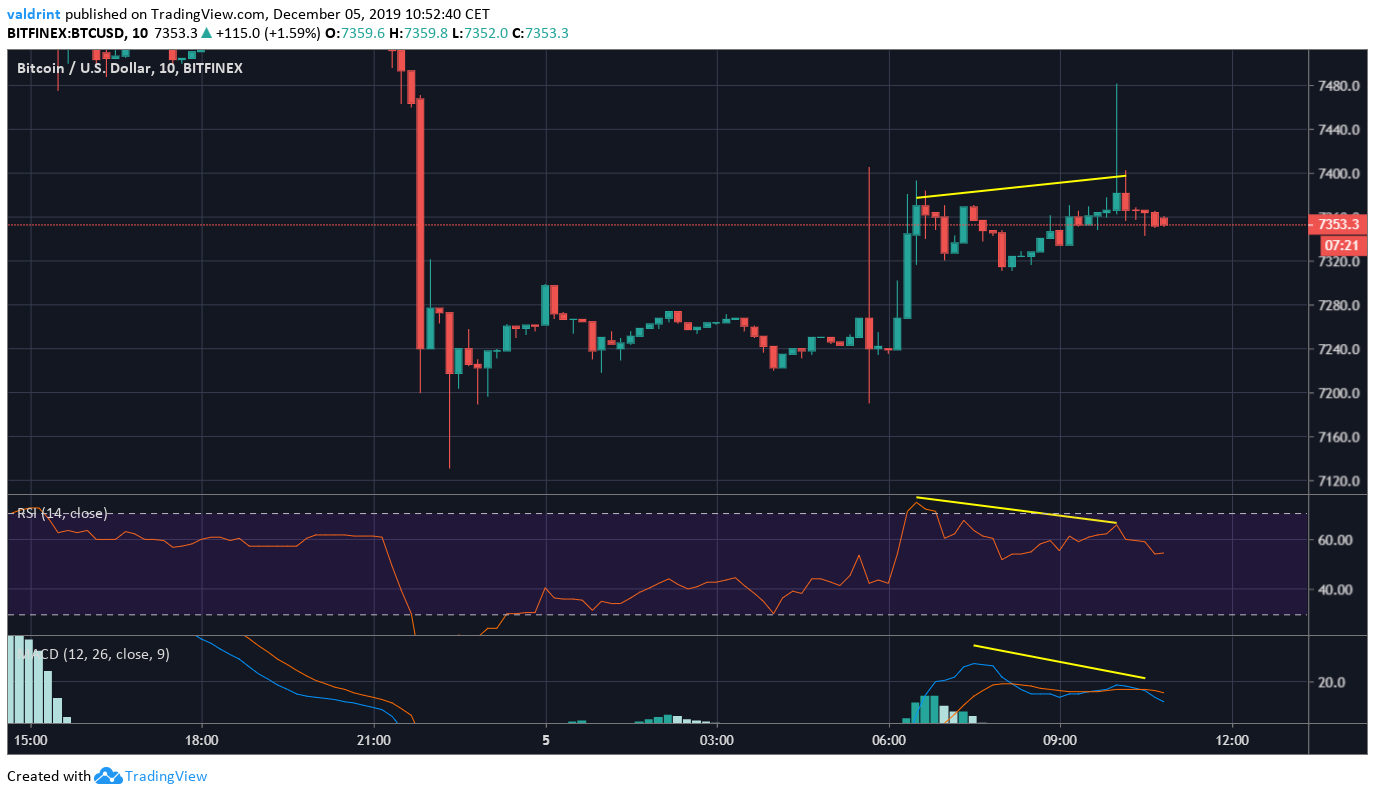
After the markdown phase, there is another possible Bart pattern in development — which is only present in lower time-frames. The Bitcoin price finished the accumulation phase before initiating an upward move towards $7400. There, it created a long upper wick and decreased. What should follow afterwards is the markdown phase towards $7200. This movement is also supported by bearish divergence in both the RSI and the MACD. Even though the divergence is only present in lower time-frames, not being significant enough in itself to predict a breakdown, it gains validity when combined with the pattern.
 To conclude, the Bitcoin price is seemingly creating another Bart pattern, which should cause it to decrease to $7200 or lower. Currently, it has yet to complete the markdown phase.
Disclaimer: This article is not trading advice and should not be construed as such. Always consult a trained financial professional before investing in cryptocurrencies, as the market is particularly volatile.
Disclaimer
In line with the Trust Project guidelines, this price analysis article is for informational purposes only and should not be considered financial or investment advice. BeInCrypto is committed to accurate, unbiased reporting, but market conditions are subject to change without notice. Always conduct your own research and consult with a professional before making any financial decisions. Please note that our Terms and Conditions, Privacy Policy, and Disclaimers have been updated.

Valdrin Tahiri
Valdrin discovered cryptocurrencies while he was getting his MSc in Financial Markets from the Barcelona School of Economics. Shortly after graduating, he began writing for several different cryptocurrency related websites as a freelancer before eventually taking on the role of BeInCrypto's Senior Analyst.
(I do not have a discord and will not contact you first there. Beware of scammers)
READ FULL BIO
Sponsored
Sponsored
![Bitcoin’s Bart Pattern Makes Another Appearance [Premium Analysis]](https://beincrypto.com/wp-content/uploads/2019/01/bic_Bart_Simpson_bitcoin.jpg.optimal.jpg)