


Last week, the Bitcoin price decreased by more than 40% and dropped below its 200-week moving average (MA) as a result. However, the price has reversed this week, making up the majority of the previous losses.
Bitcoin (BTC) Price Highlights
Bitcoin and altcoin trader @davthewave tweeted a BTC chart that compares the current price decrease with that of January 2015. If the fractal holds true, it means that BTC has already reached a bottom and will continue moving upward in the near future.
Breakout. Fractal looking good so far…. pic.twitter.com/Wt0uMUtQJ1
— dave the wave🌊🌓 (@davthewave) March 19, 2020
We previously looked at this fractal in the beginning of the week, prior to yesterday’s breakout. So, since the breakout fits well with the fractal, this seems like a good time to revisit it.
2015 Crash
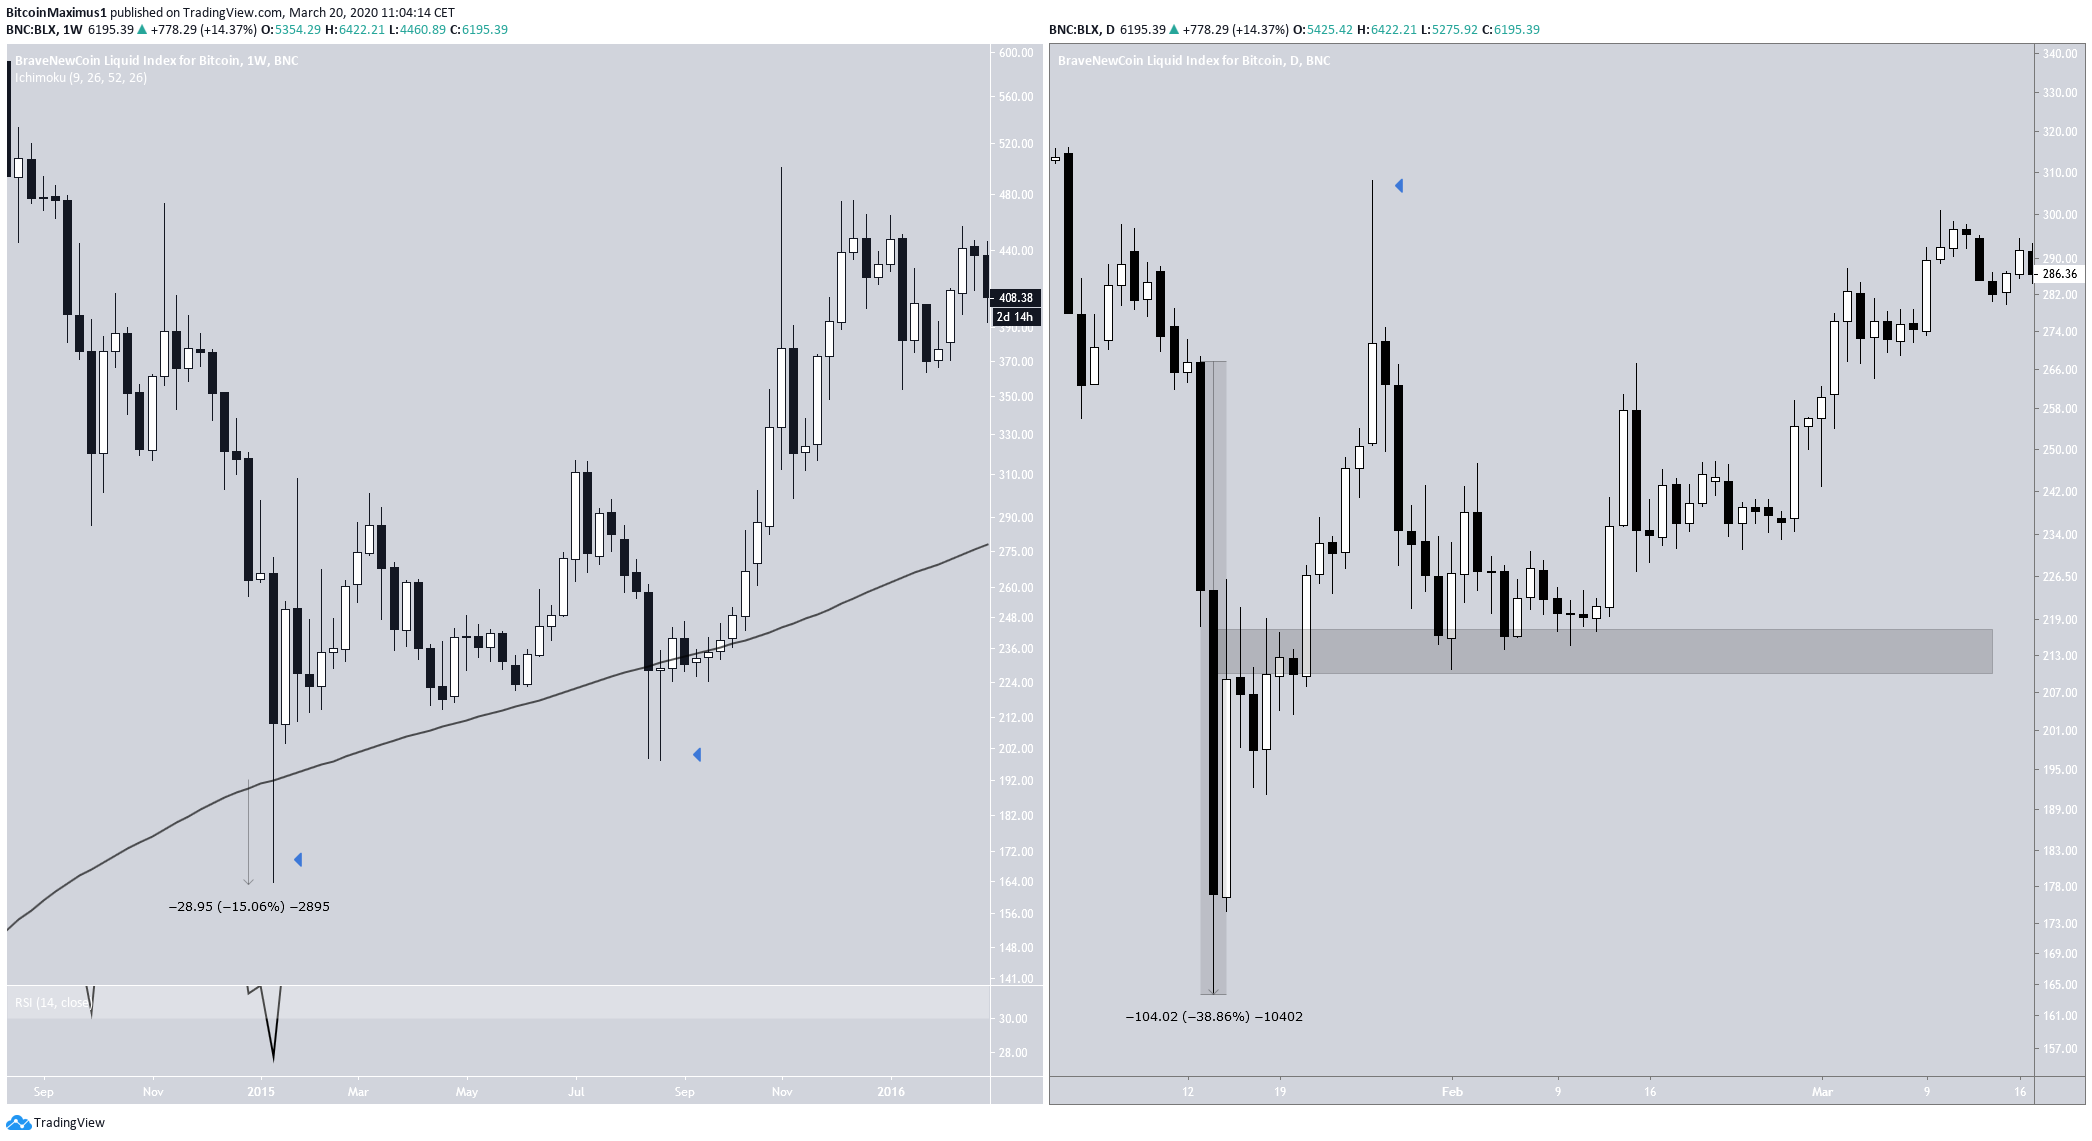
In January 2015, the BTC price reached the 200-week moving average (MA) and bounced above it. While it initially looked as if it was going down, going as much as 15% below it, it proceeded to increase and close above. The weekly RSI during this time was at 26, the lowest level ever recorded.
Looking at the daily chart of the same movement, we can see that the price decreased by almost 40% in a span of only two days. However, the ensuing upward move was very rapid. The price flipped the previous resistance as support, created a strong support area where it eventually made a bottom and continued with its upward movement.
Current Movement
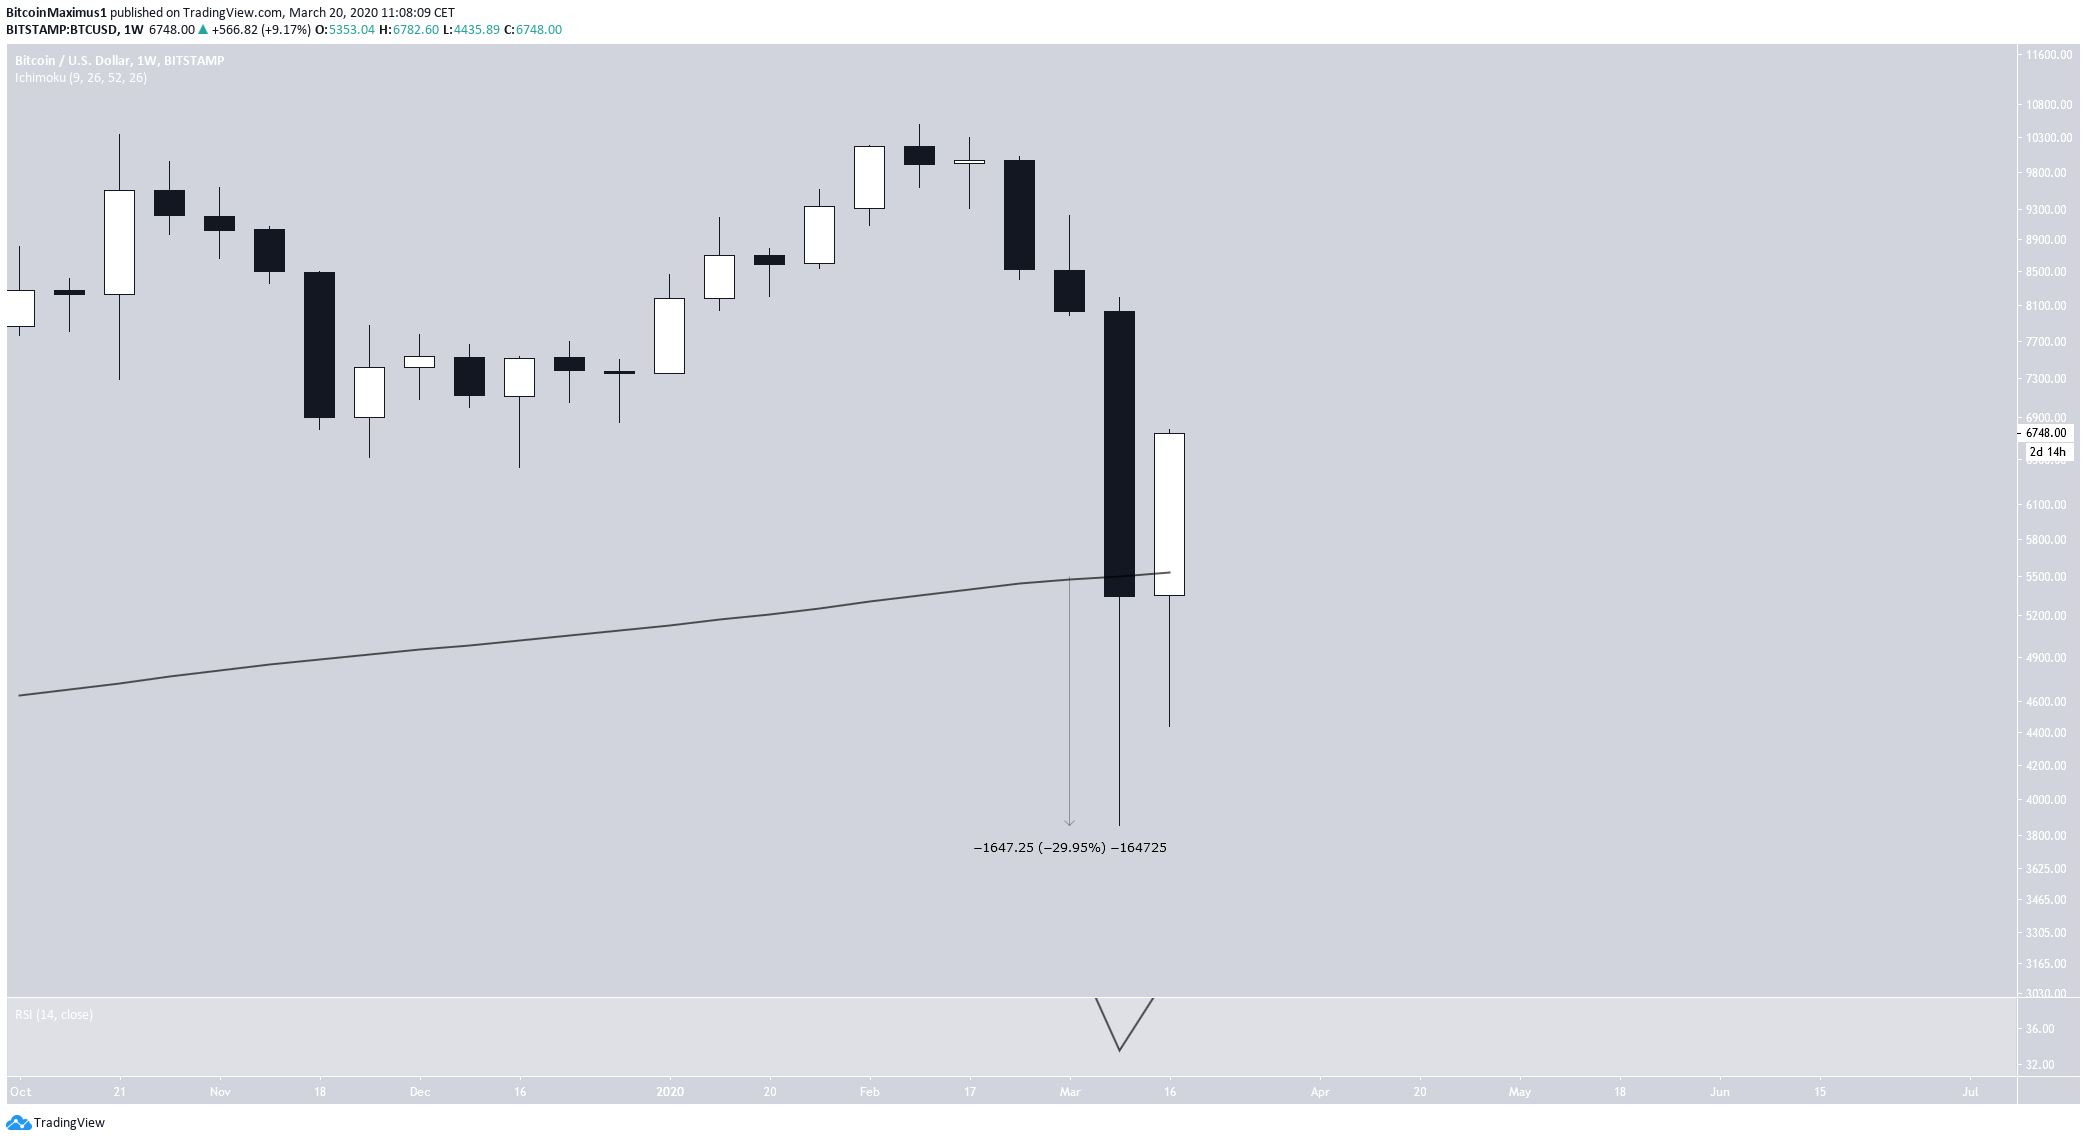
The current downward move was stronger than the one in 2015. The BTC price decreased by a full 30% below the same MA, prior to increasing an reaching a close right at it. While the weekly RSI was not as low as in 2015, it was still almost at oversold levels at 33.
If the fractal continues to hold, the BTC price will increase above $8,000, which is the beginning of the candlestick of the rapid decrease, before dropping sharply and creating a new support area near $5,800.
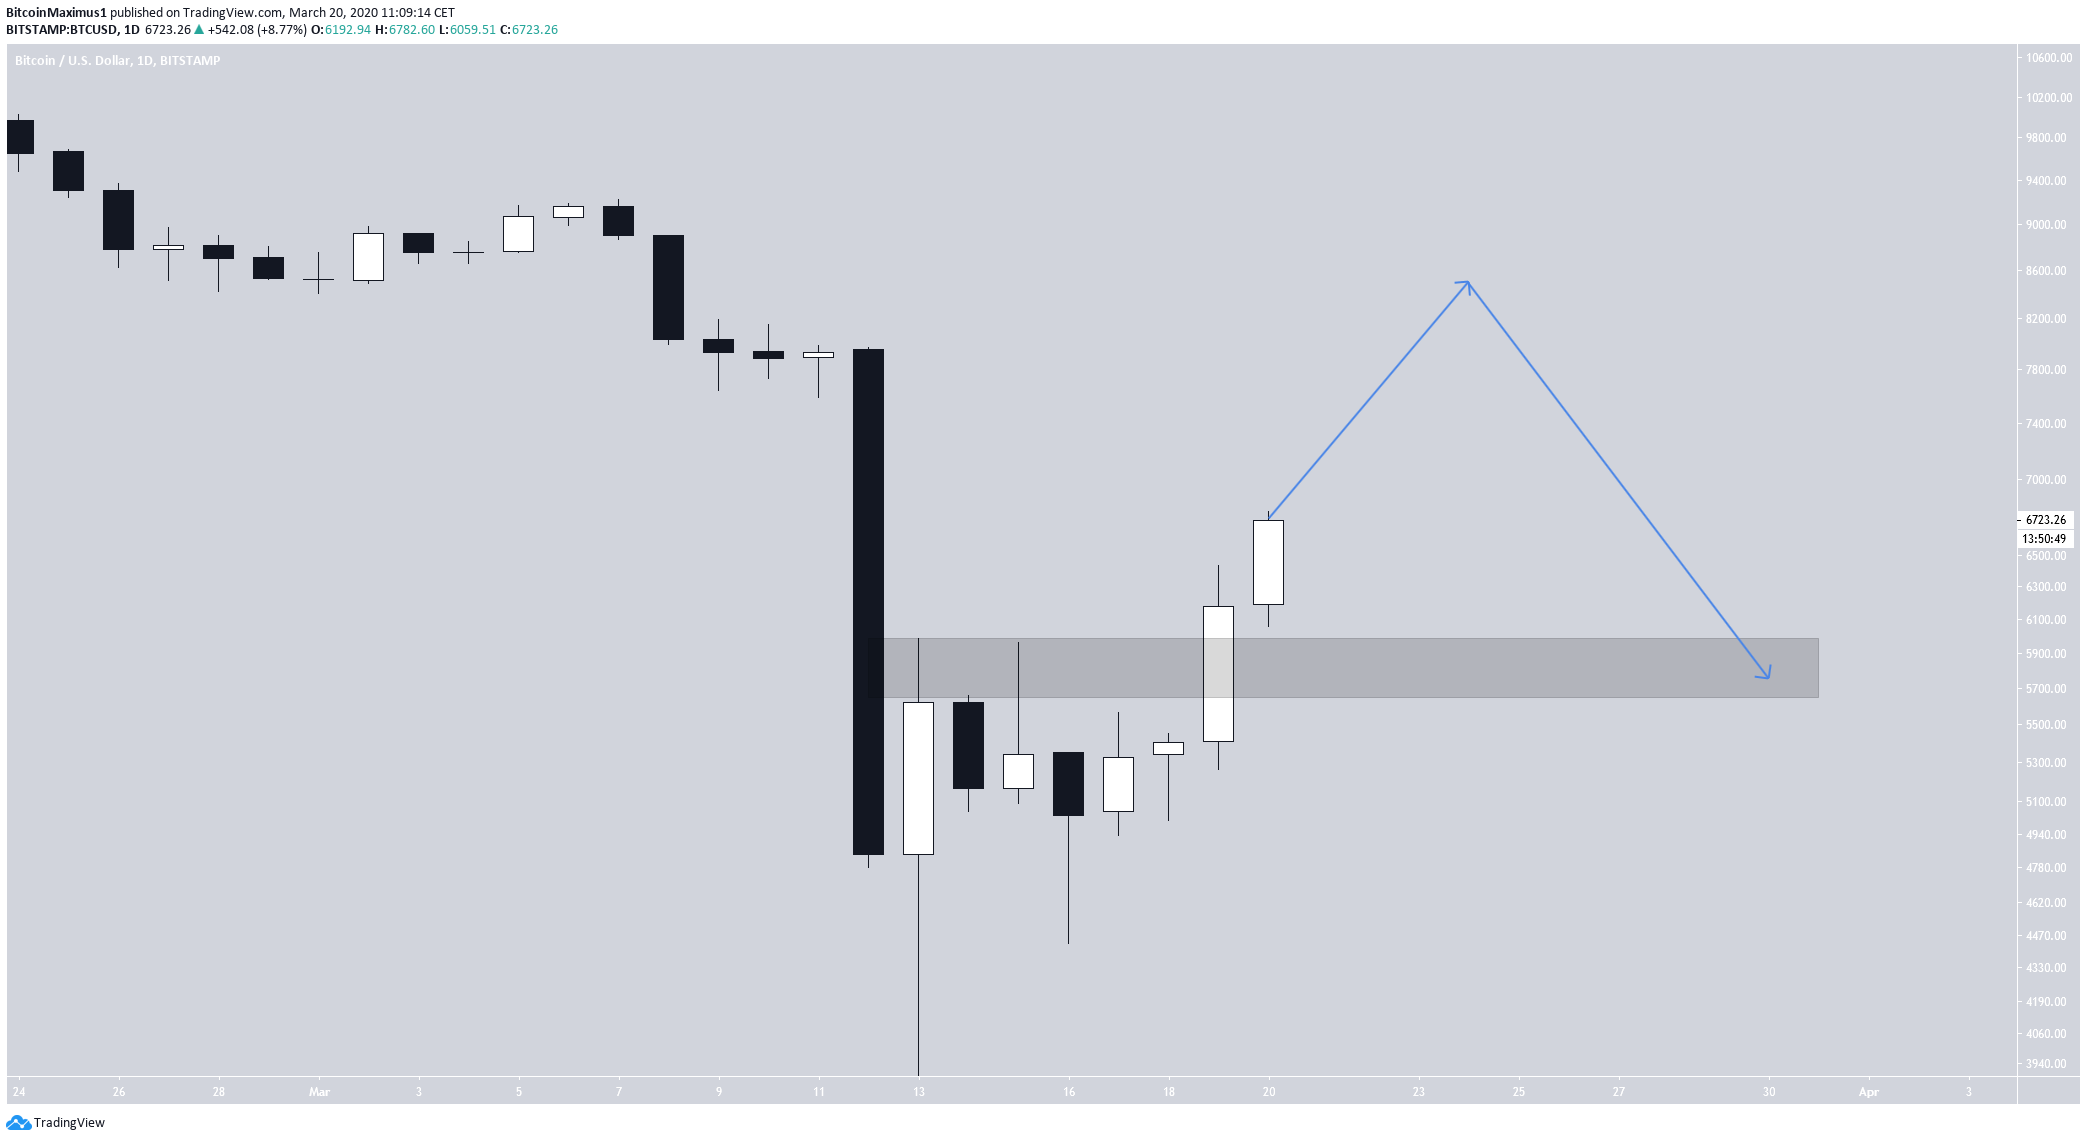
To conclude, the BTC price might be following a fractal from 2015, which suggests that the bottom is already in. If it continues doing so, it is likely to continue moving upward above $8,000 before dropping and creating a support area near $5,800.


