


On March 13, the BTC price reached a low of $4,000 before bouncing upward with strength toward $6,000. Since then, the rally has stalled and BTC has made several lower highs. This movement shares some similarity to the 2015 bottom reached in January.
Bitcoin (BTC) Price Highlights
- The price has decreased below its 200-day moving average (MA).
- The weekly RSI is oversold.
- The price is possibly following a fractal from January 2015.
Bitcoin and altcoin trader @davthewave tweeted a BTC chart comparing the current BTC decrease to that of January 2015. If the fractal holds, it would mean that the BTC price has already reached its low and will soon begin to move upward.
From alts page.
Looking good so far. This chart compares the capitulation of the previous bottom [Jan 2015] to the present one. pic.twitter.com/u7ck6bkPWs
— dave the wave🌊🌓 (@davthewave) March 15, 2020
Let’s take a closer look at the Bitcoin price movement and determine if it has actually reached a low.
January 2015
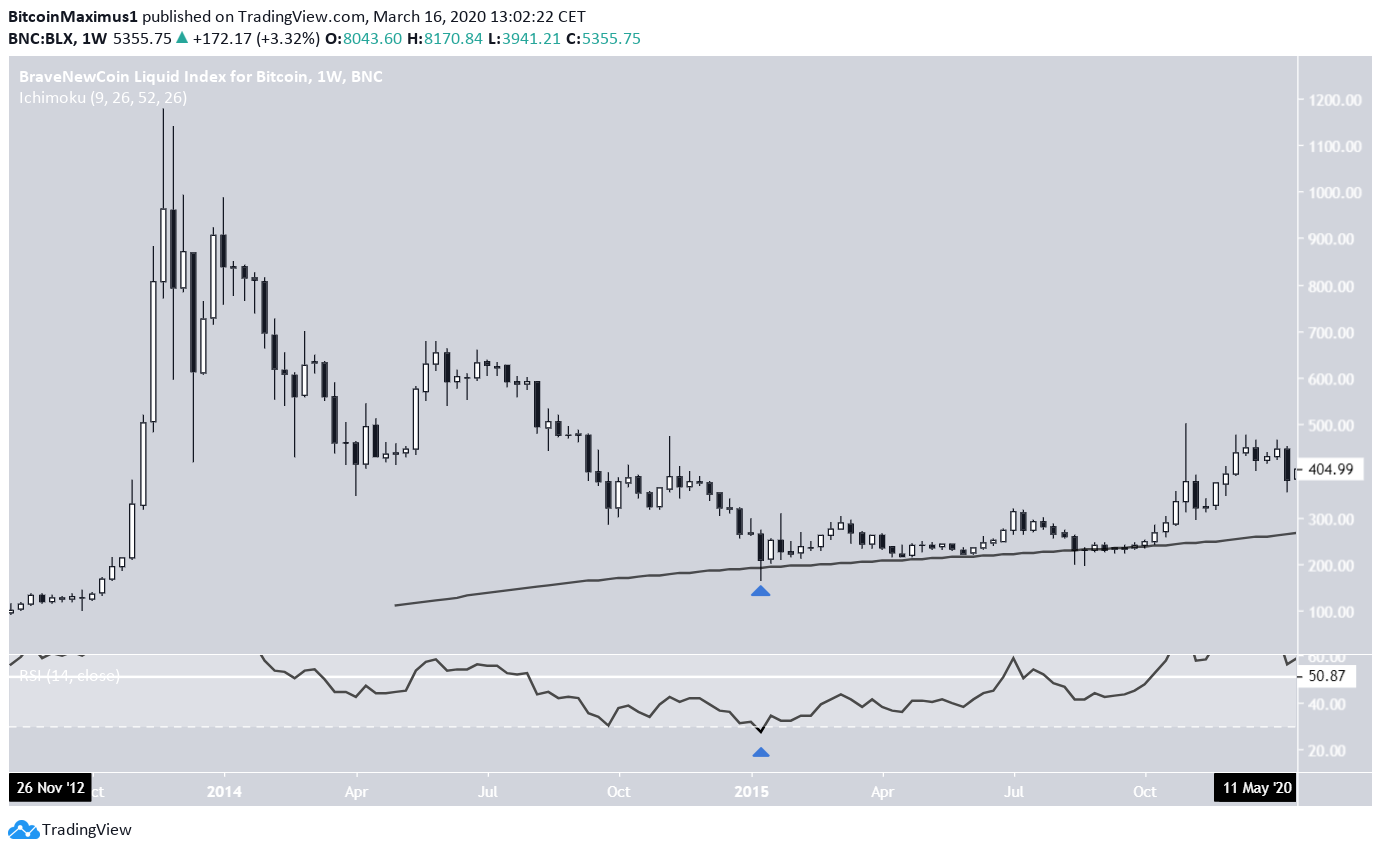
Prior to reaching the $163.88 bottom in January 2015, the price had been down-trending since November 2013, with a high of $1,177.63.
In January, the price bounced at the 200-week moving average (MA). While it initially decreased below it, it proceeded to close above.
In addition, the weekly RSI was at 26, the lowest value ever recorded.
Current Movement
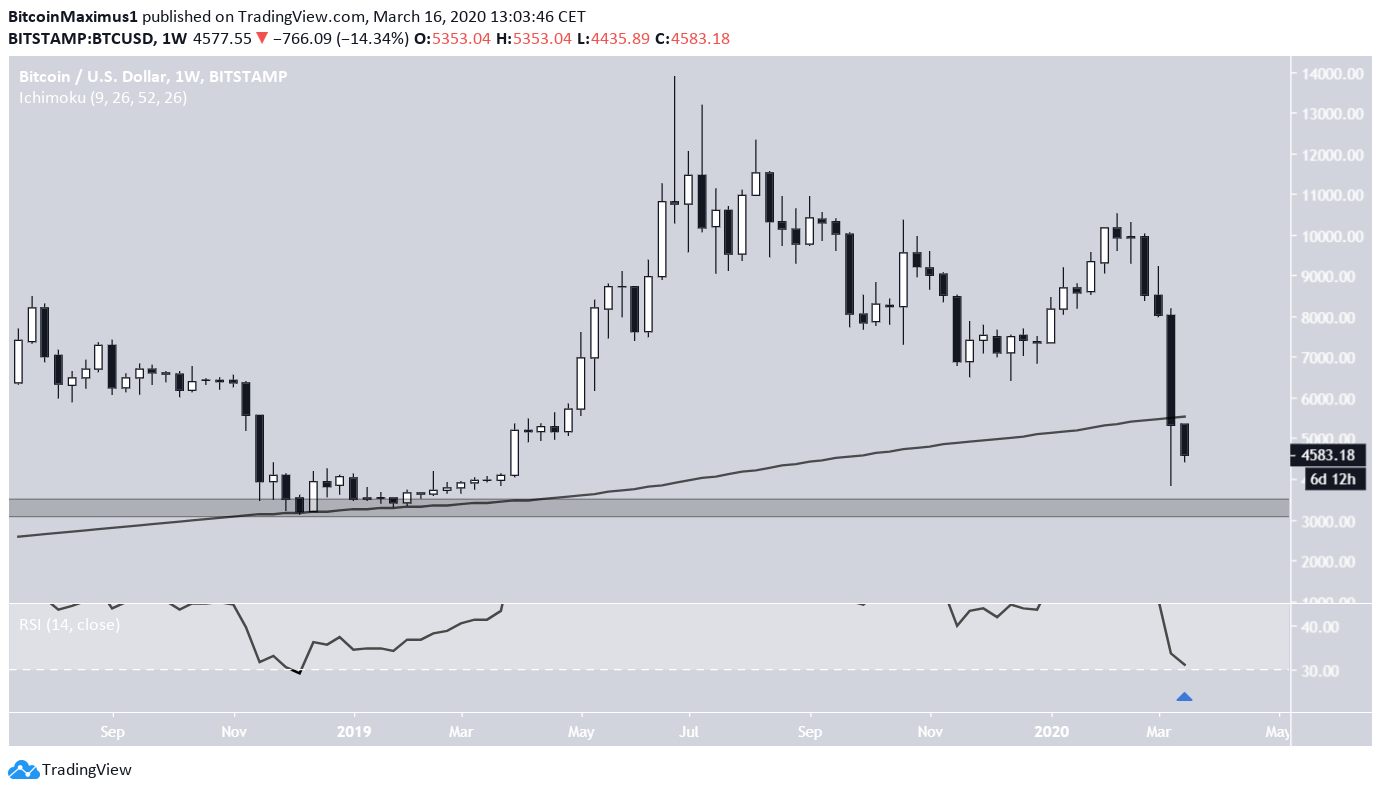
In the current movement, the price has similarly decreased below its 200-week MA but has barely failed to close above it. The price began the current week with another decrease. But, it is technically possible that the price rallies to close above this MA, since there are more than six days left until the closing price.
Similarly, the weekly RSI is oversold at 29, suggesting that a reversal might be nearing.
Similarities
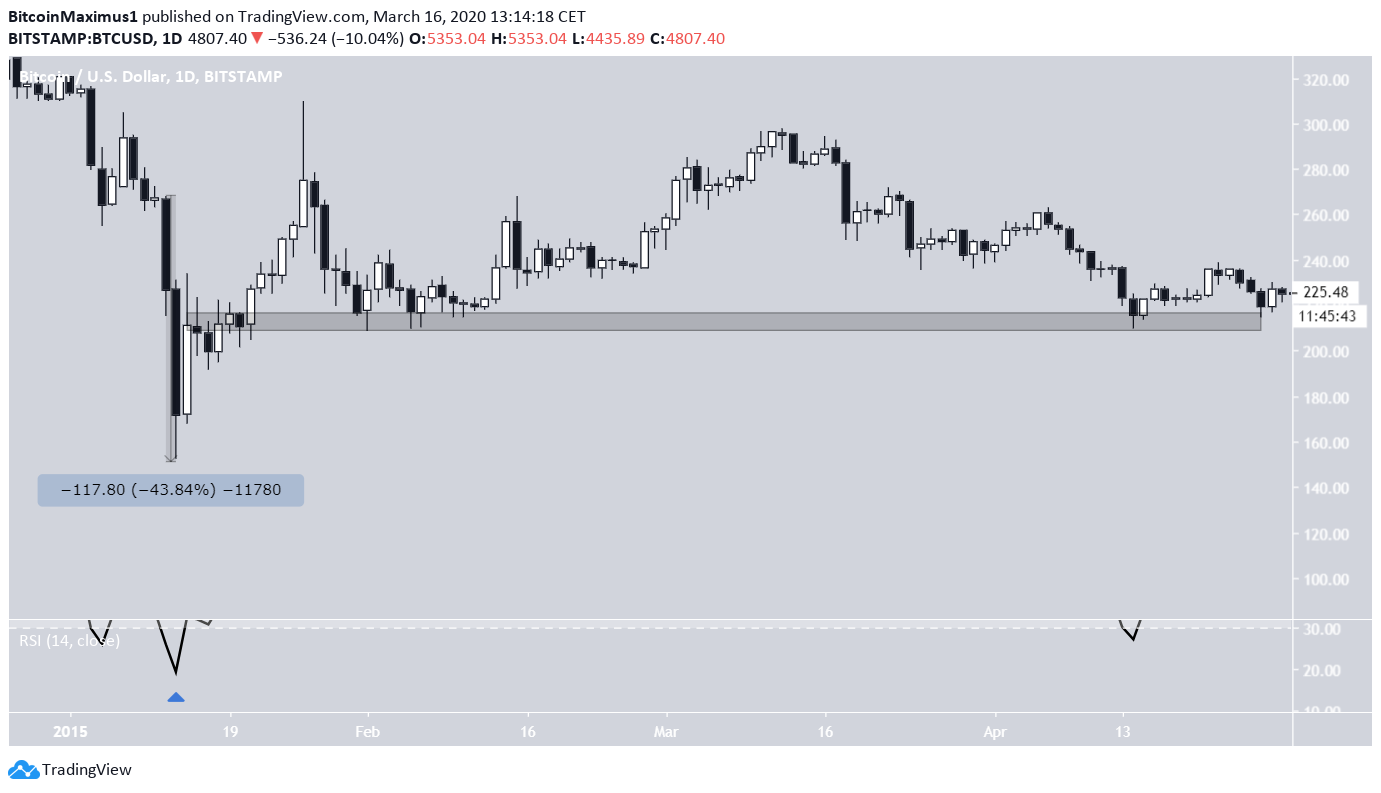
In the 2015 movement, the BTC price decreased by 43% in a span of two days. It proceeded to gradually increase, flipping the previous resistance level as support before accumulating above it. The daily RSI was at 16, a sign of extremely oversold conditions.
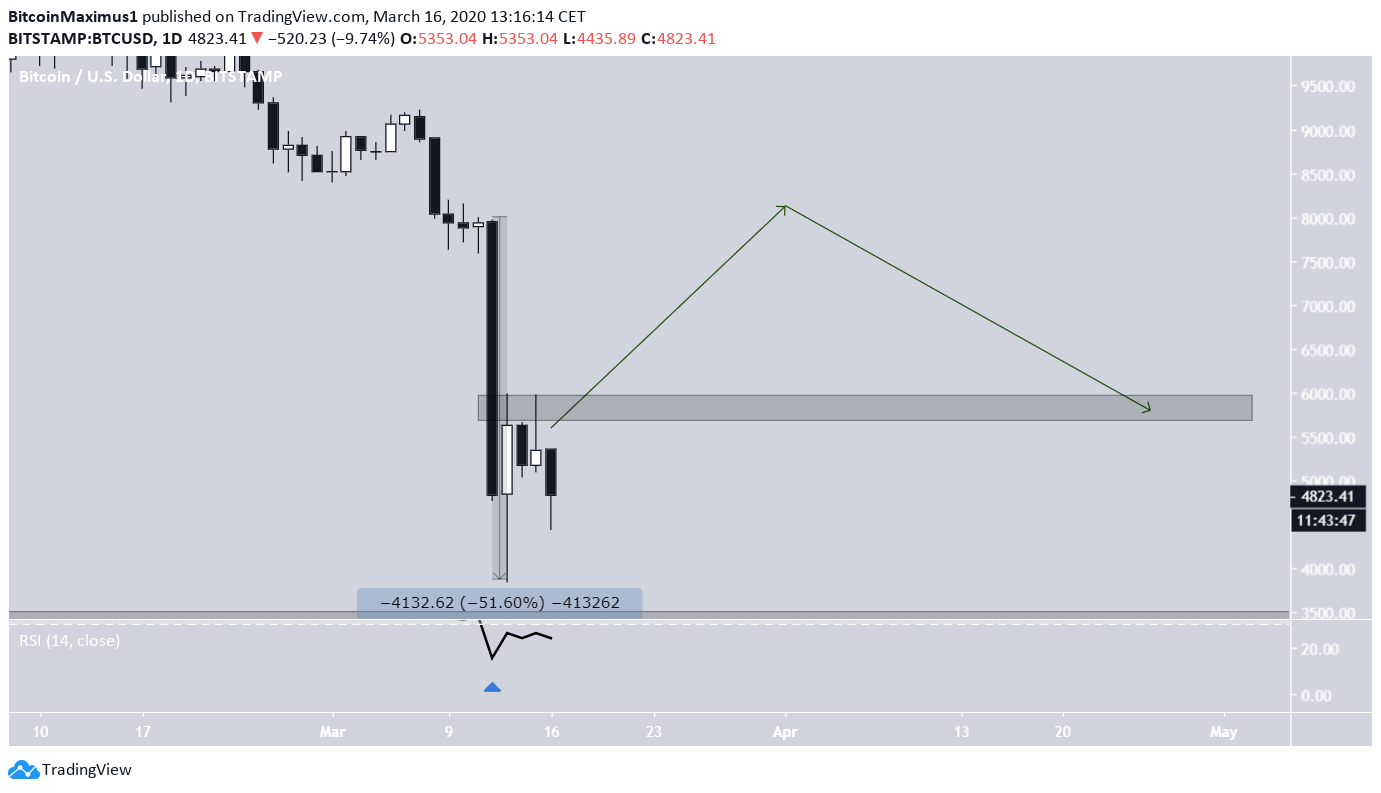
In the current movement, while the BTC price at one point decreased by 53%, it bounced upward and the second daily candlestick was actually bullish. However, the decrease has stalled since. The daily RSI is similarly at 16. If the price were to continue following the fractal, it would soon increase above $6,000 and begin an accumulation period above this area.
To conclude, while not picture perfect fractals of each other, the current BTC price movement and that of January 2015 share numerous similarities. If the fractal continues to hold, the BTC price will soon flip the $6,000 level and begin an accumulation phase above it.


