

The Bitcoin (BTC) price is currently making an attempt at breaking out above the $19,450 resistance area.
While long-term indicators are bullish, lower time-frames have begun to show weakness, suggesting that a short-term drop could occur before Bitcoin moves upwards and breaks out.
Bitcoin Attempts Breakout
On Dec. 15, BTC reached a close of $19,426, the second-highest daily close of the year. This close came in just behind the Dec. 1 close of $19,763 when BTC reached a new all-time high.
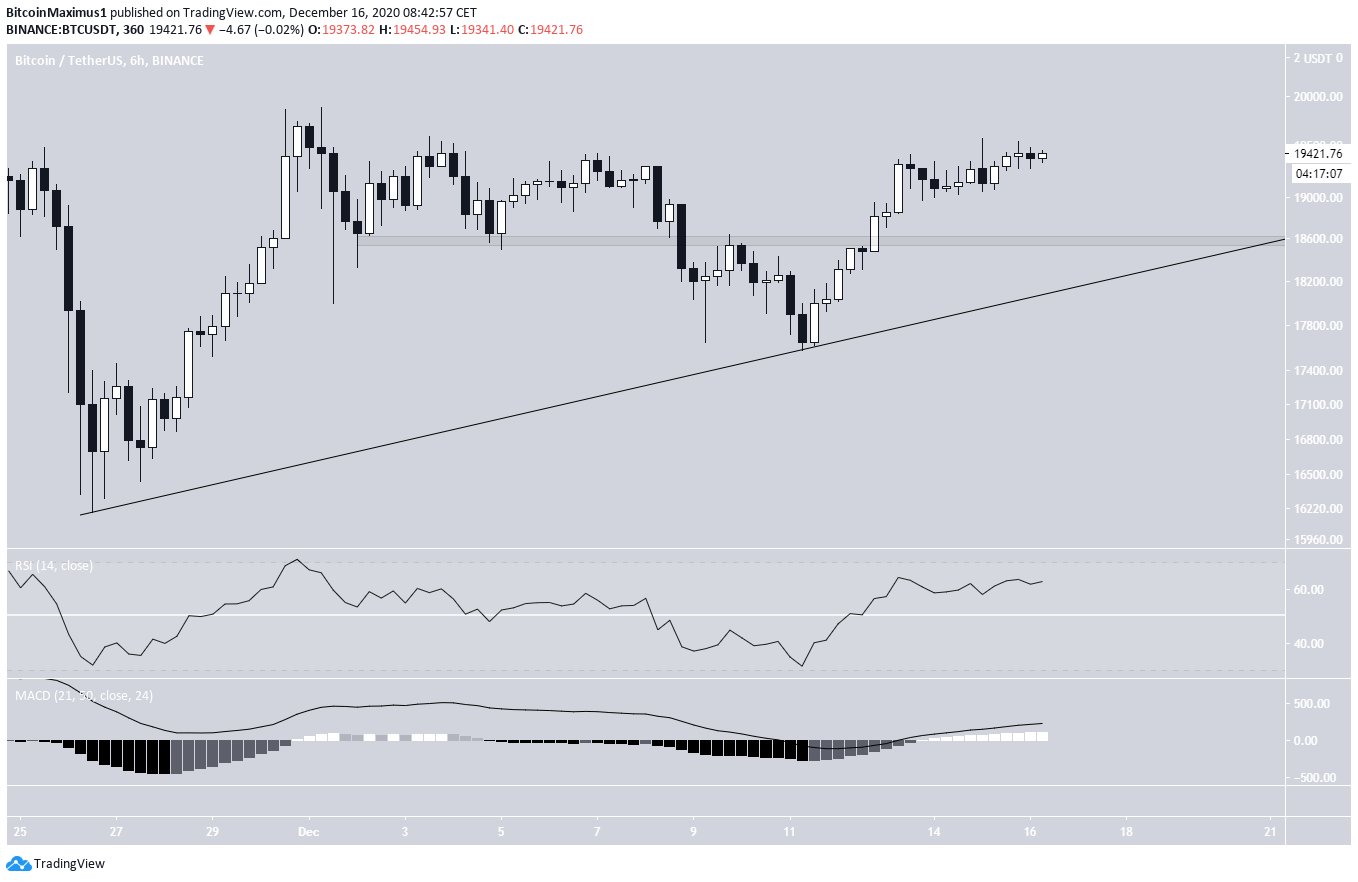
Currently, BTC is trading inside the $19,450 resistance area which has been in place since Nov. 23, In addition, BTC is following an ascending support line which is currently near $18,500.
Technical indicators are mixed but have begun to turn bullish. This is visible in the MACD histogram, which has created its first higher momentum bar since Dec. 1. If it continues increasing today, it would give a likely bullish reversal signal. Furthermore, the Stochastic oscillator has begun to turn upwards.
Therefore, it is possible that BTC will be successful in breaking out above the resistance area, but a closer look at lower time-frames is required to try and confirm this.
In the case of a breakout, BTC would likely move towards the targets outlined in BeInCrypto’s latest Bitcoin wave count article.

Short-Term Movement
A look at the six-hour chart shows that the main support area is found at $18,600. BTC has not returned to validate this support since it first broke out on Dec. 12.
Currently, the area coincides with the previously mentioned ascending support line.
Technical indicators do not yet show any weakness.
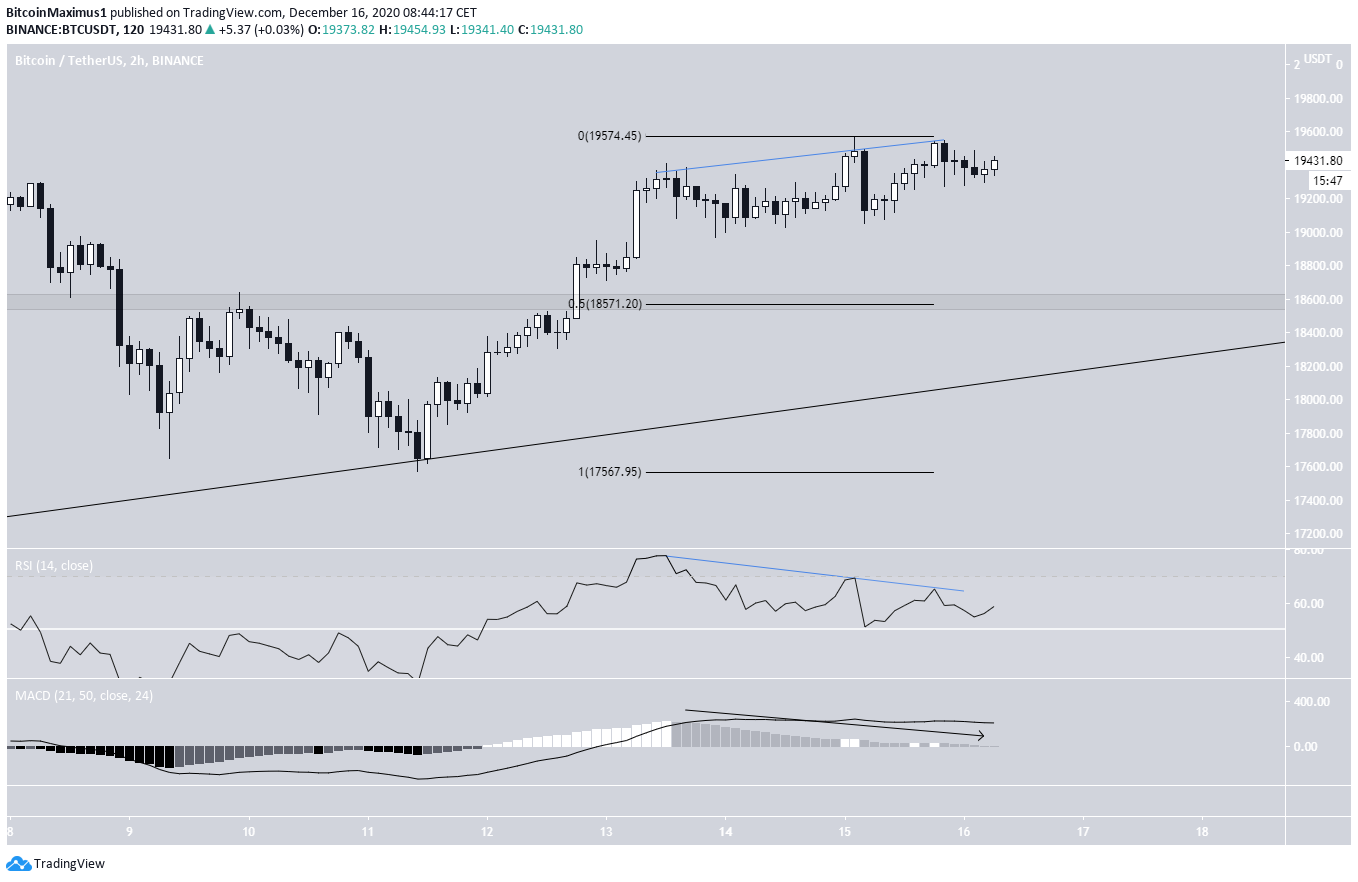
The two-hour chart gives us the first signs of weakness. The RSI has generated a considerable bearish divergence and the MACD has lost its strength.
Therefore, BTC may return to validate the $18,600 area (0.5 Fib retracement level) before eventually moving upwards once more.
Conclusion
Bitcoin is expected to eventually break out from the $19,450 resistance area and reach new highs above $20,000. However, a short-term correction back to $18,600 could occur prior to a breakout.
For BeInCrypto’s previous Bitcoin (BTC) analysis, click here!
Disclaimer: Cryptocurrency trading carries a high level of risk and may not be suitable for all investors. The views expressed in this article do not reflect those of BeInCrypto.
Disclaimer
In line with the Trust Project guidelines, this price analysis article is for informational purposes only and should not be considered financial or investment advice. BeInCrypto is committed to accurate, unbiased reporting, but market conditions are subject to change without notice. Always conduct your own research and consult with a professional before making any financial decisions. Please note that our Terms and Conditions, Privacy Policy, and Disclaimers have been updated.
