


“Black Monday.” That is what the broader market termed Bitcoin’s (BTC) price correction from $58,000 to $49,000 on August 5. For experienced players who have seen the bull and bear of different cycles, that incident was not surprising.
While the event caused a plethora of large-scale liquidations, participants may wonder whether that was the worst one-day correction. This on-chain analysis gives more context to this thought.
Bitcoin Not Overvalued Yet, Future Gains Possible
To answer this question, BeInCrypto looks at key metrics that have repeatedly been recognized as crucial to BTC. One of them is the Market Value to Realized Value (MVRV) ratio. The MVRV ratio offers insights into the profitability of the market.
A spike in the ratio suggests that Bitcoin holders have a good level of unrealized gains, suggesting a higher probability of selling. However, when the ratio decreases, profits reduce, and holders have a lower chance of selling.
Historically, this metric also tells when Bitcoin is undervalued, overvalued, and close to the peak of the cycle. At press time, data from IntoTheBlock shows that the MVRV Ratio is 1.76.
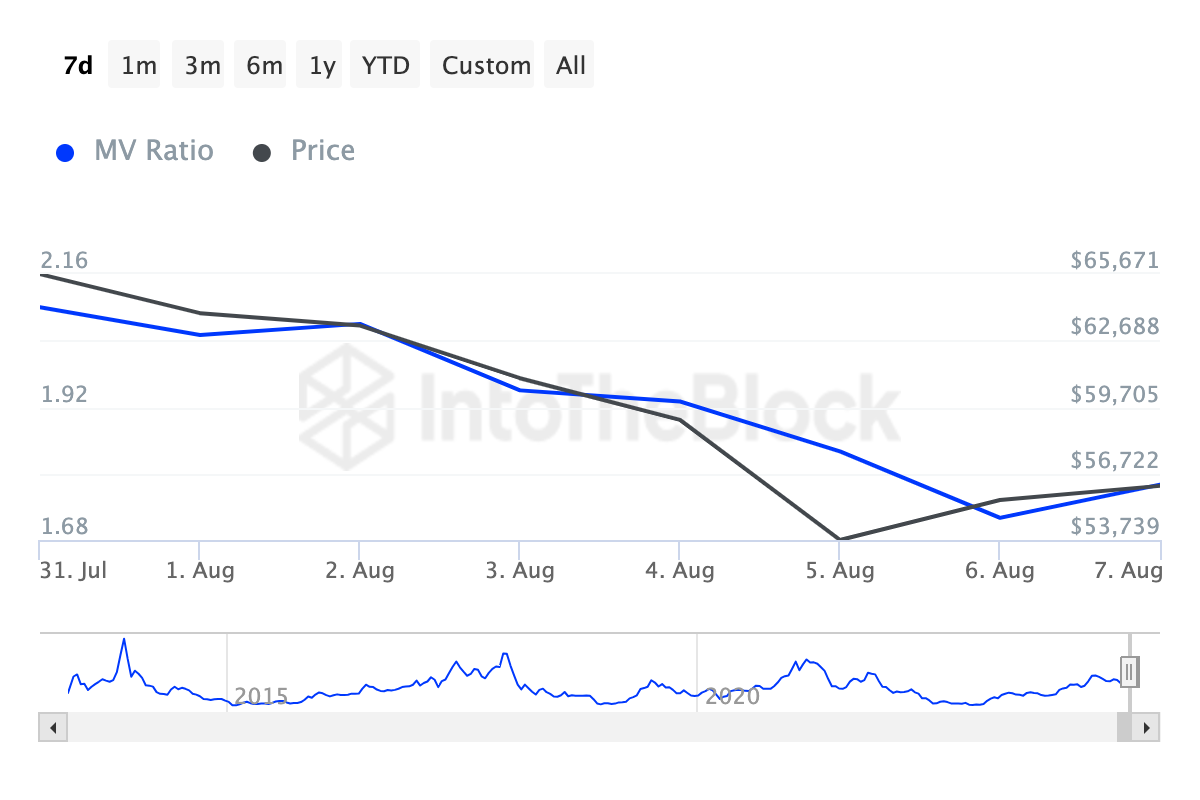
In past cycles, the ratio reached a higher reading than the bull market can be termed “over.”. However, despite BTC’s impressive price performance at some point, the metric shows that the price has not reached its peak.
Putting it into context, Juan Pellicer, Senior Researcher at IntoTheBlock, explained that BTC, like other cryptocurrencies, is yet to reach an overvalued point.
“Most assets have yet to approach their historic overvaluation ranges. For example, Bitcoin’s highest MVRV this year peaked at around 2.64, whereas in the previous cycle, it reached as high as 3.68. For many altcoins, the difference is even larger.” Pellicer told BeInCrypto
Based on this comment and the historical analysis above, BTC’s recent decline is likely a discount. At press time, the coin trades at $57,255. This price means that it is still 22.37% down from the all-time high (ATH) it reached in March.
Retail Investors Hesitant, But There’s a Way Out
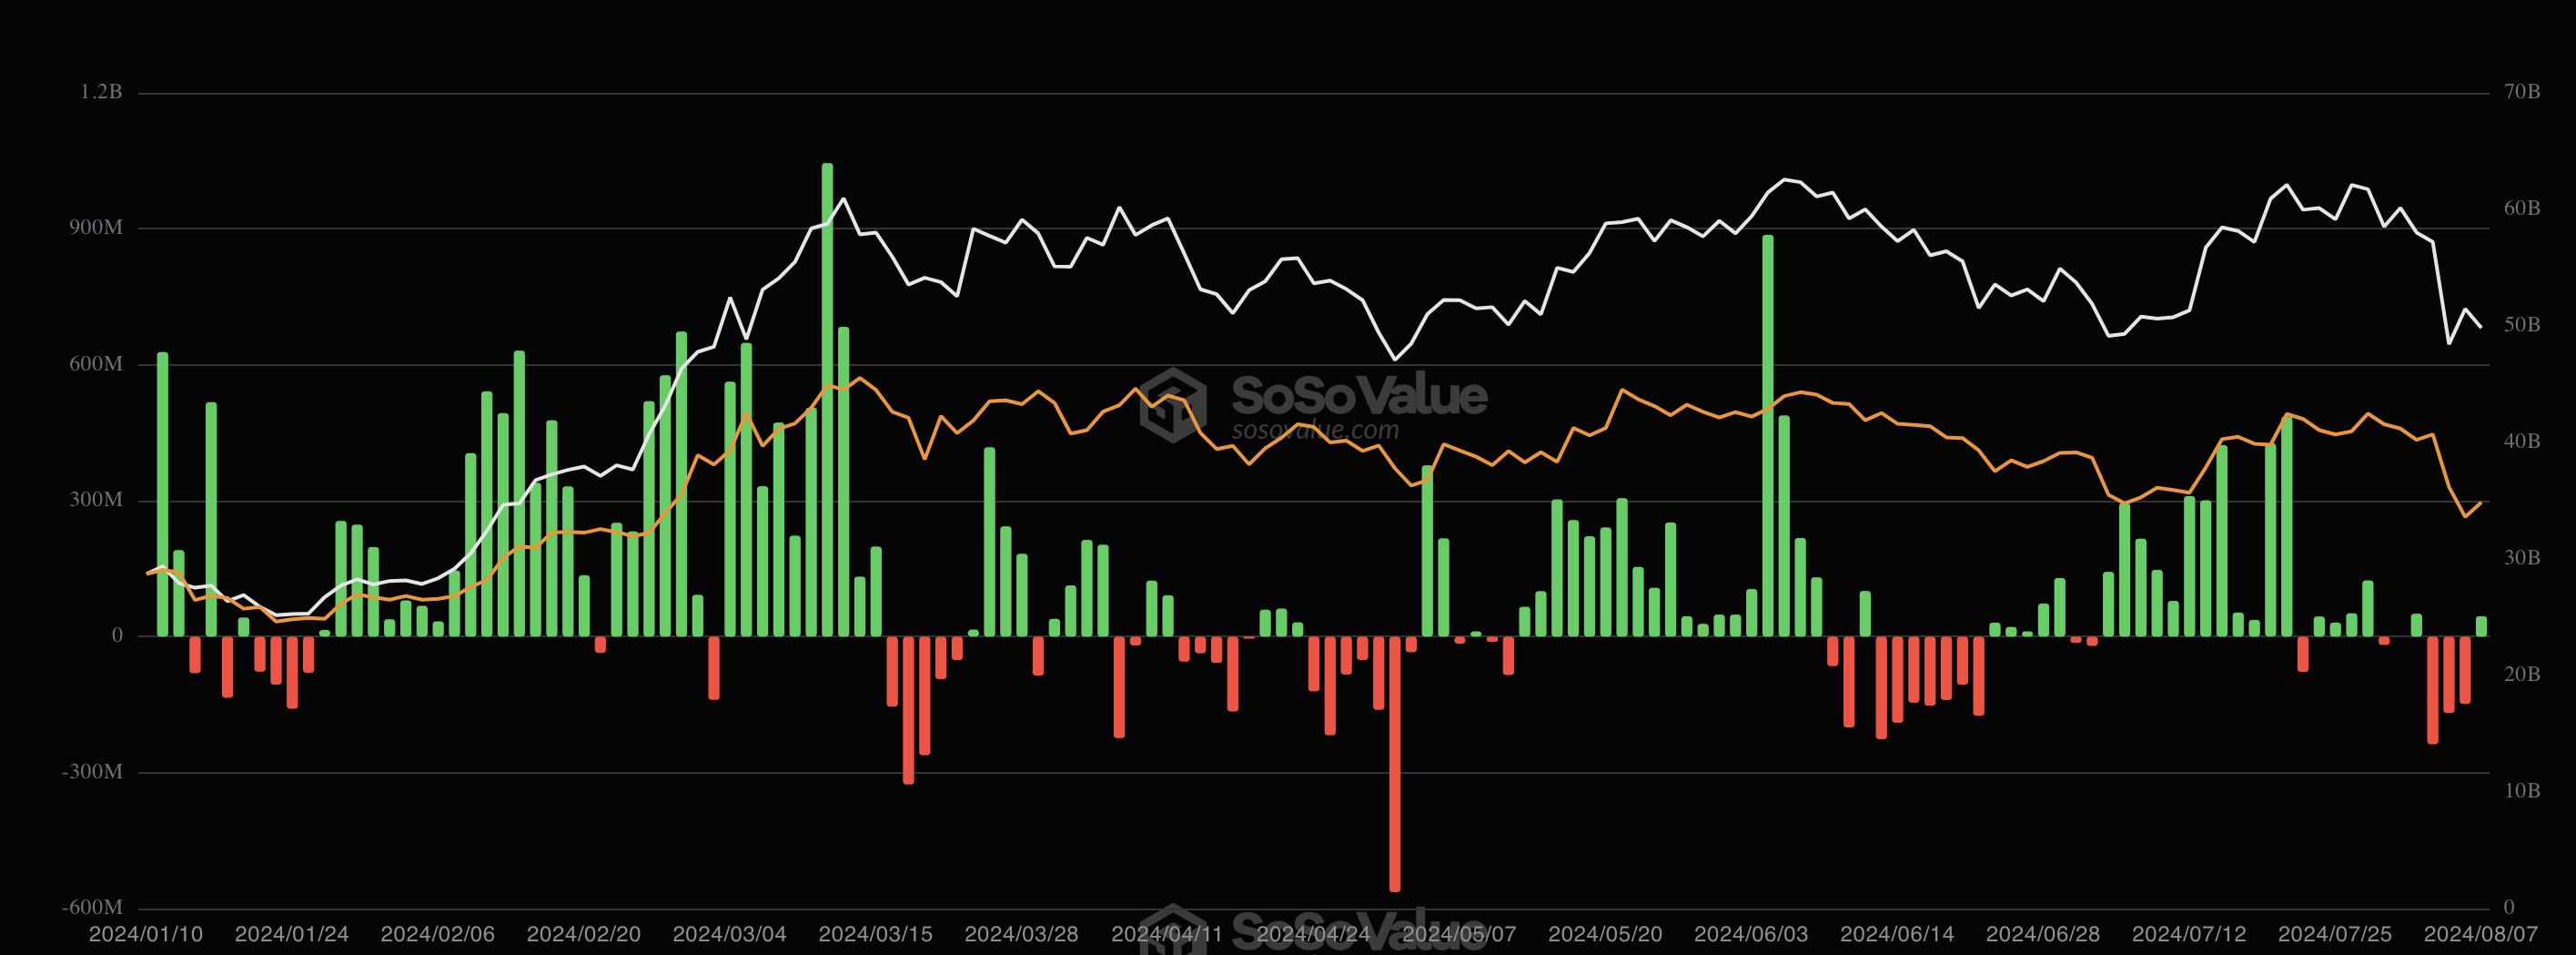
It is worth noting that institutional investors were the main driver of the rally to a new ATH through the Bitcoin ETFs. It is also important to mention that once the ETF netflow began to dry up, BTC price faced a notable decline.
In fact, amid the flash crash on August 5, netflows of the ETFs were negative. However, recent data shows that this may no longer be the case. This is because of the $45 million total daily netflow recorded on August 7.
When compared to previous net positive flows, this is a low figure. At the same time, it could serve as the beginning of Bitcoin’s price stability, provided it is sustained.
Read More: What Is a Bitcoin ETF?
Should this be the case, this worst could be over for BTC, and the price may not drop below $50,000 again for a while.
Furthermore, Bitcoin’s potential does not lie solely in the capital these institutions have. Recall that, in previous bull markets, the coin did not have this kind of institutional adoption.
However, the coin has not experienced anything close to the kind of retail participation it had in the 2017 and 2021 market boom. During our conversation, Pellicer also weighed in on this, saying that:
“The number of active addresses on Bitcoin has been trending down since November 2023. This is typically a bearish sign for the entire market, as new participants in the Bitcoin market can serve as a proxy for new entrants to the industry.”
On several occasions, BeInCrypto noticed that a good level of retail interaction with BTC begins when the number of active addresses is over one million. But, according to Santiment, the metric has struggled to reach this region since March.
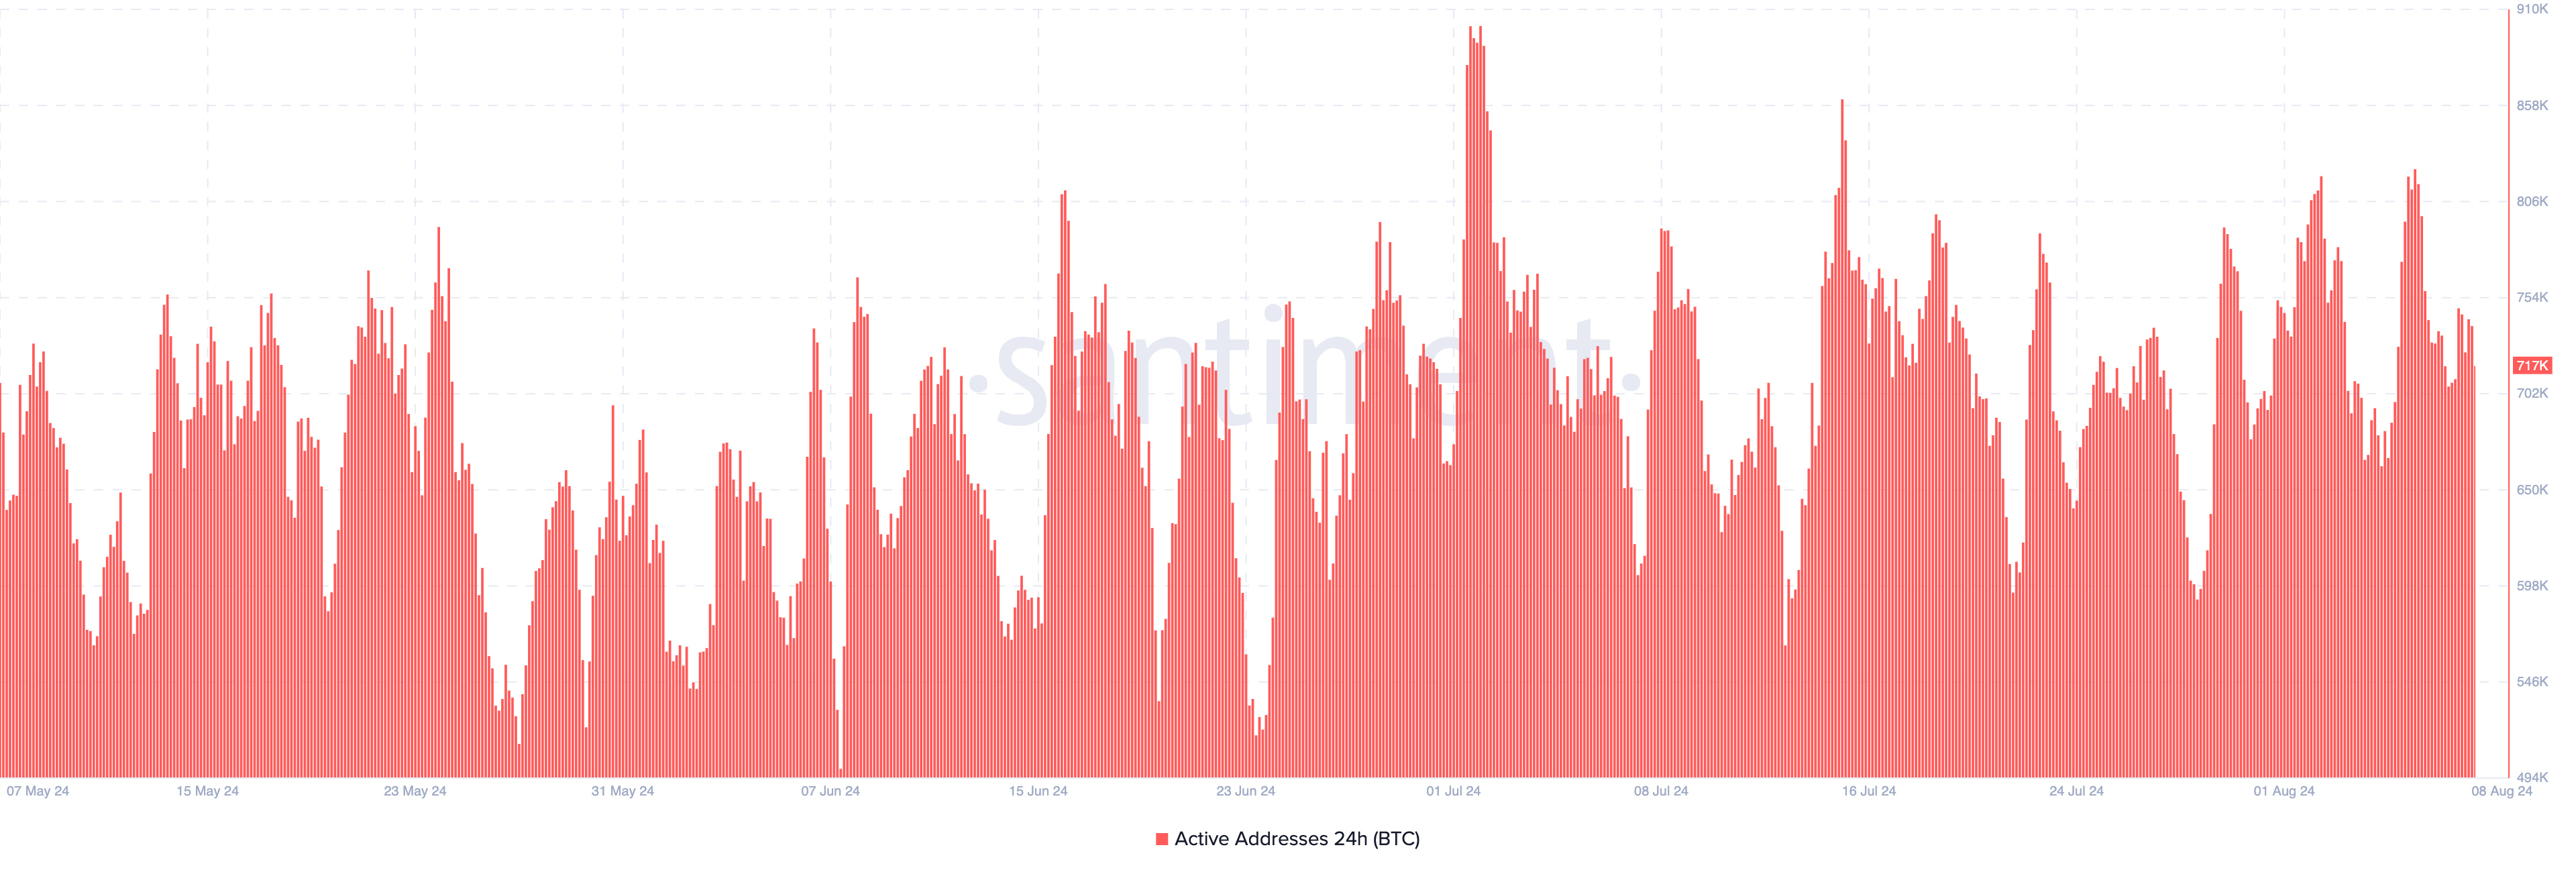
However, on-chain shows an uptick in active addresses as it notched 717,000 at press time. If this metric continues to jump, then BTC’s price may slowly move upwards, erasing the chunk of losses it has had in recent times.
BTC Price Prediction: Bulls Want $60,000 First
From a technical perspective, Bitcoin may not experience such a massive price drop in the short term. This is because of the signals shown by the Balance of Power (BoP), a technical tool used to measure the strength of buying and selling in the market.
If it is negative, it means selling pressure is intense. However, at press time, it is positive, indicating that market participants are buying the coin. If this continues, BTC may note an uptick that may cost close to $60,000.
Additionally, the Bollinger Bands (BB) provide insight into the volatility around the coin. In simple terms, the BB shows how rapid price fluctuations may occur and tells if a coin is overbought or oversold.
When the indicator’s upper band hits the price, it is overbought. But when it touches the lower band, it is oversold. The image below shows that BTC was oversold on August 7, when the price was $54,594.
Read More: Bitcoin Halving History: Everything You Need To Know
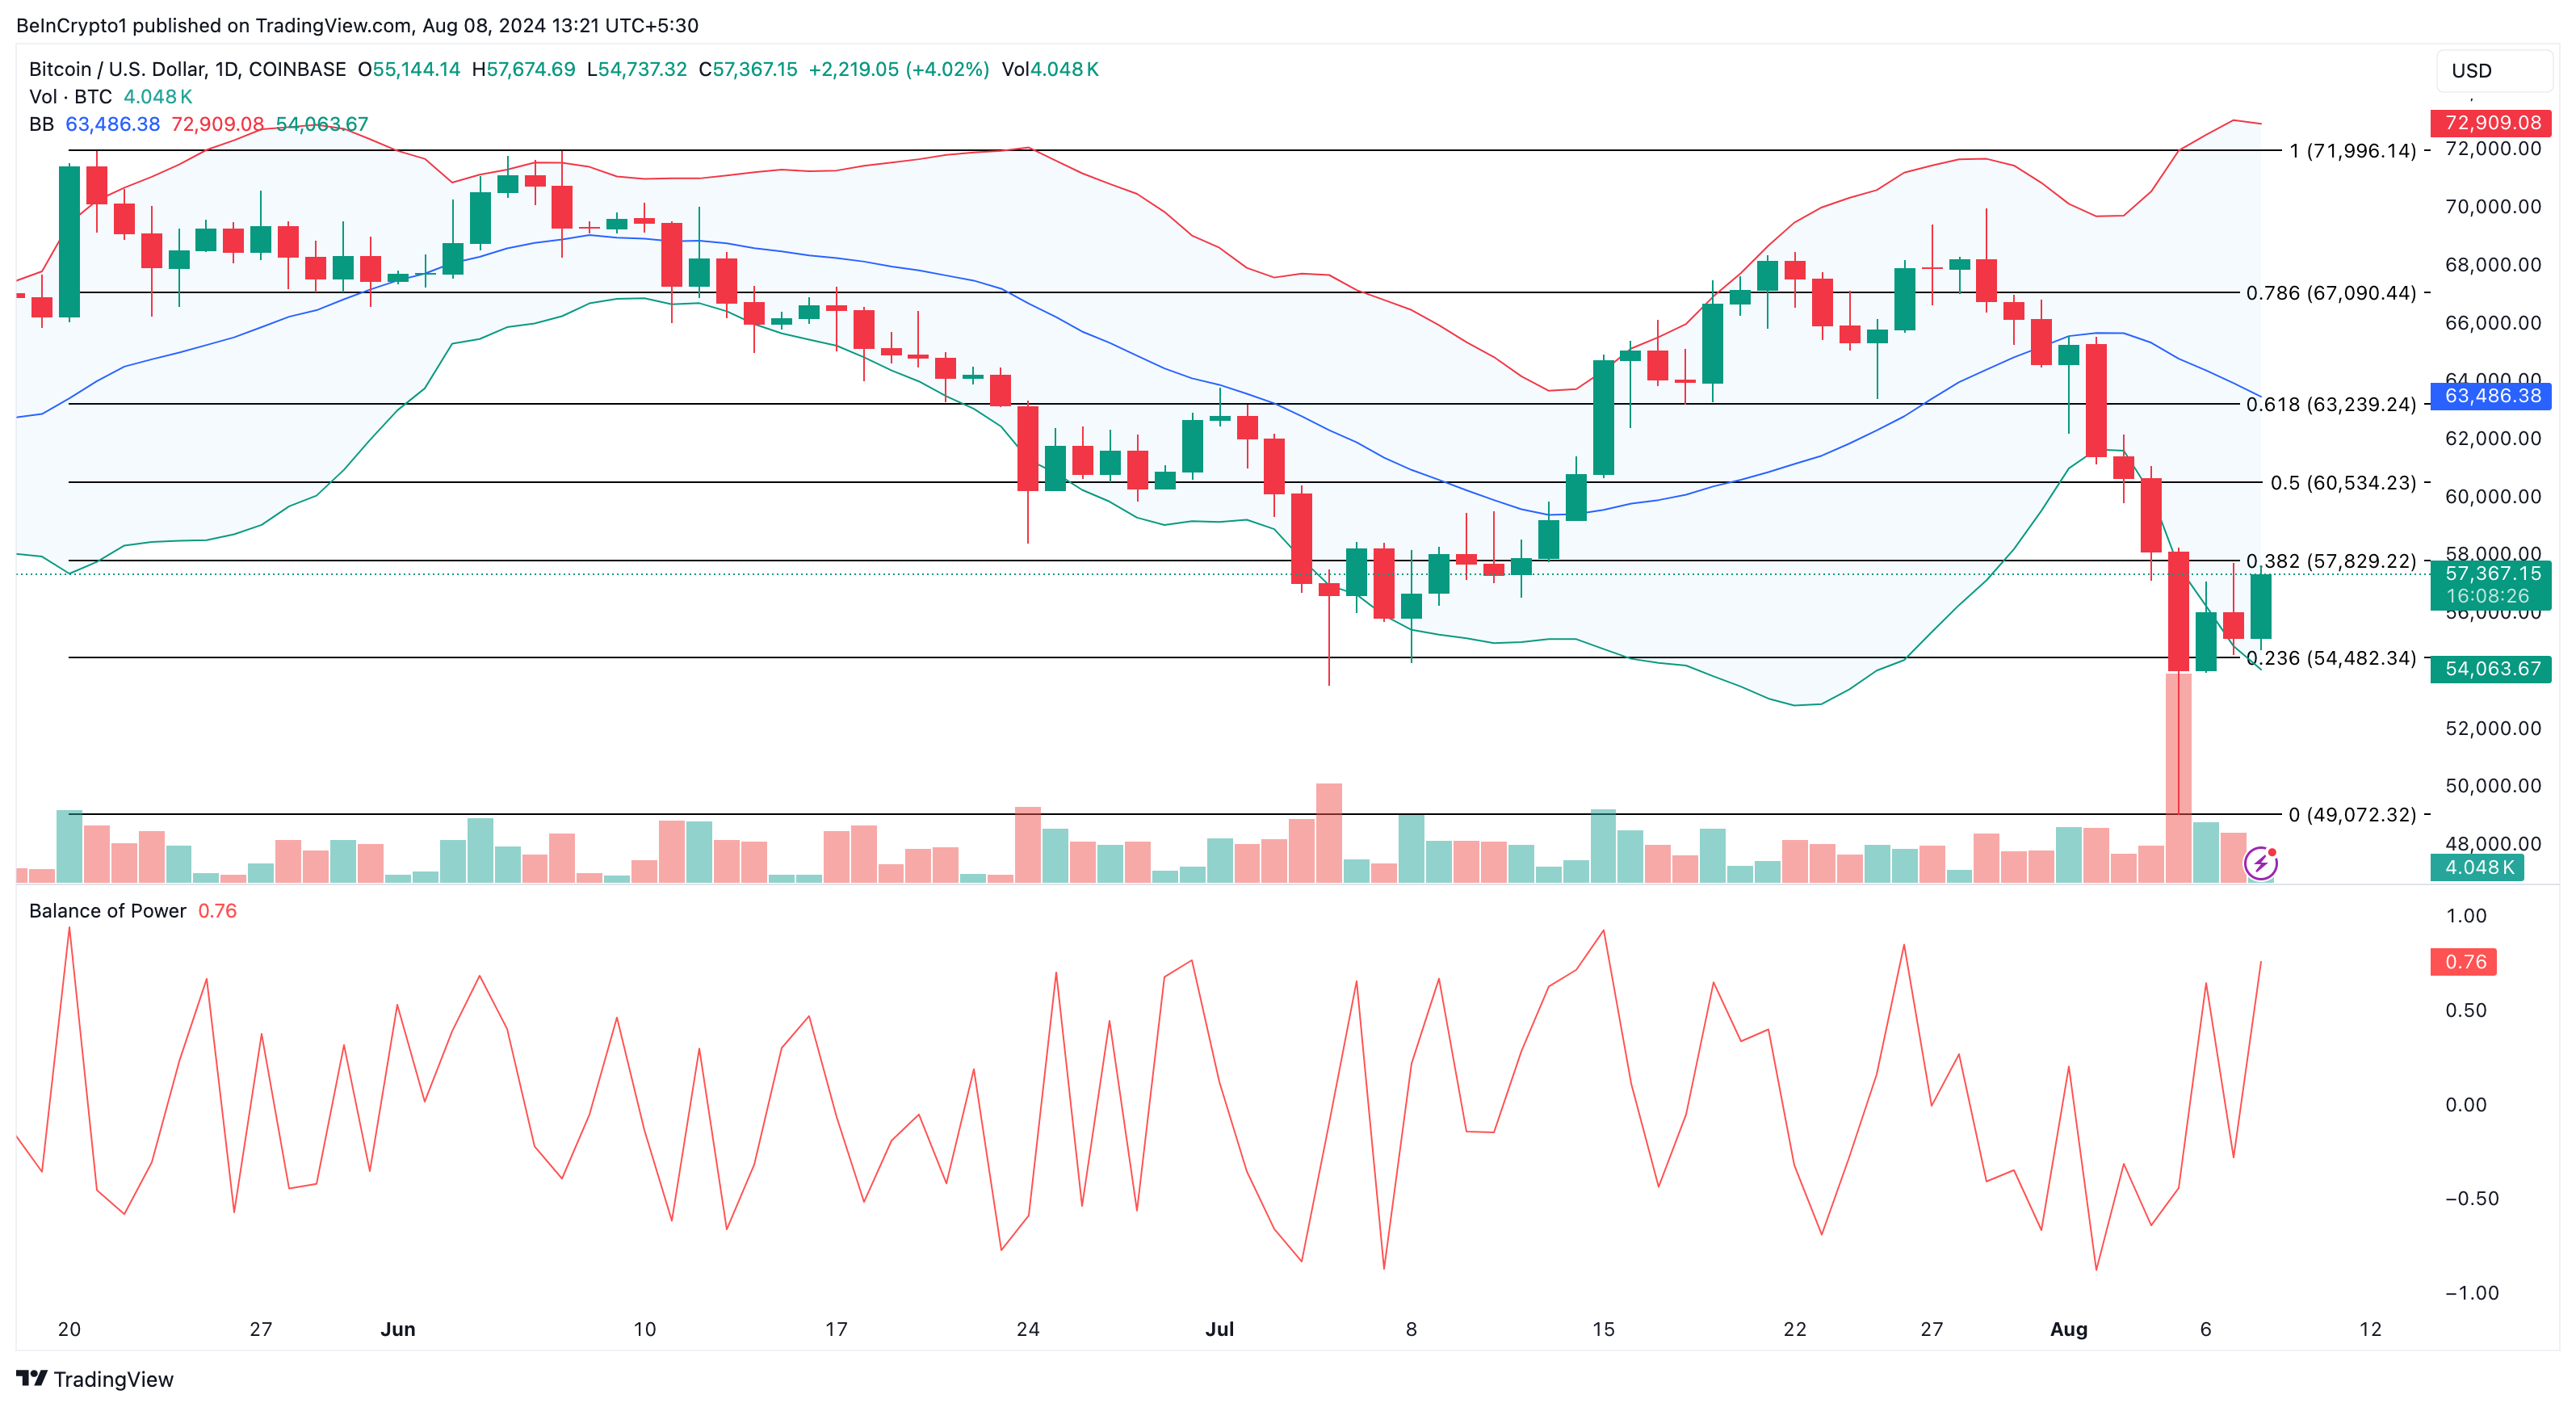
The expanding bands, coupled with the recent buying pressure, suggest that the coin could continue to undergo a rebound. If this is the case, BTC may hit $60,534 in the short term. On a mid to long-term horizon, the price could reach $71,996.
However, in a worst-case scenario, accompanied by intense selling pressure, BTC may drop to $54,482.


