
Bitcoin (BTC) is up more than 7% over the past seven days, holding firm above the $100,000 level and showing signs of continued bullish momentum. However, recent whale activity paints a more cautious picture, with only a slight increase in large holders and mixed signals over the past month.
While the Ichimoku Cloud and EMA indicators remain supportive, they also reflect a market lacking strong conviction. With key resistance and support levels in focus, BTC’s next move could determine whether it pushes toward new highs or risks falling back below six figures.
BTC Whales Inch Up, but Confidence Still Mixed
The number of Bitcoin whales—wallets holding between 1,000 and 10,000 BTC—has slightly increased, rising to 2,012 as of today, up from 2,009 on May 9.
While this uptick may appear marginal, whale activity is closely monitored by analysts and investors because these large holders often influence market direction through significant transactions.
Whale accumulation typically reflects growing confidence in Bitcoin’s medium- to long-term outlook, while reductions in holdings can signal caution or profit-taking.
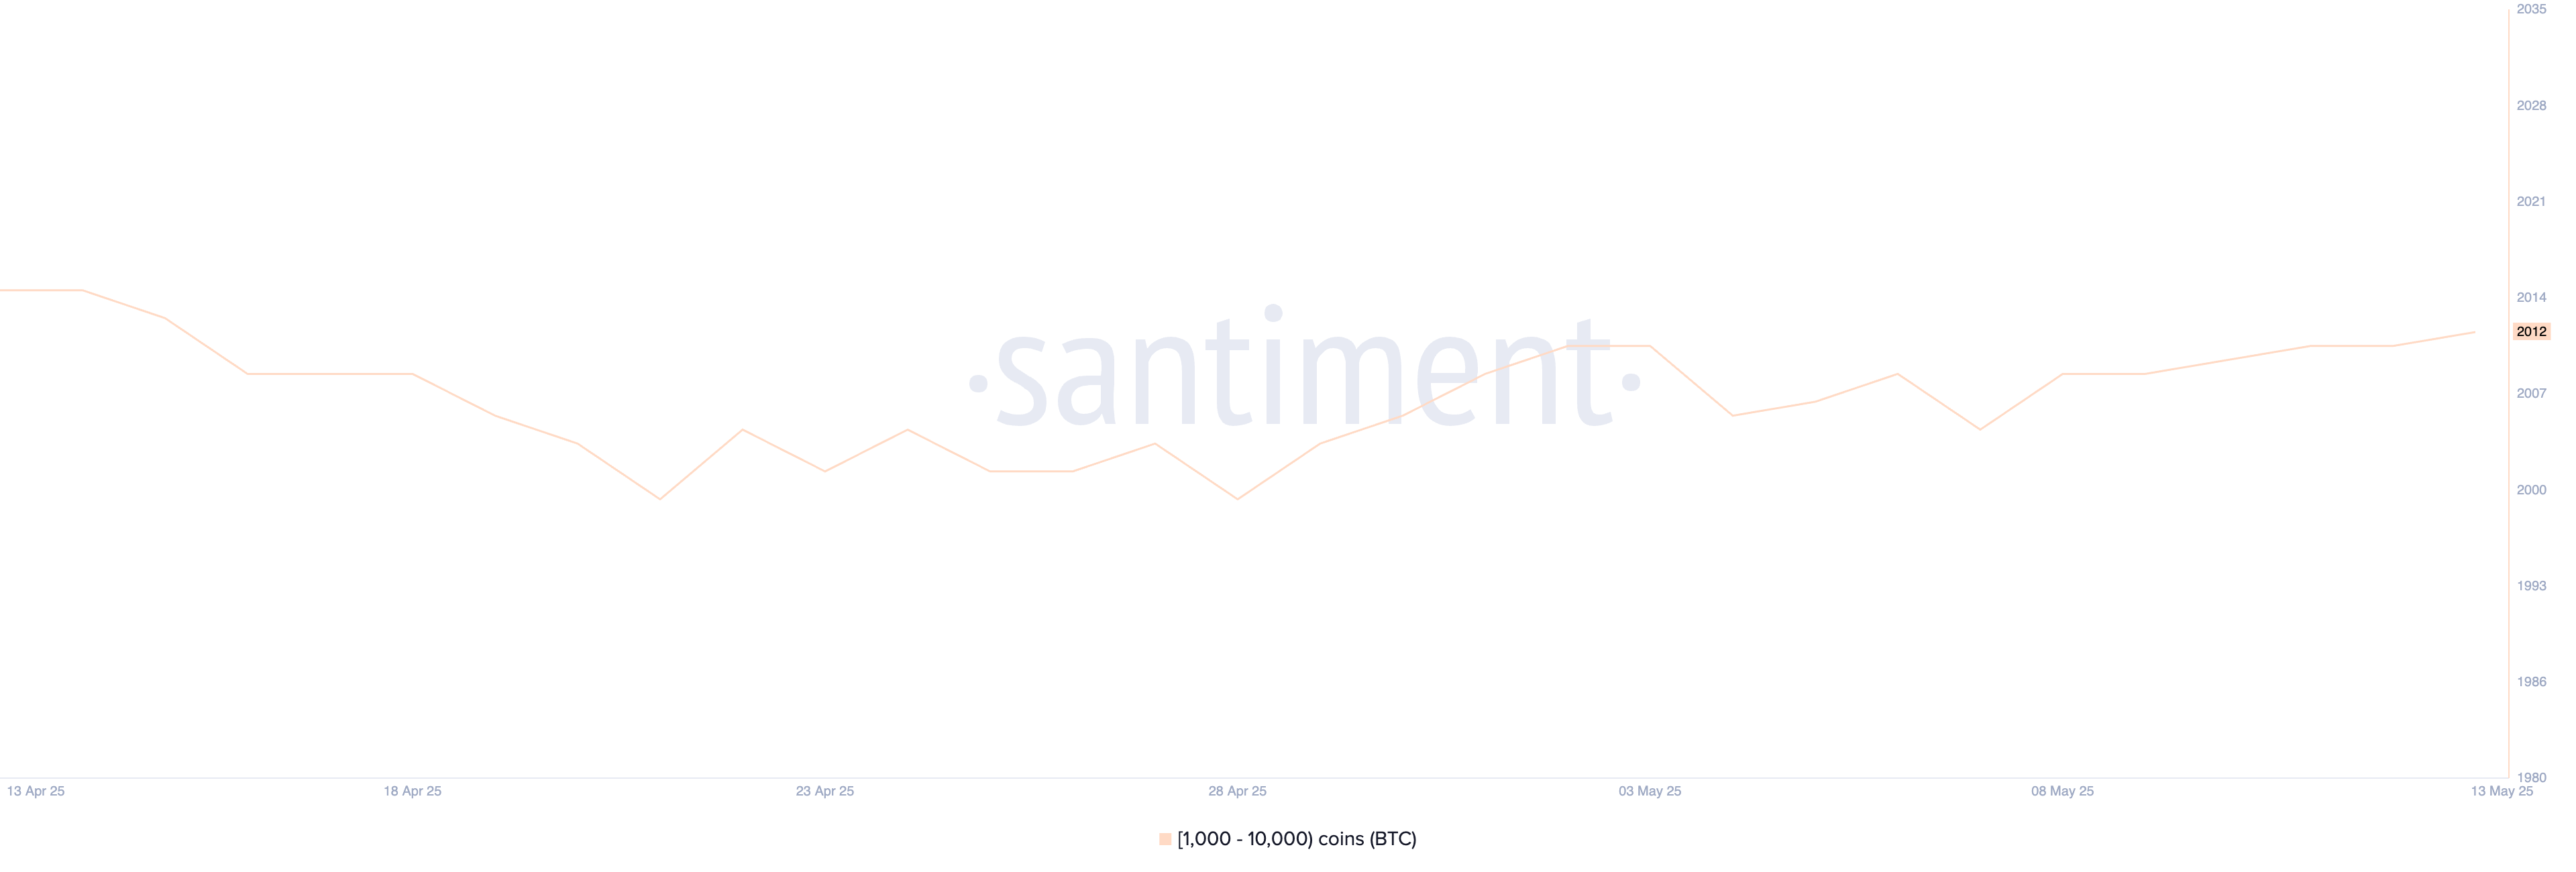
That said, the current pace of growth in whale numbers remains modest, and their activity has been far from stable over the last 30 days.
The last month has shown mixed signals, with whales alternating between accumulation and distribution amid macro uncertainty and volatile price action, as all 12 Bitcoin ETFs see red as the market shrugs off $96 million exit in the last 24 hours, their biggest single-day outflow since April 16.
This inconsistency suggests that, despite the slight rise in recent days, major players are still navigating the market cautiously rather than committing to a sustained buying trend, despite some analysts stating that Bitcoin could reach a new all-time high soon.
Bitcoin Holds Above Cloud, But Momentum Slows
The Ichimoku Cloud chart for Bitcoin currently shows a relatively neutral-to-bullish setup. Price candles sit just above the Kijun-sen (red line) and Tenkan-sen (blue line), indicating that short-term support is holding for now.
The cloud (Kumo) ahead is bullish, with the Senkou Span A (green cloud boundary) positioned above the Senkou Span B (red cloud boundary), reflecting a positive forward-looking trend.
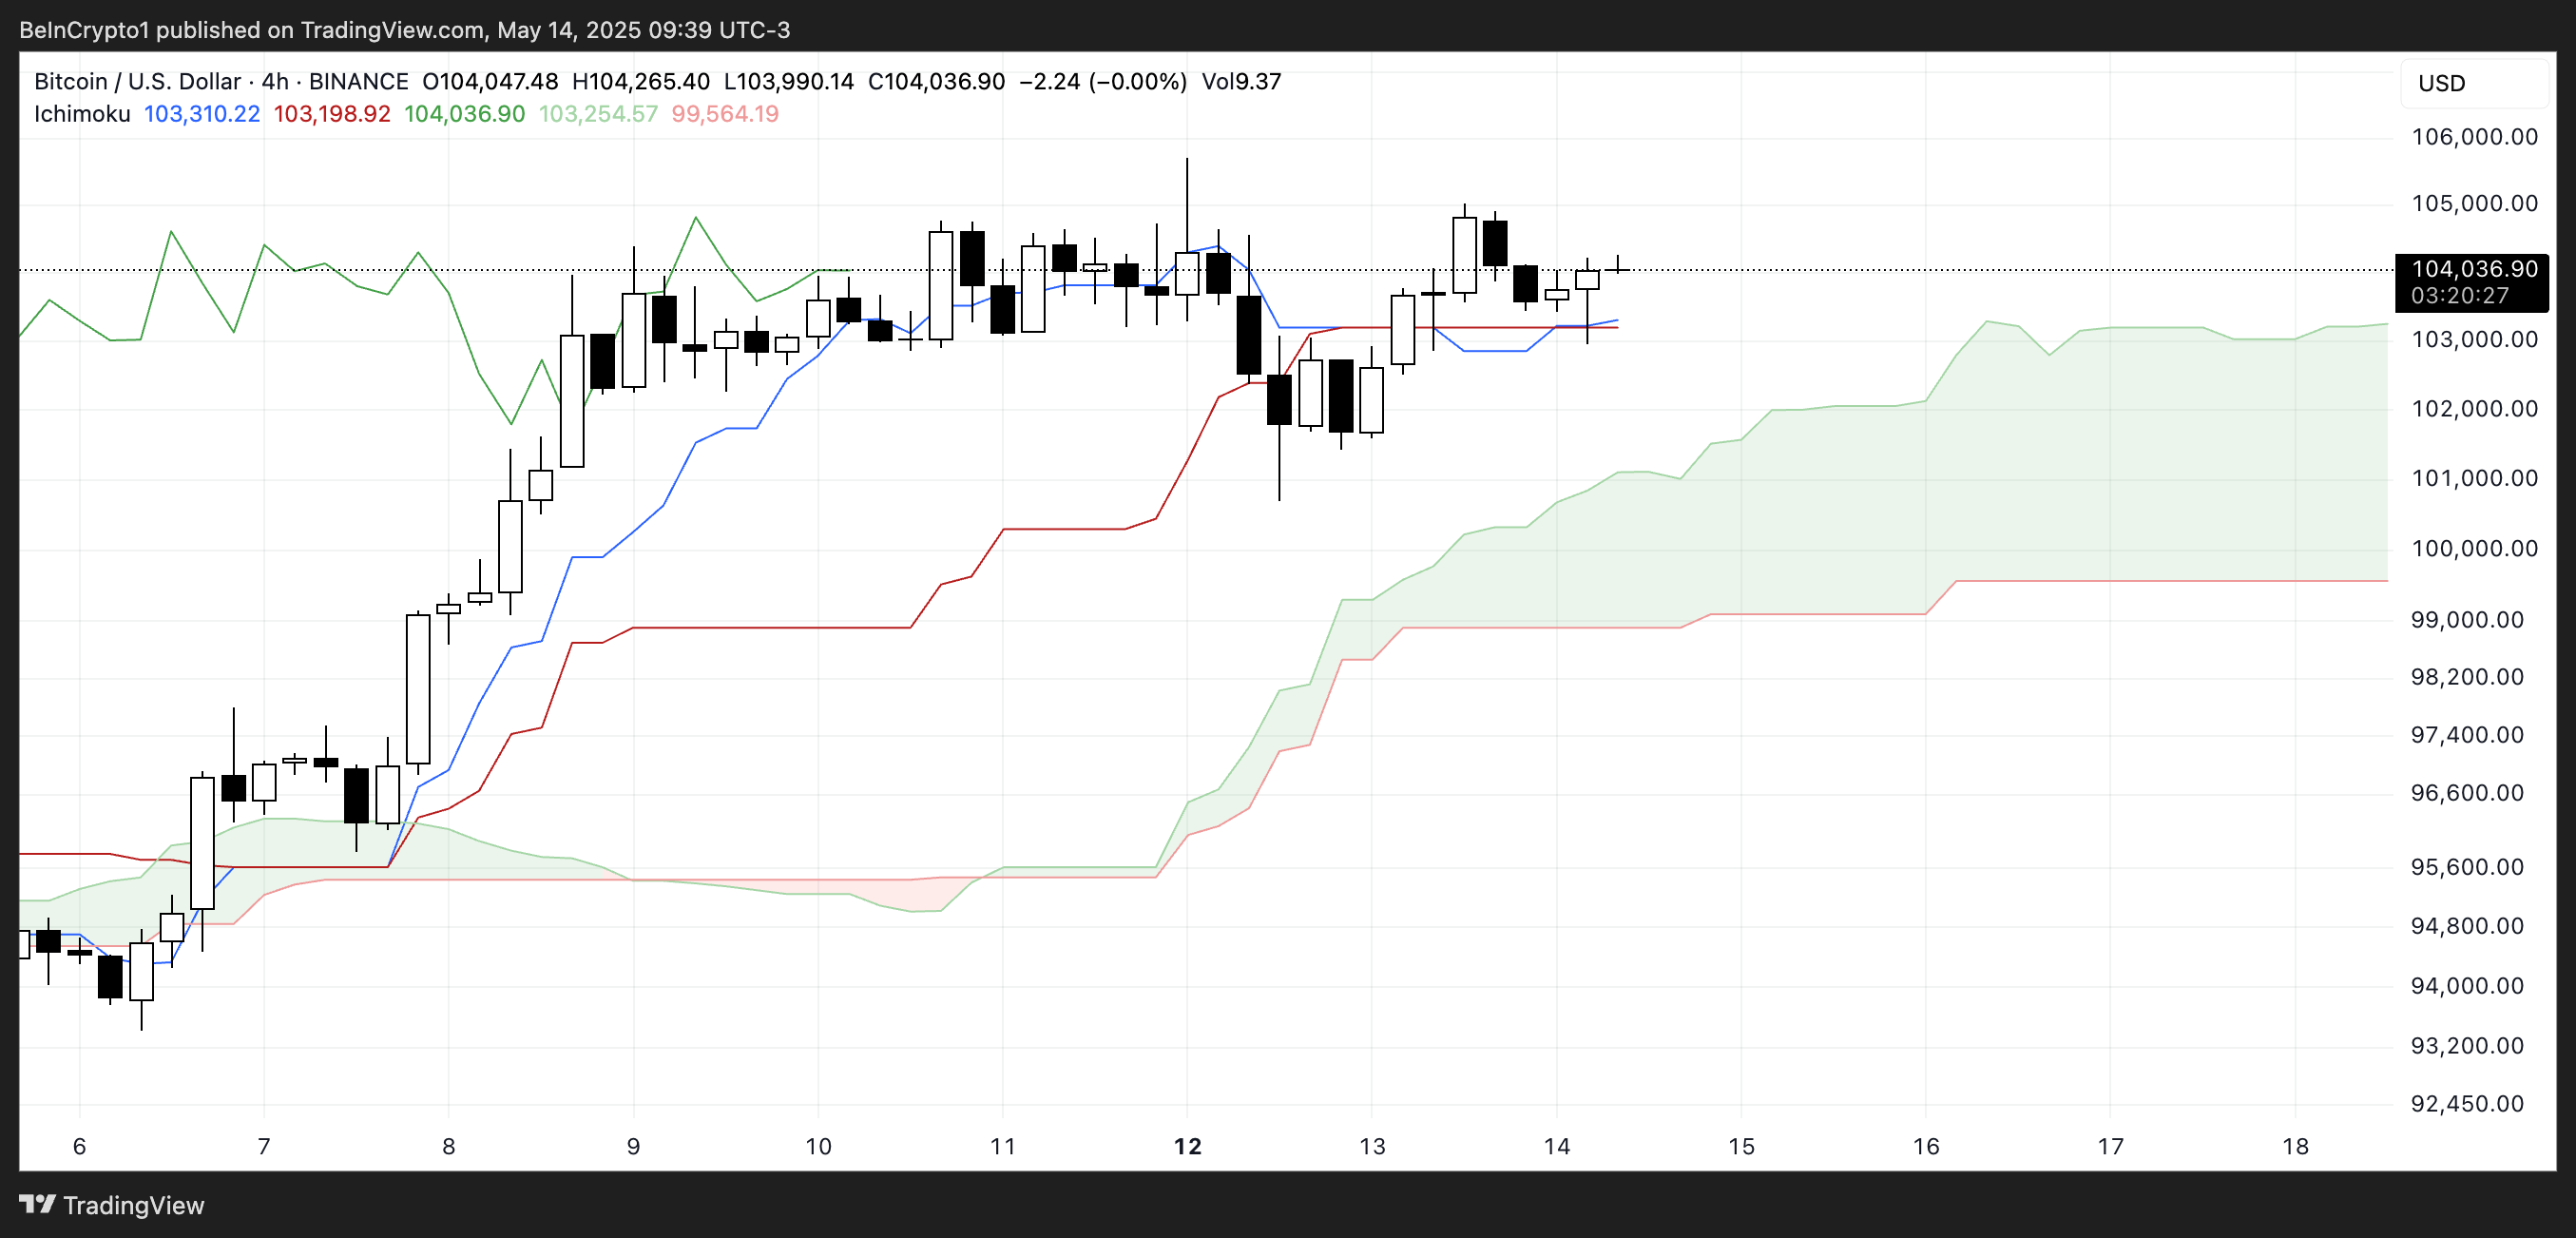
The Chikou Span (lagging green line) remains above the price from 26 periods ago, signaling cautious bullish sentiment.
Price is still above the cloud, which is a bullish zone, but sideways action and a narrowing gap between the Tenkan-sen and Kijun-sen show indecision.
For the uptrend to gain strength, the blue line must cross above the red line clearly, with a thicker and steeper cloud forming ahead.
Key Levels to Watch: Bitcoin’s Next Move After Holding $100,000
Bitcoin price has been steadily holding above the key psychological level of $100,000 for the past six days, with its EMA lines indicating a clear uptrend—short-term averages are positioned above long-term ones, signaling sustained bullish momentum.
If BTC can break above the immediate resistance at $105,705, it could trigger another leg up toward $107,038.
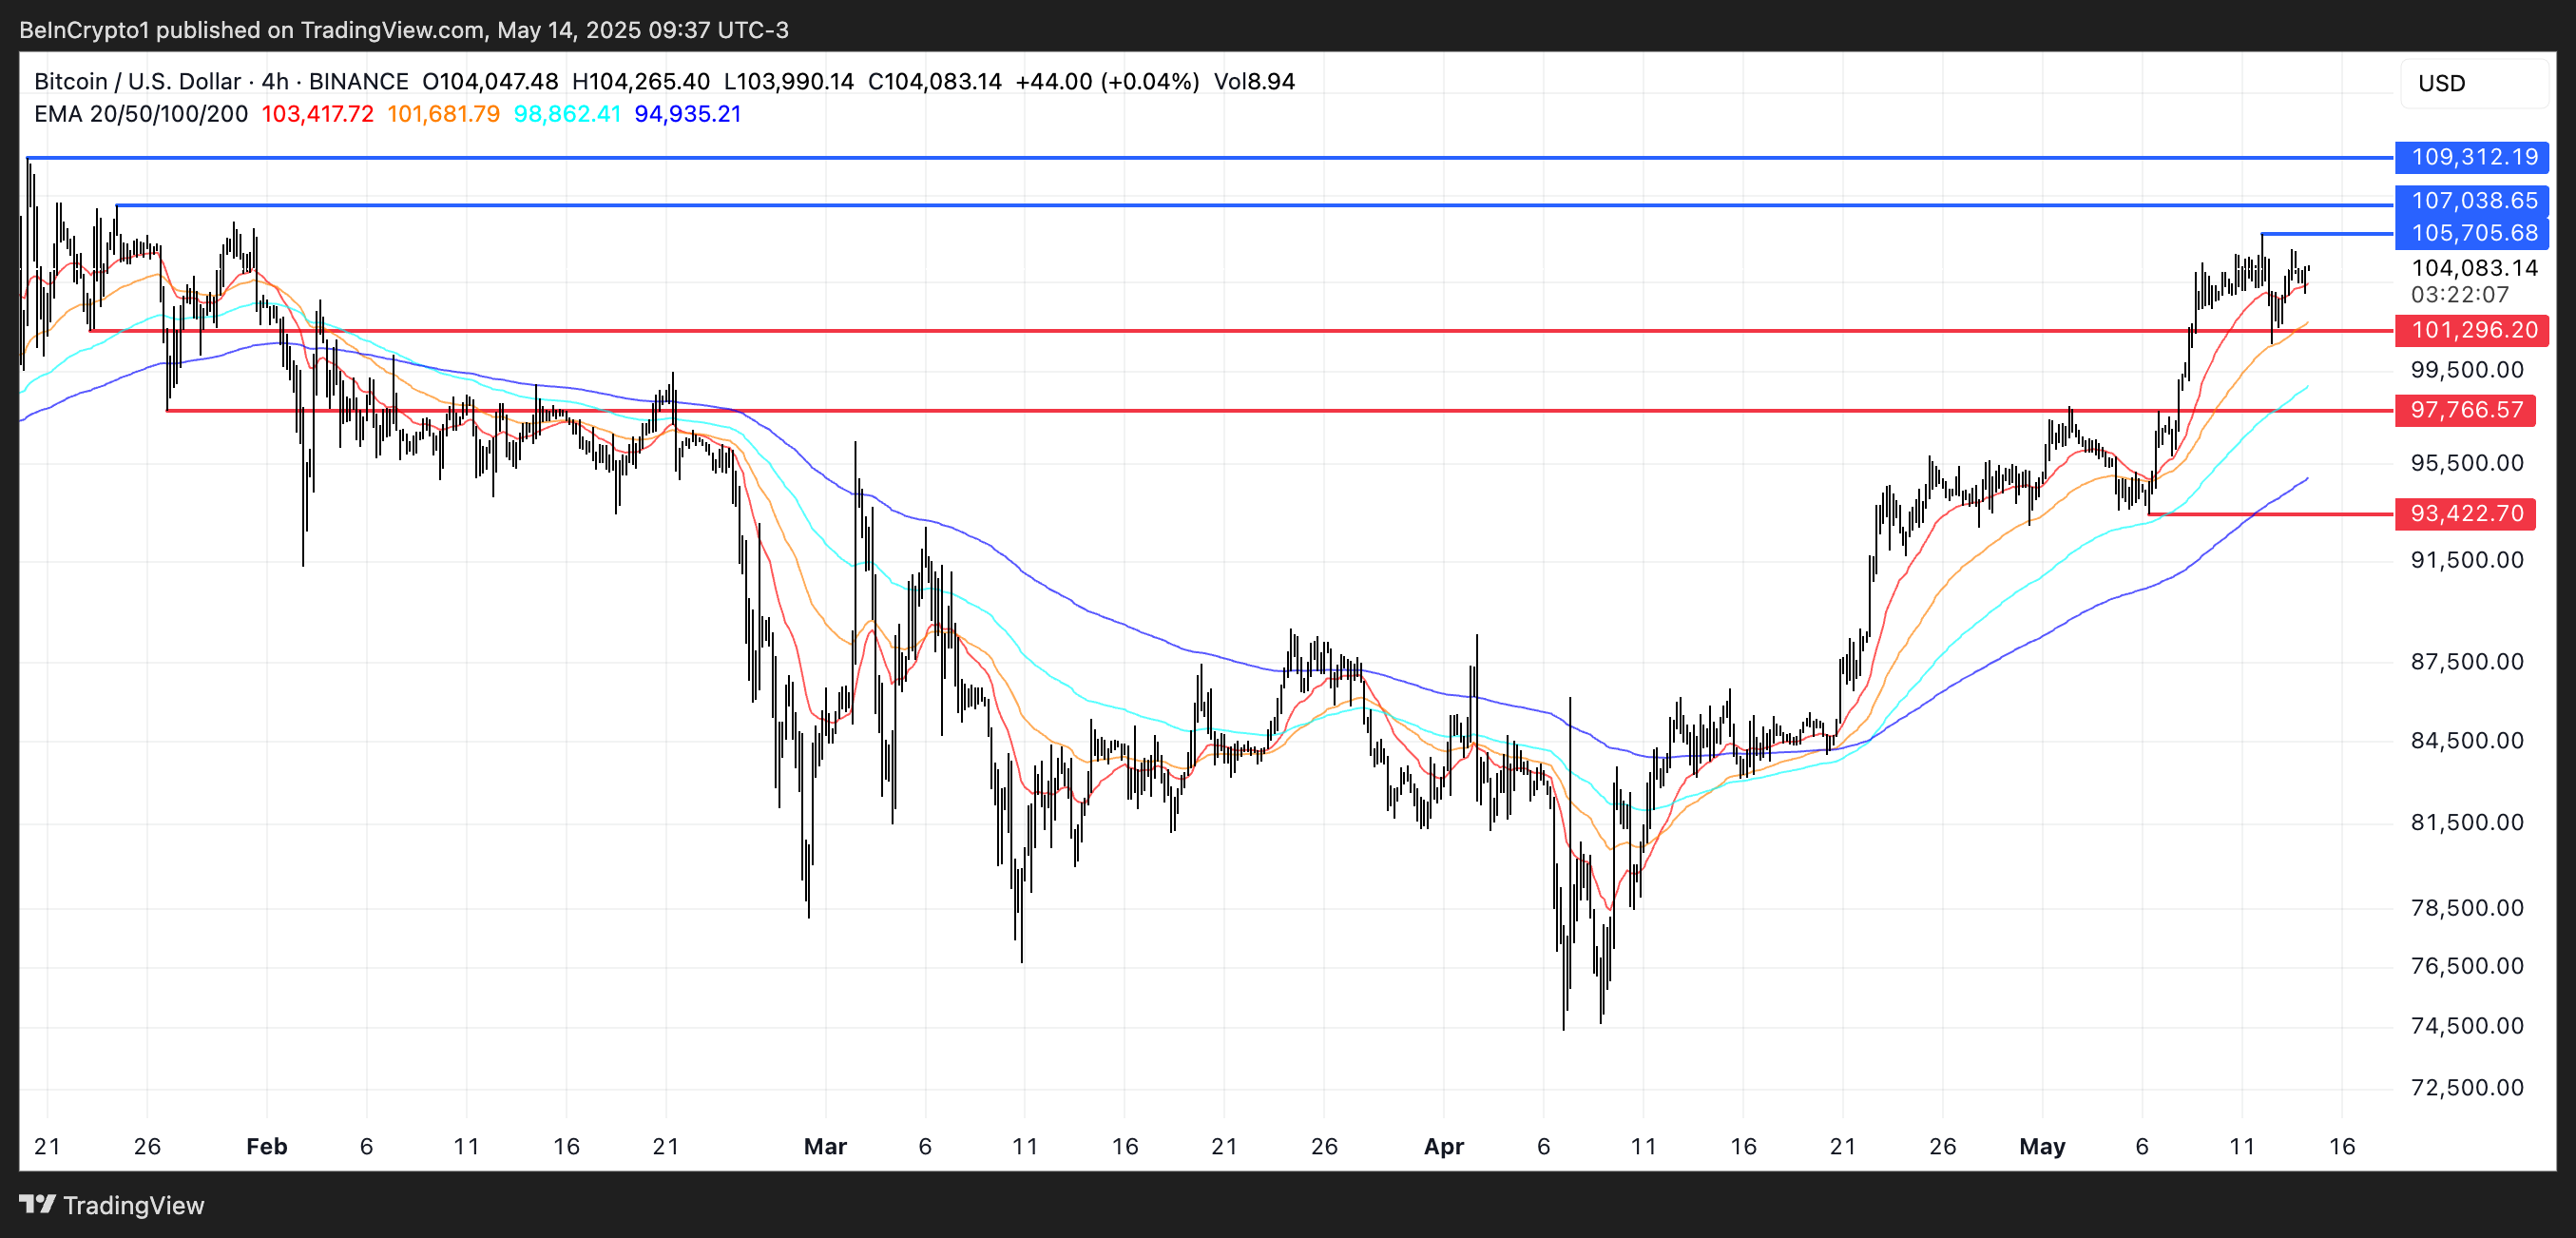
A strong continuation could push the price further to $109,312, with a potential breakout toward $110,000, which would mark a historic milestone.
However, if the current trend loses steam, Bitcoin may face a pullback toward its first key support at $101,296.
A break below that level could bring the price back under $100,000, opening the door to deeper corrections at $97,766 and potentially $93,422.
