


Be[in]Crypto takes a look at several potential wave counts for bitcoin (BTC) in order to determine if the bullish trend has come to an end.
Long-term wave count analysis
There are two main possibilities for the long-term wave count.
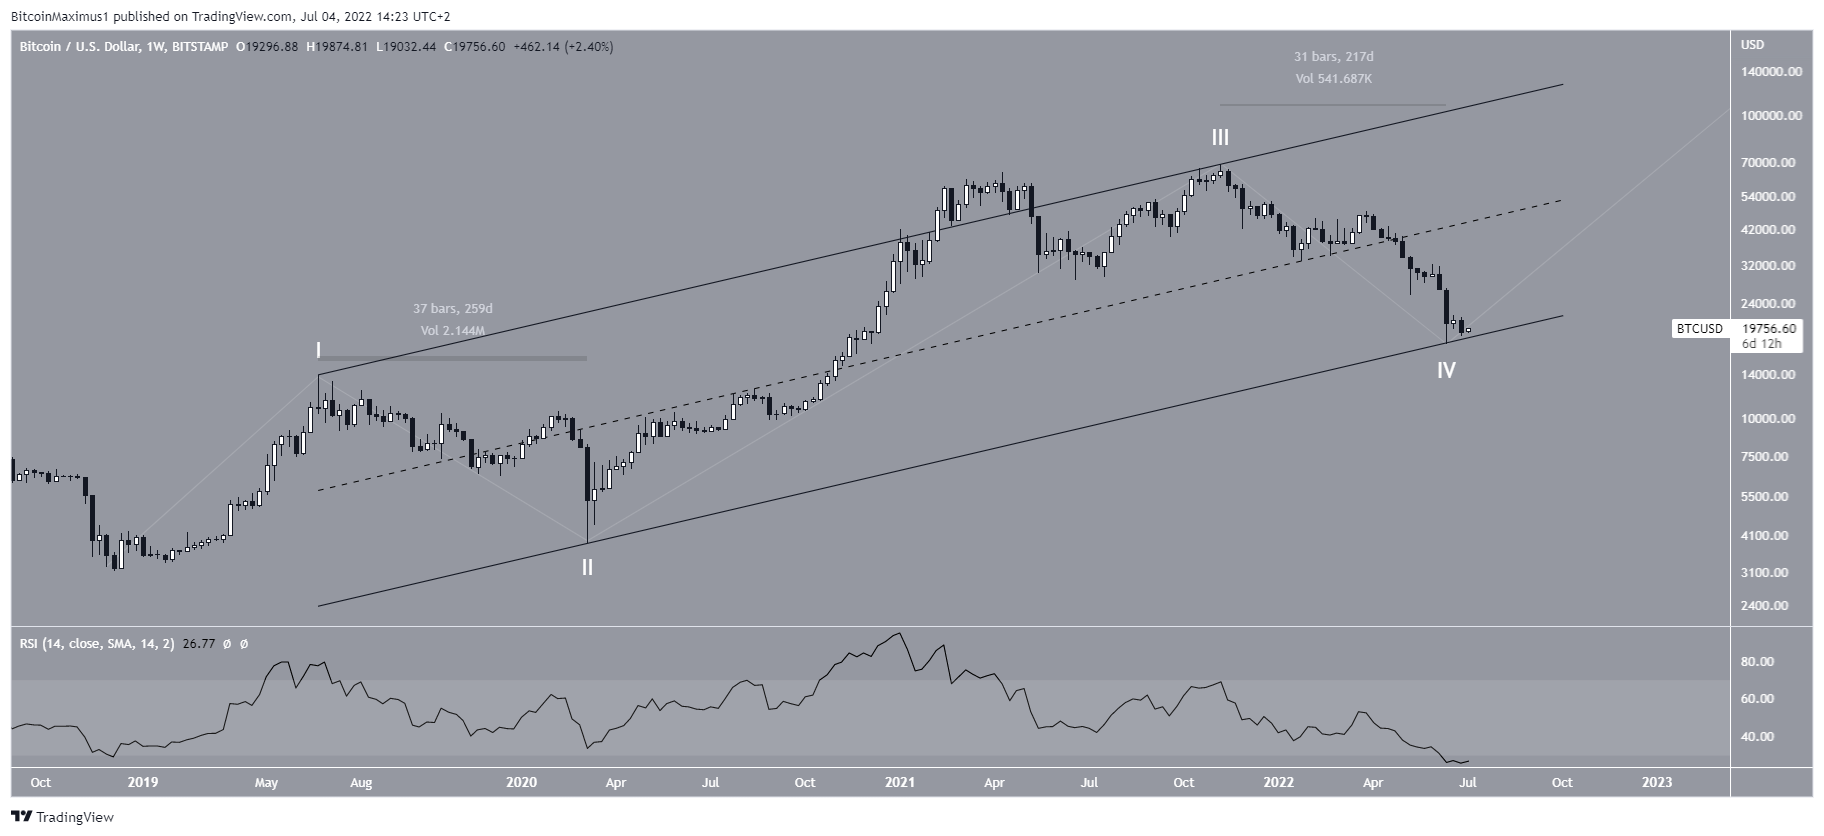
The bullish one suggests that the price has reached or is very close to reaching the bottom of wave four (white) in a five-wave upward movement that began in March 2020.
There are three main factors that support the possibility of this being the correct wave count.
- Waves two and four have had similar lengths
- The price is at the bottom of a channel connecting waves one and three
- The weekly RSI is oversold and at an all-time low.
A decrease below the wave one high at $13,880 would invalidate this particular count.
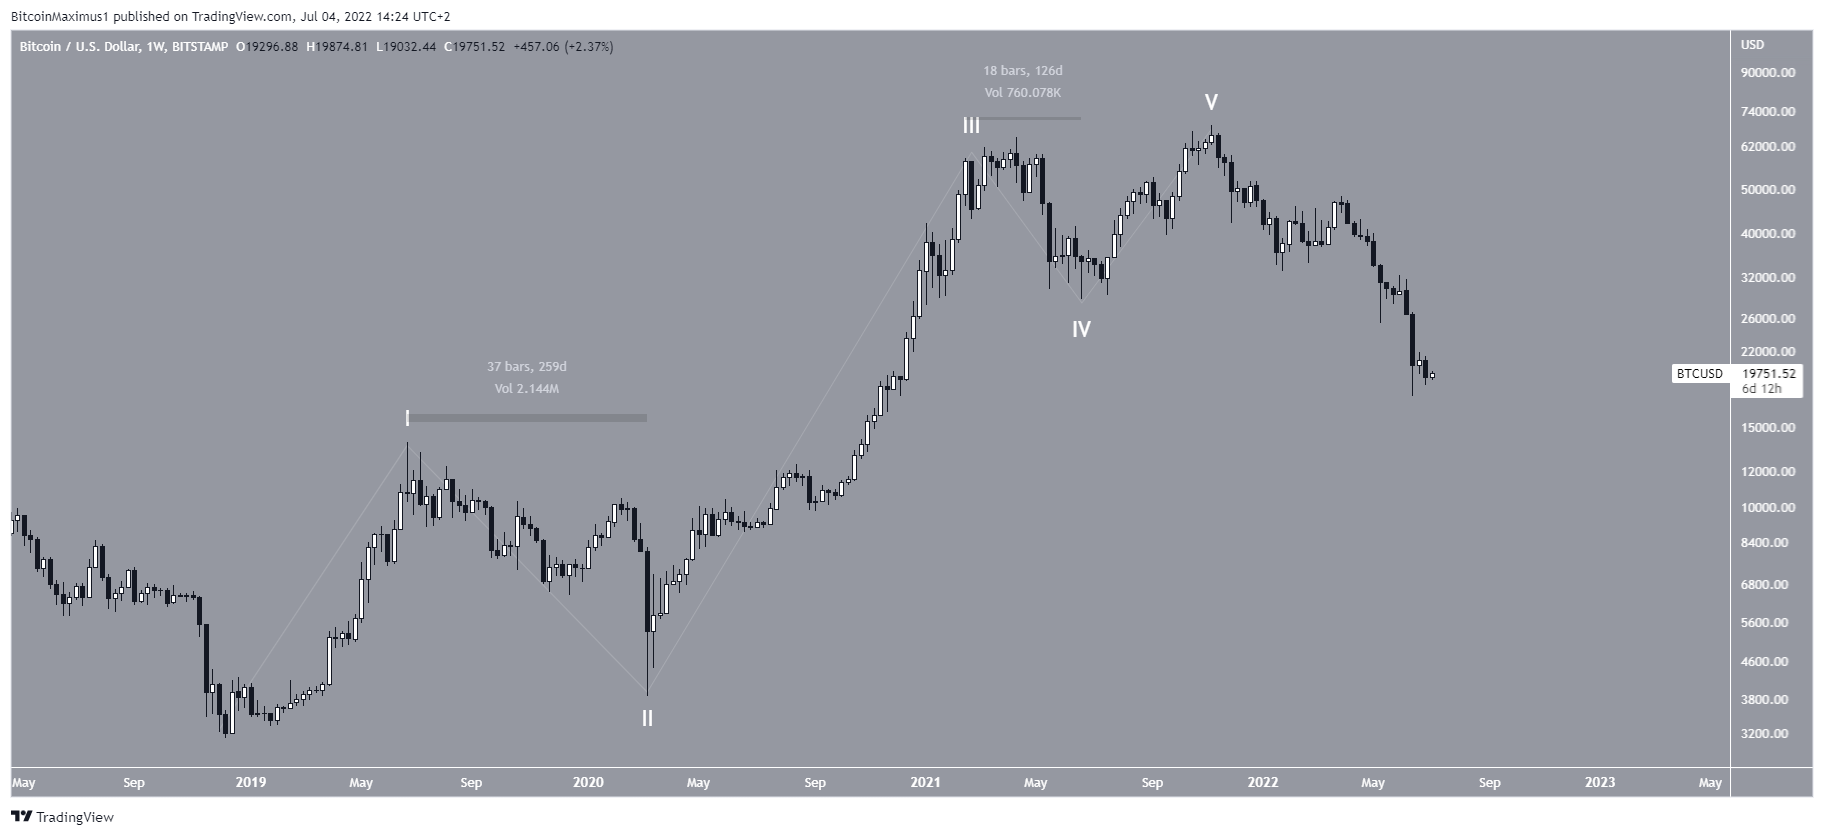
The bearish count indicates that the entire five-wave formation has already come to an end. In this possibility, BTC is in a new long-term bearish trend.
The irregularity in this BTC count is the massive difference in time and magnitude between waves two and four and waves one and three.
So, going by Elliot Wave rules, the first count is more likely to be correct.
Short-term BTC movement
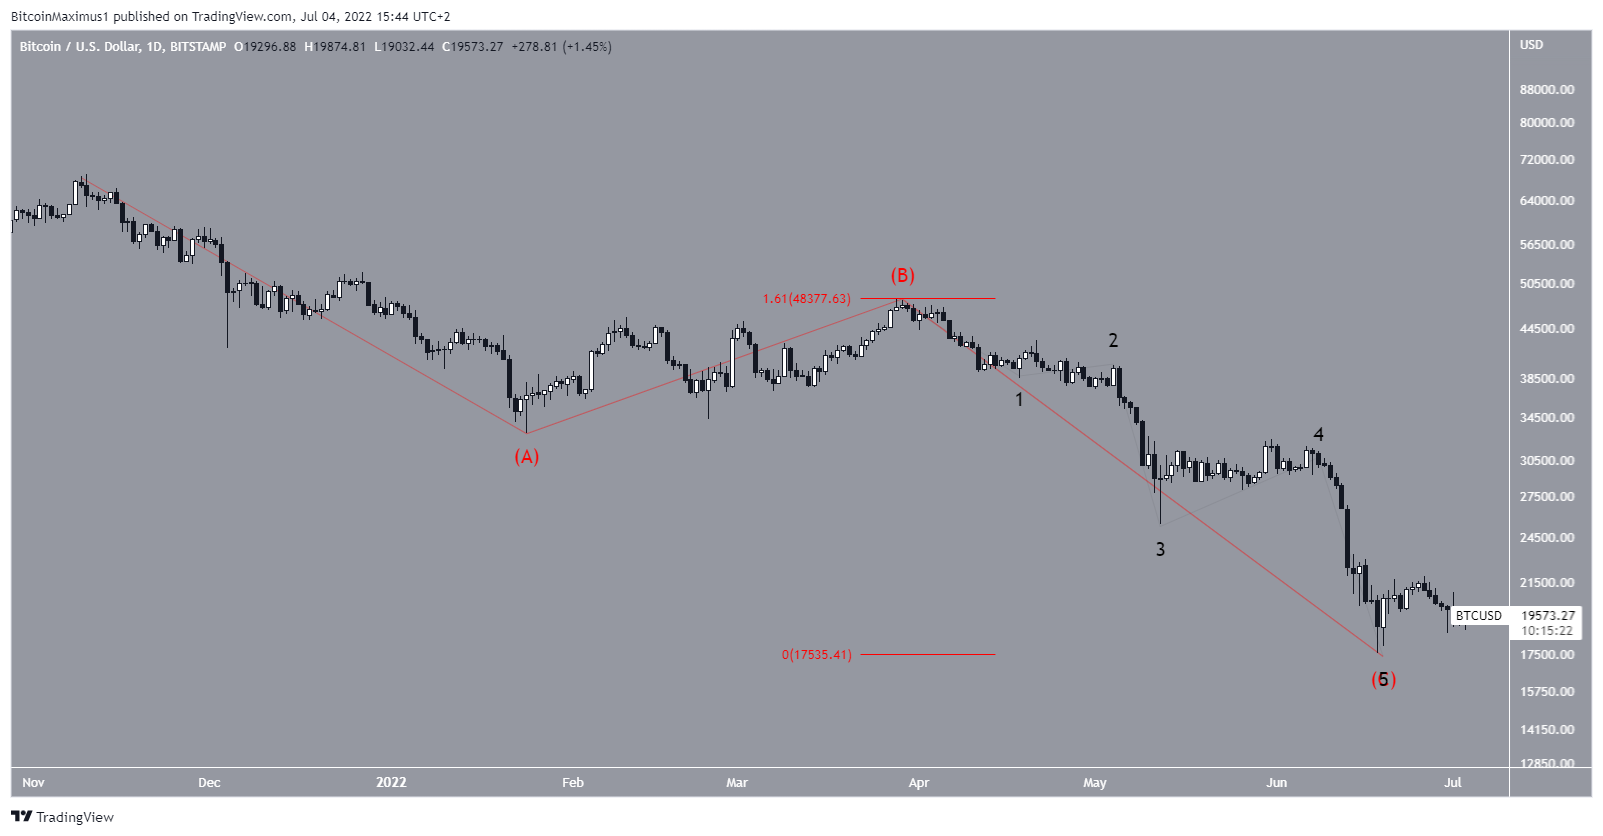
As for the short-term count, the bullish possibility indicates that the price has completed or is very close to completing an A-B-C corrective structure (red). In it, waves A:C have had an exactly 1:1.61 ratio, and wave C has a completed five wave downward movement (black).
So, if this count is to be proved correct, the price has to reverse at the current level.
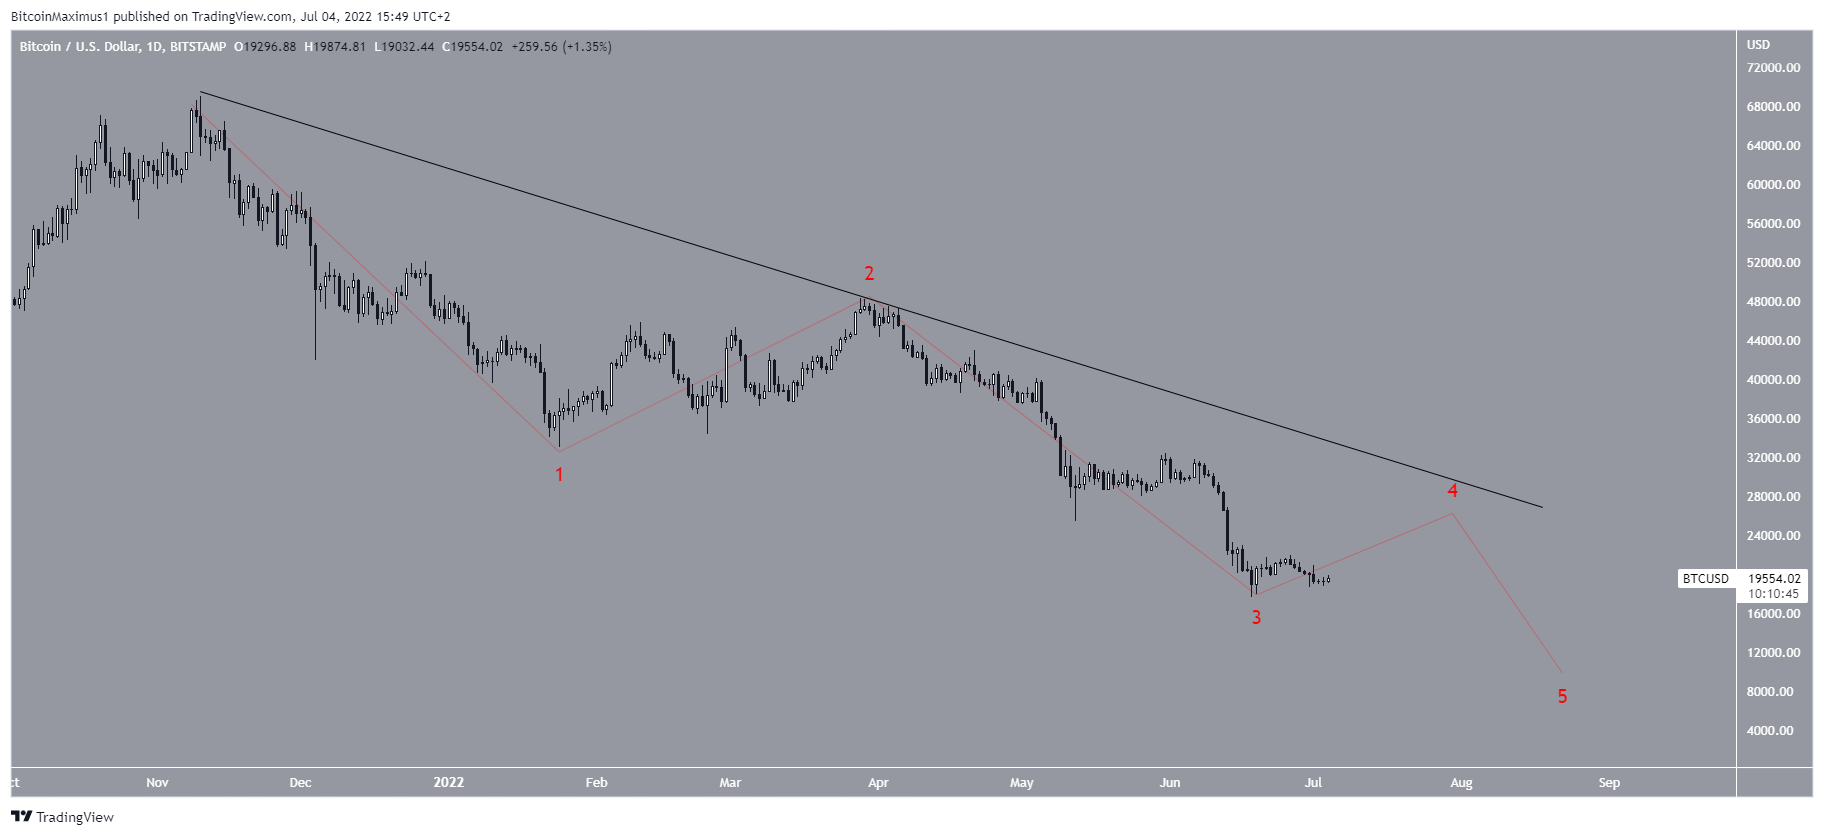
The bearish count suggests that the decrease since the all-time high is a five-wave downward movement instead.
At the time, both counts indicate that a short-term BTC bounce is likely. However, the shape and length of the increase will help in identifying which is the correct count.
In any case, a decrease below $13,880 would mean that the long-term trend is bearish.
For Be[in]Crypto’s latest bitcoin (BTC) analysis, click here


