
After getting rejected on Aug 17, the Bitcoin (BTC) price has made another unsuccessful attempt at breaking out above $11,900.
Until the price reclaims this level with a daily close above it, the short and medium-term trend is considered bearish.
Bitcoin Faces Resistance
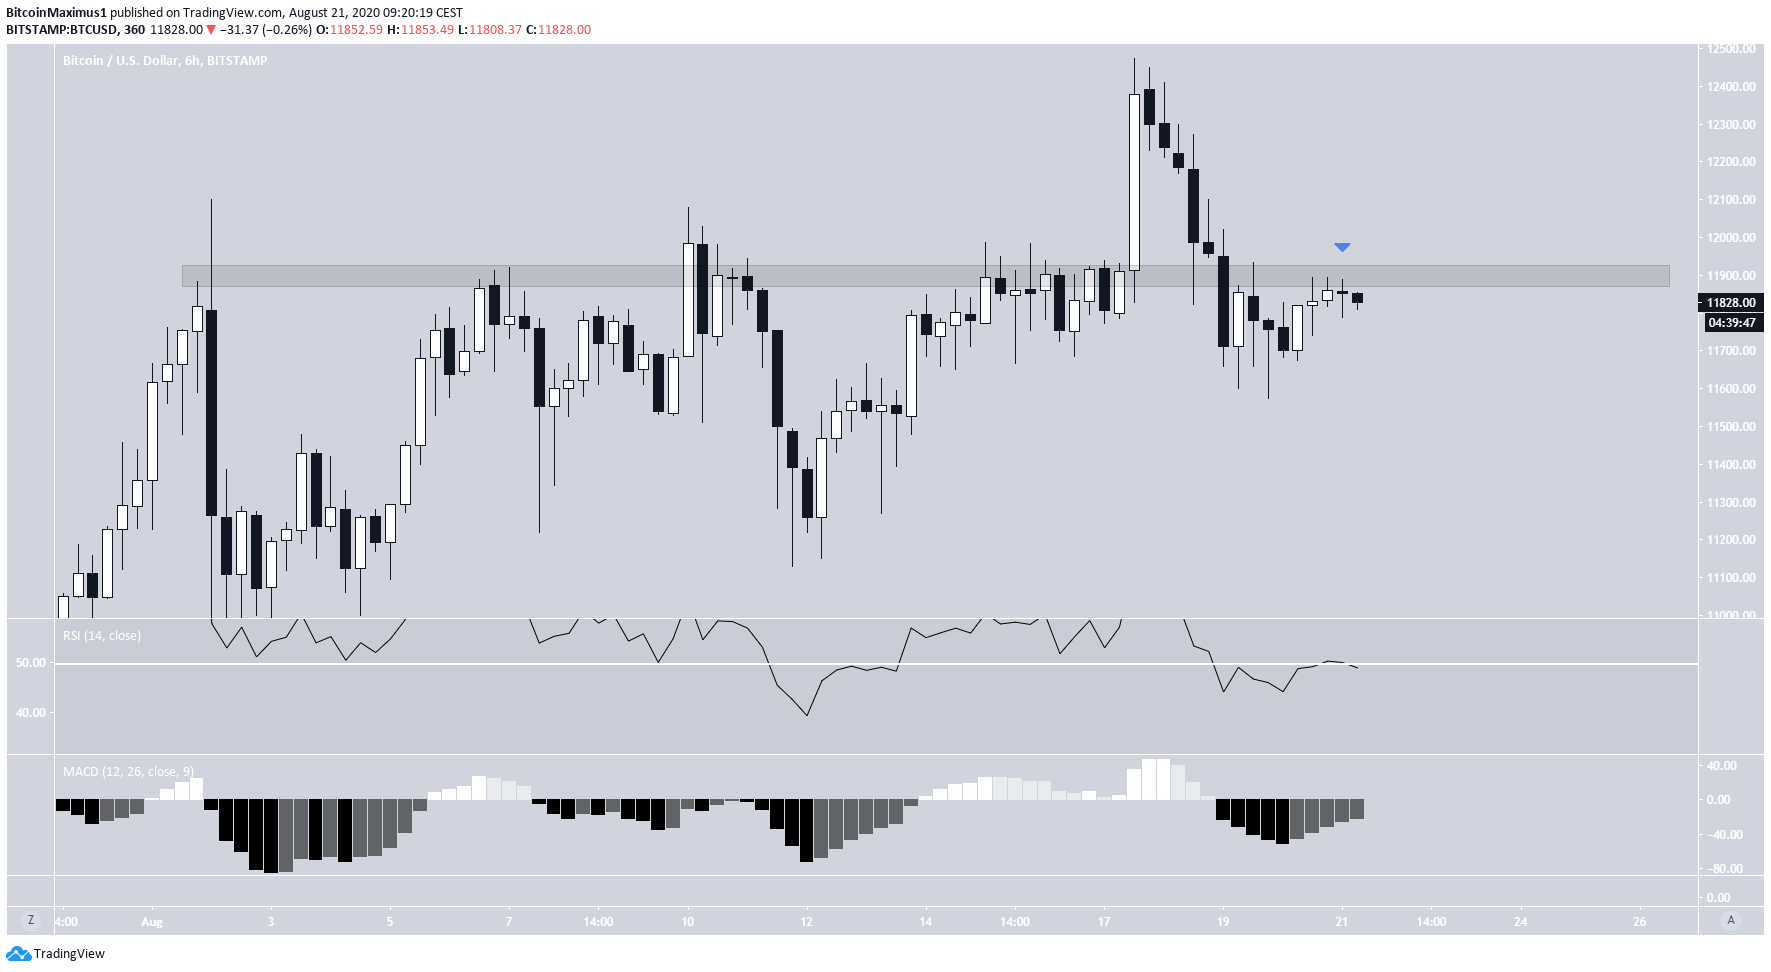
Since the losses Aug 17, the Bitcoin price has unsuccessfully attempted to move above the $11,900 area, which has been acting as resistance since Aug 2.
The failure of the price to move above this level suggests that the Aug 17 breakout was not legitimate, but rather was just a deviation above the range high.
The RSI has also been rejected by the 50-line. While the MACD is increasing, it has not turned positive yet nor has it generated any bullish divergence.
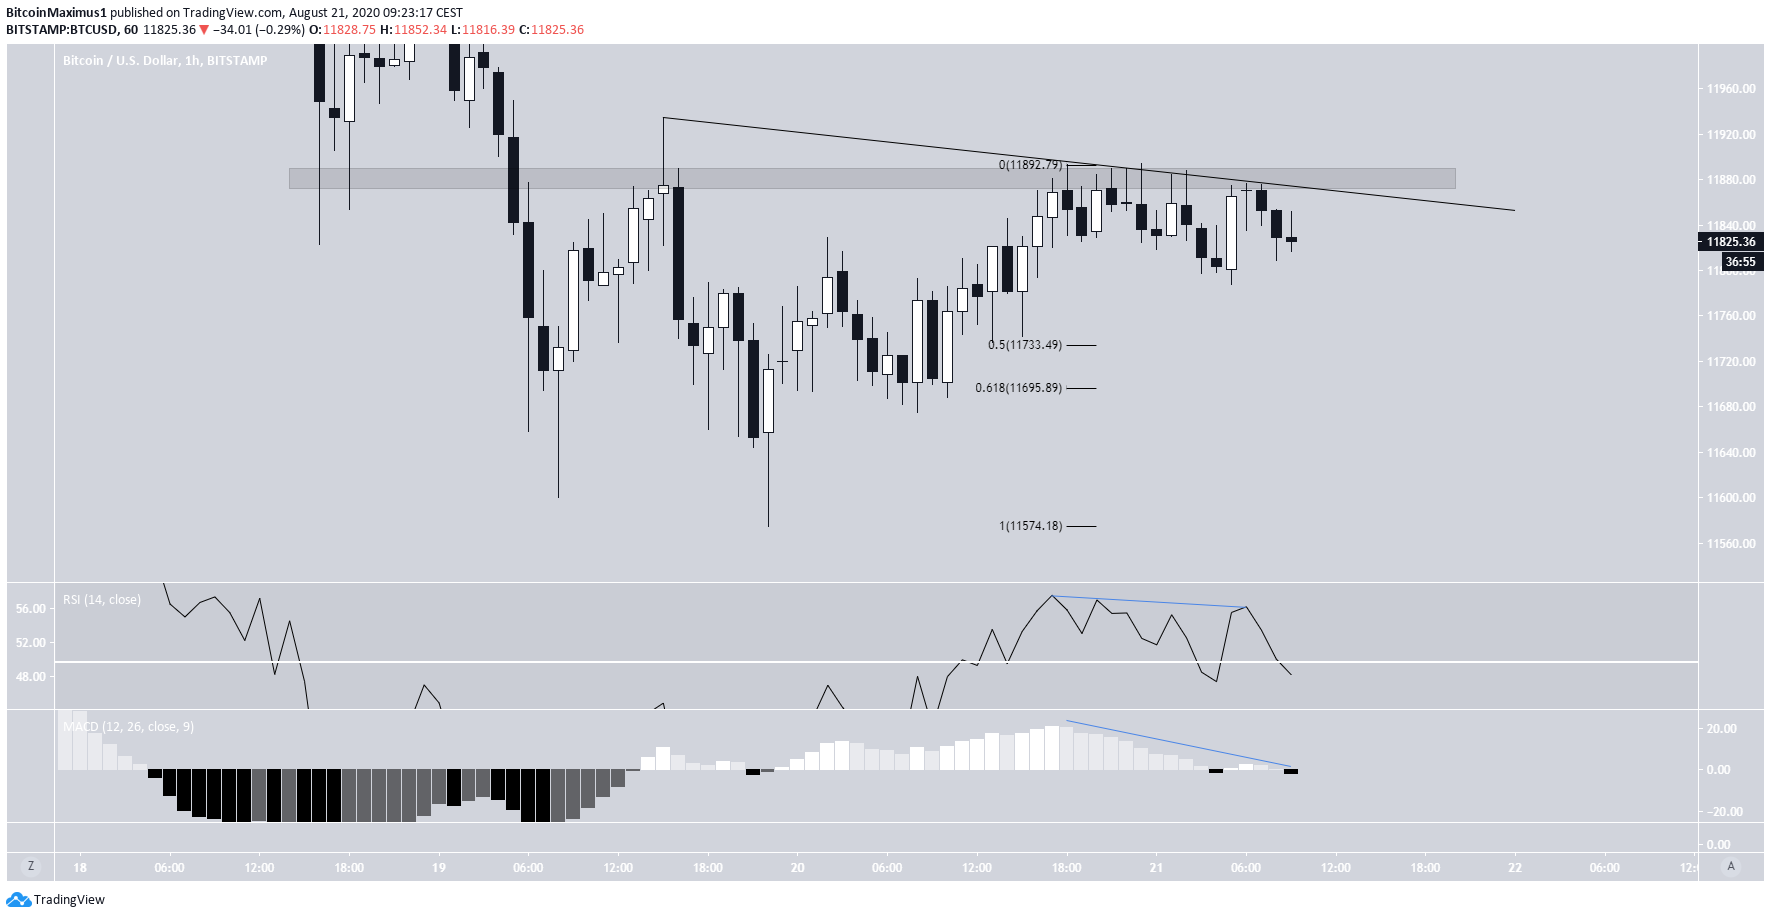
The short-term chart shows that besides the aforementioned resistance area, the price is also following a descending resistance line since Aug 19.
There is a bearish divergence in both the RSI and the MACD, the latter of which has dropped into negative territory. This suggests that the price is likely to decrease towards the $11,700-$11,735 range.
Bearish Wave Count
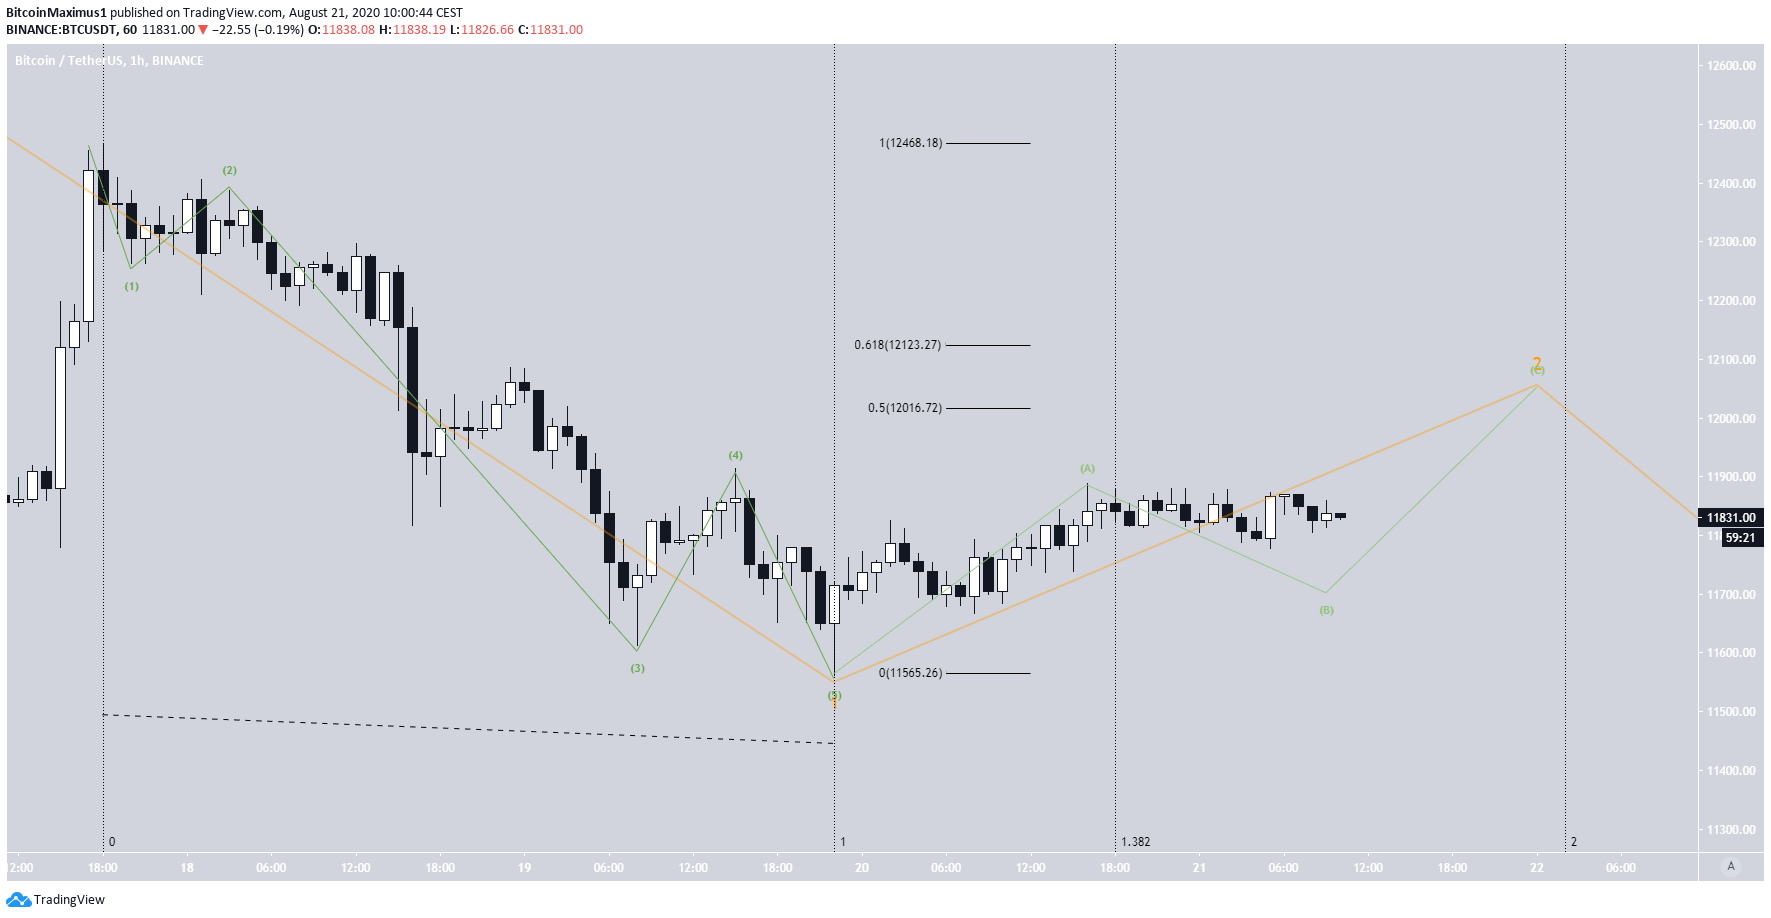
The price movement since the Aug 17 high resembles a completed five-wave formation (in green below) with an extended third wave. This is a part of a larger wave 1 (orange).
If the price retraces upwards as expected, it will likely increase until the 0.5-0.618 Fib levels between $12,016-$12,123 before resuming its downward movement.
A possible date target for the correction to end would be in the early hours of Aug 22, assuming that the retracement will take the same amount of time as the downward move.
In BeInCrypto’s previous analysis, we stated:
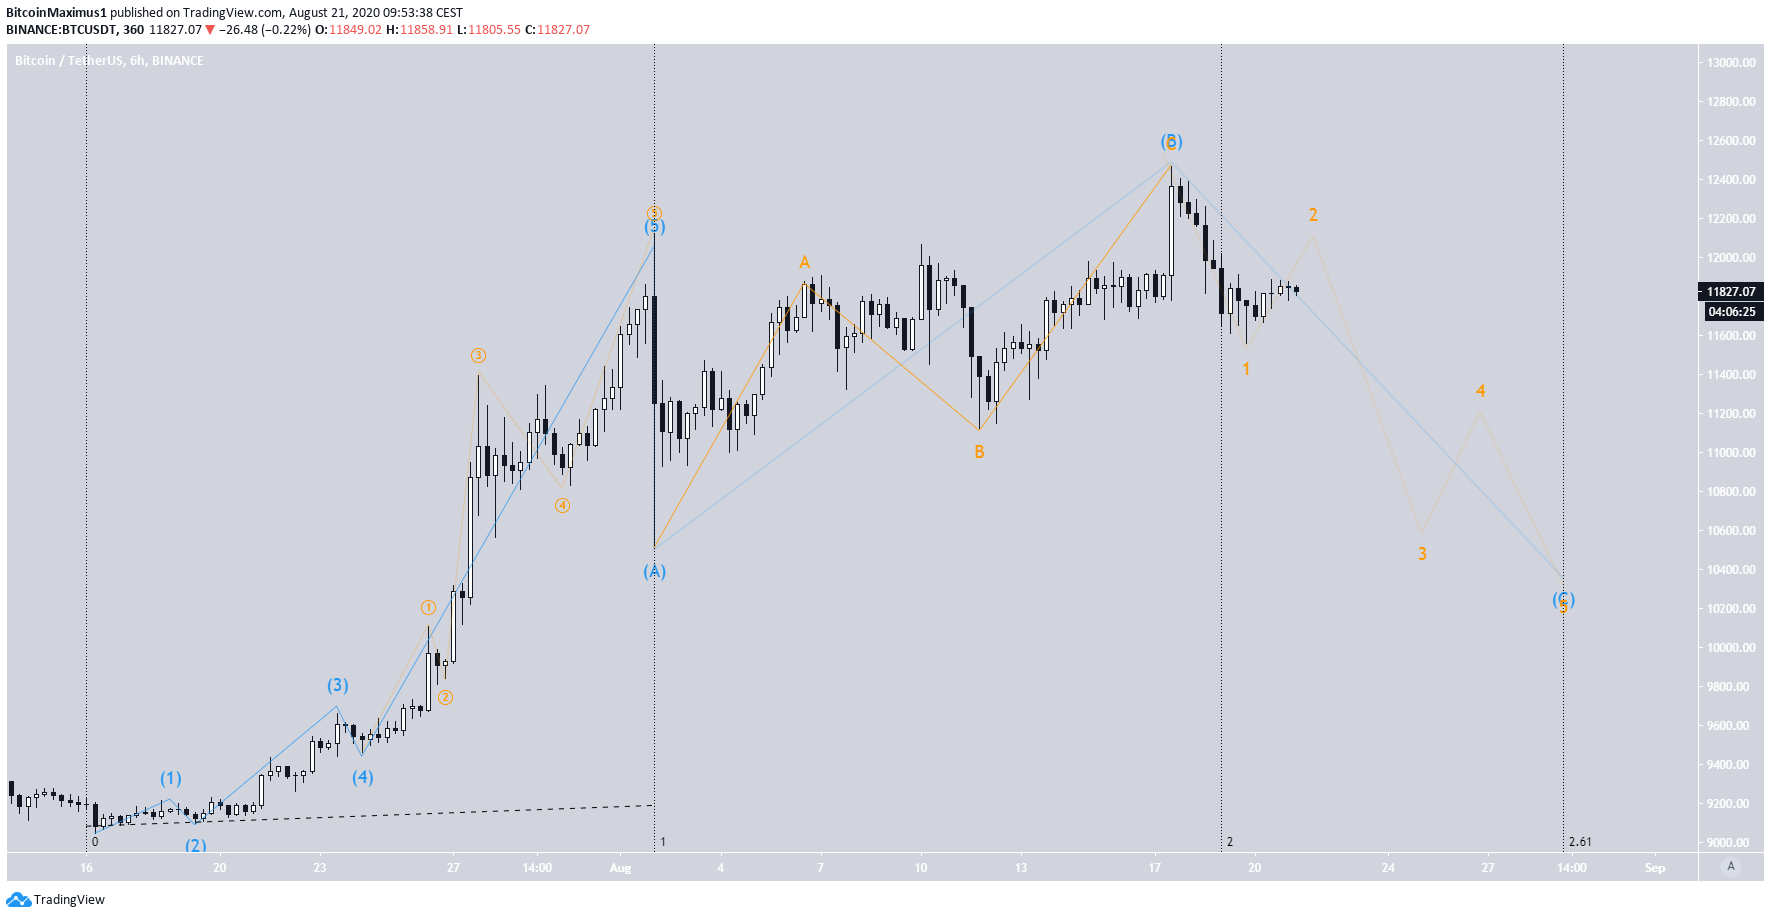
The price is likely in a C corrective wave (blue), which is expected to end in the ranges of $10,954-$10,850 or $9,659-$9,732.
The correction has already taken more time than the preceding upward move, and the next important Fib time target is 2.61. This falls on Aug 29, making this day a likely place for the entire correction to end.
To conclude, it is probable that the Bitcoin price is still correcting, and will resume its downward movement after a short-term bounce back towards $12,100.
For our previous Bitcoin analysis, click here!
